
Spain’s business demographics post-COVID-19: An initial assessment
While the effect of COVID-19 on Spanish business demographics has been unprecedented, it has also been unequal, with certain sectors hit harder or recovering faster than others. For this reason, any economic recovery plan should consider the needs and vulnerabilities of specific sectors.
Abstract: Although previous crises have had adverse effects on business volume indicators and corporate dynamism, the extent to which COVID-19 has impacted Spanish businesses is unprecedented. For example, business turnover in the first few months of the pandemic contracted by nearly twice as much as during the financial crisis. In terms of corporate dynamism, there was an average year-on-year reduction in the number of net new businesses of 72% in April 2020. However, closer analysis reveals that some sectors have been hit harder than others, with the subsequent recovery speeds also differing across industries. While the manufacturing industry contracted for 15 consecutive months during the financial crisis, it has sustained a relatively rapid recovery in turnover during the COVID-19 crisis. Conversely, turnover in the retail sector remains 10% below pre-crisis levels. Although it is difficult to be more precise, evidence suggests that the positive performance within the retail sector comes from the sale of food and everyday products, while the rest of the retail sector is still struggling with uncertainty and difficulties. That said, manufacturing fared less well in terms of business dynamism, where the number of net new businesses contracted by 20%, slightly less than the 22% registered by the hospitality sector (accommodation and food service activities). These data highlight the need to design economic support measures in accordance with each sector’s trajectory, reality and reasonable outlook.
Introduction
Recent publications have looked at the outlook for the Spanish economic recovery following the COVID-19 crisis (Torres and Fernández, 2021) and the challenge of recapitalising the business sector in Spain (Peña and Guijarro, 2021; Torres, 2021). This paper aims to provide complementary analysis by providing a provisional and approximate diagnosis of the impact of the crisis on the business sector. It therefore builds on earlier business demographic and dynamism studies conducted prior to the onset of COVID-19 (Xifré, 2016, 2019).
Unlike those earlier studies, this paper, constrained by data limitations, is unable to address the situation facing the self-employed, focusing rather on corporate dynamics. The reason is that the January 2021 update of the INE database of business demographic statistics that includes the self-employed segment —DIRCE— is not yet available. As a result, the analysis contained in this paper is based on two other INE sources: the business turnover index and the net balance of corporations created/destroyed. We will therefore have to return to the task of analysing the impact of COVID-19 on the entire business landscape, including self-employed professionals, at a later date.
Business turnoverExhibit 1 provides the year-on-year change in the business turnover index, corrected for seasonal and calendar effects, for the economy as a whole, the manufacturing sector, the retail sector and other non-financial services.
[1] The exhibit tracks the monthly figures between January 2003 and January 2021.
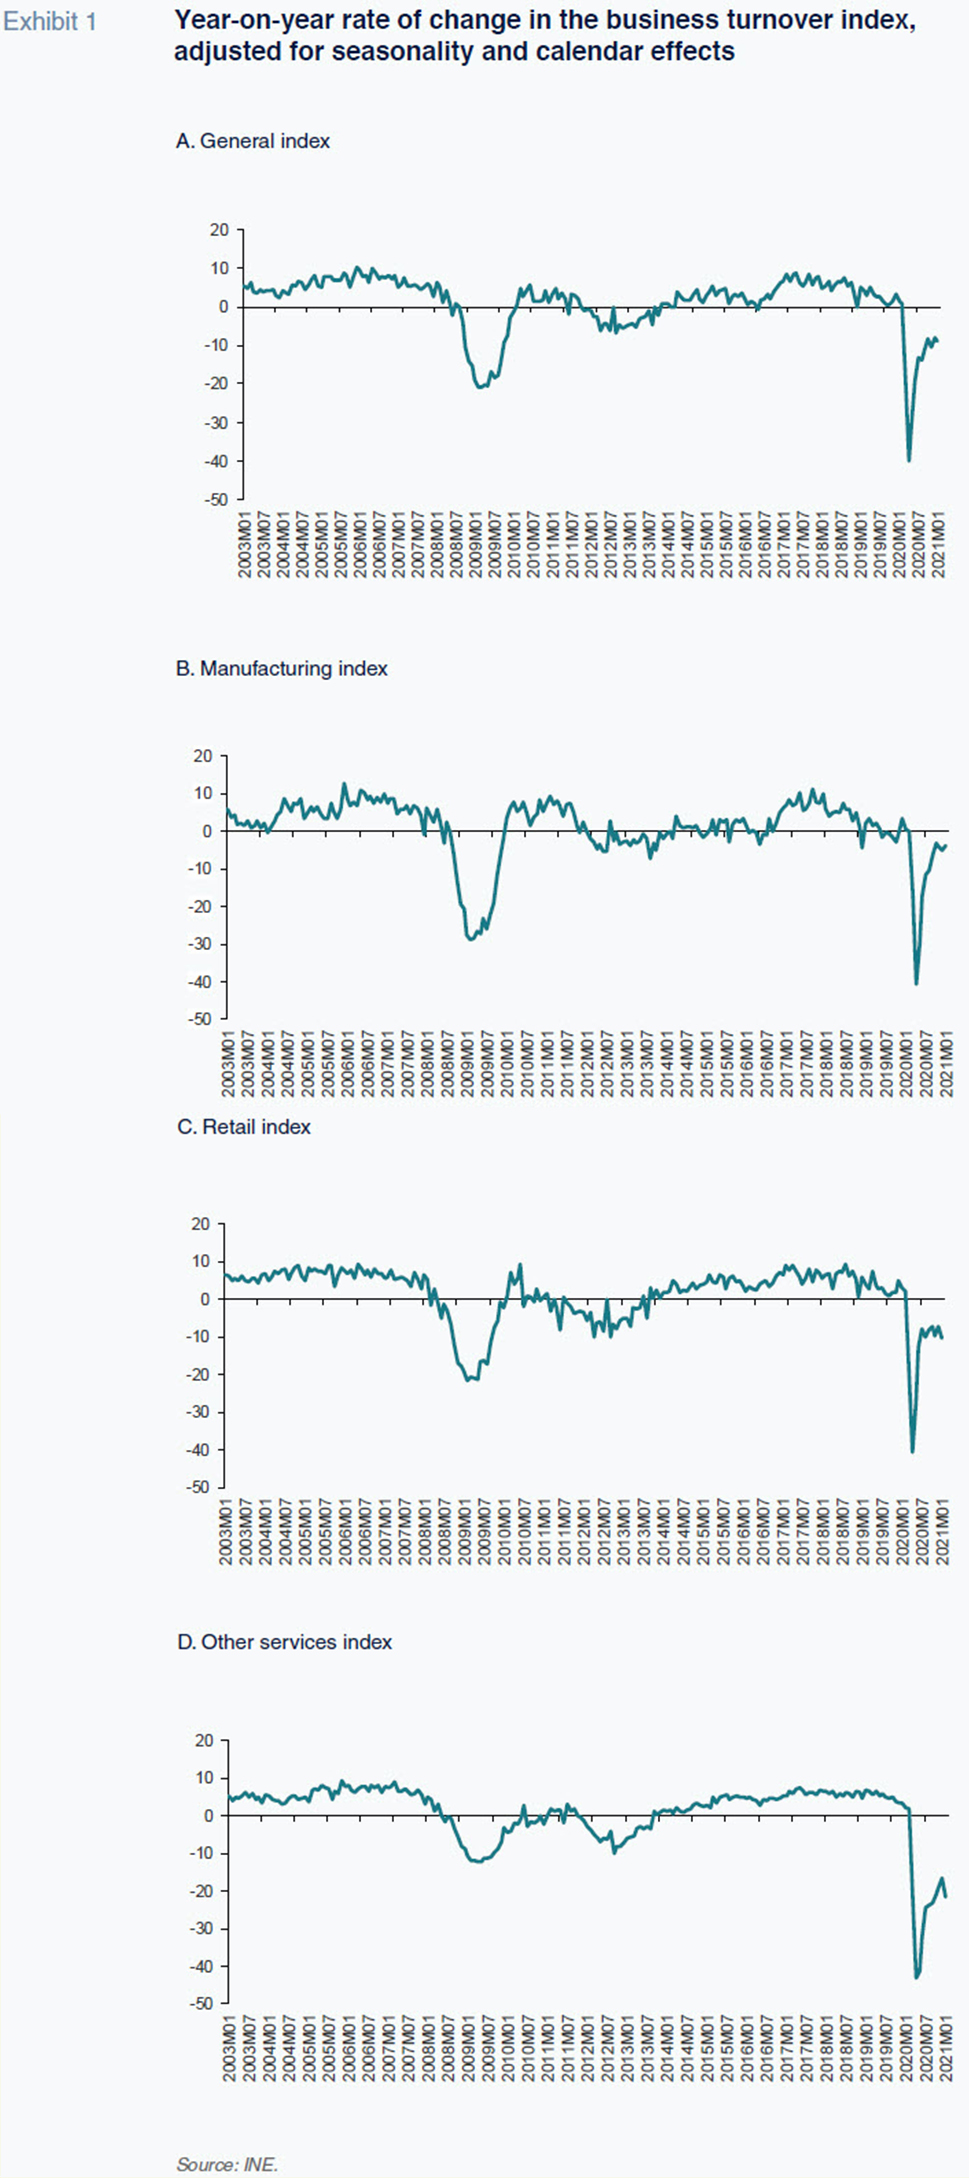
The following facts emerge over the period:
- Other than during episodes of crisis, the year-on-year rates of change remained within a range of 10% in either direction for both the economy as a whole and the individual sectors analysed. Year-on-year changes within that range can therefore be considered compatible with the series’ historical stability.
- The Global Financial Crisis (GFC) (2008-2010) triggered contractions of varying magnitude in the three sectors: ~10% in other non-financial services; ~20% in retail; and ~30% in manufacturing.
- Initially, the COVID-19 crisis generated an extraordinarily abrupt and relatively similar contraction in all three sectors, of approximately 40% year-on-year.
- The path to recovery from that initial rout varies significantly from one sector to another and is also diverging from the patterns observed during the GFC.
To study that last development in greater detail, Exhibit 2 provides two monthly series of the same index, similarly adjusted for seasonal and calendar effects, corresponding to the periods following the Global Financial and the COVID-19 crises. The series are rebased to the last reading prior to each crisis. The first normalised series is rebased to July 2008 = 100 and spans the 15 months until September 2009, while the second series is rebased to February 2020 = 100 and runs until January 2021 (last reading available).
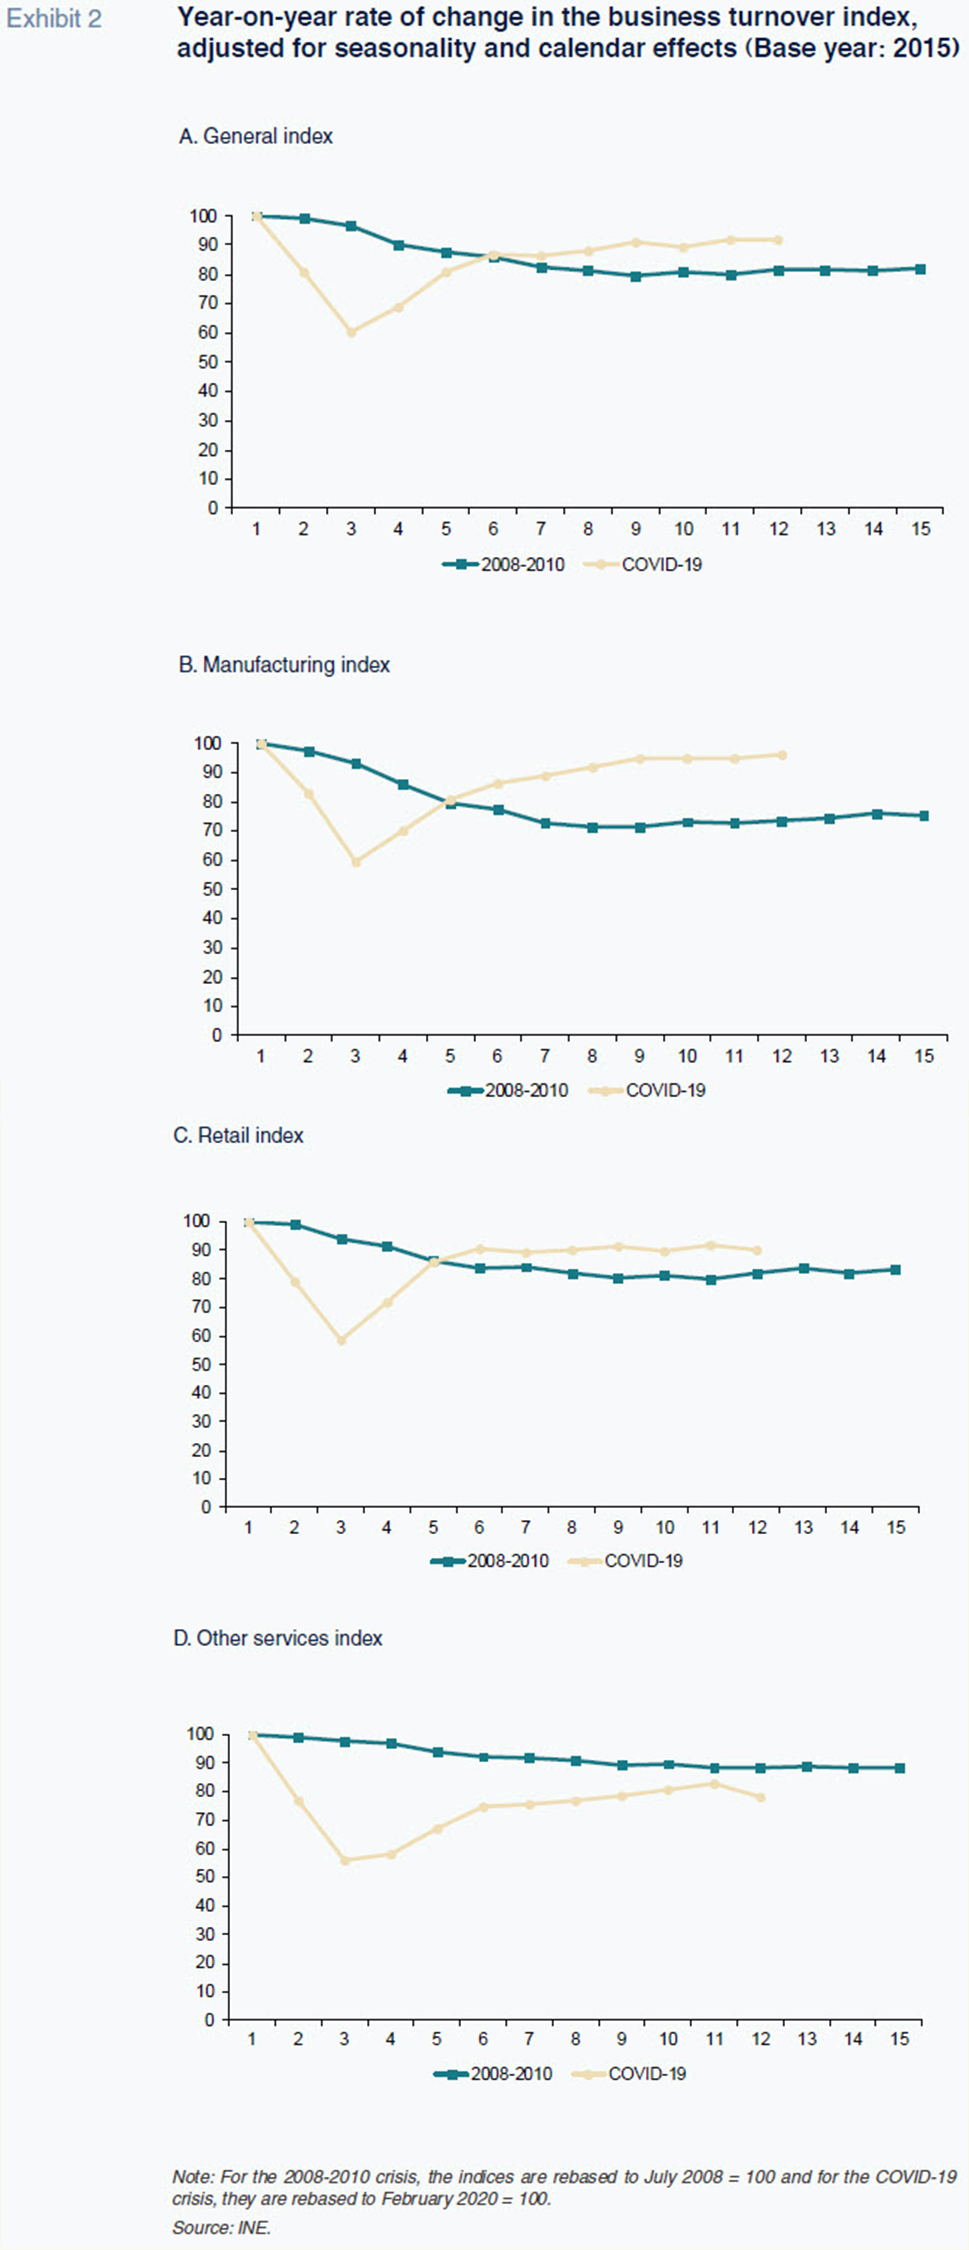
As shown, the manufacturing industry has scaled a relatively rapid recovery in the wake of the COVID-19 crisis, whereas the financial crisis generated monthly contractions that were sustained throughout the 15 months analysed. In fact, the manufacturing companies’ turnover index has almost recovered in full just 12 months after the onset of the COVID-19 crisis (96%). This suggests that a process of reallocation of activity and resources might be taking place within the manufacturing sector by which the strongest, most competitive firms grow while those of smaller size or lower productivity are driven out of the market.
The situation is less positive in the retail sector, where sector turnover remains 10% below pre-crisis levels one year on. In this case it is worth noting that although the available data do not allow for a more in-depth analysis, it is likely that there are significant asymmetries within this sector. It is plausible that the subsector of the sale of food and other daily products is not in particular trouble, but the rest of the retail sector is indeed experiencing difficulties of various intensities.
And the situation in other non-financial services, a classification that includes the hospitality sector, is even more worrying. Not only was the initial contraction more pronounced, the recovery is also proving far weaker and slower, presumably due to the specific adverse impact on those sectors of the mobility restrictions necessary to contain the pandemic. One year after the onset of the COVID-19 crisis, turnover remains 20% below pre-crisis levels for other non-financial services. Overall, business revenue remained nearly 10 percentage points (91%) below pre-crisis levels as of January 2021.
Trend in the number of corporationsTo arrive at a more detailed sector-specific picture of business dynamics, Exhibit 3 depicts the year-on-year rates of change in the net number of corporations created (companies set up less those dissolved) between February 2020 and January 2021. Distinguishing between the companies’ core businesses yields two markedly different trends, depicted in Exhibits 3.A and 3.B, respectively. Exhibit 3.A represents the sectors that have experienced sustained growth in the net number of new businesses created since the COVID-19 crisis, whereas Exhibit 3.B encompasses the sectors in which the trend remains negative.
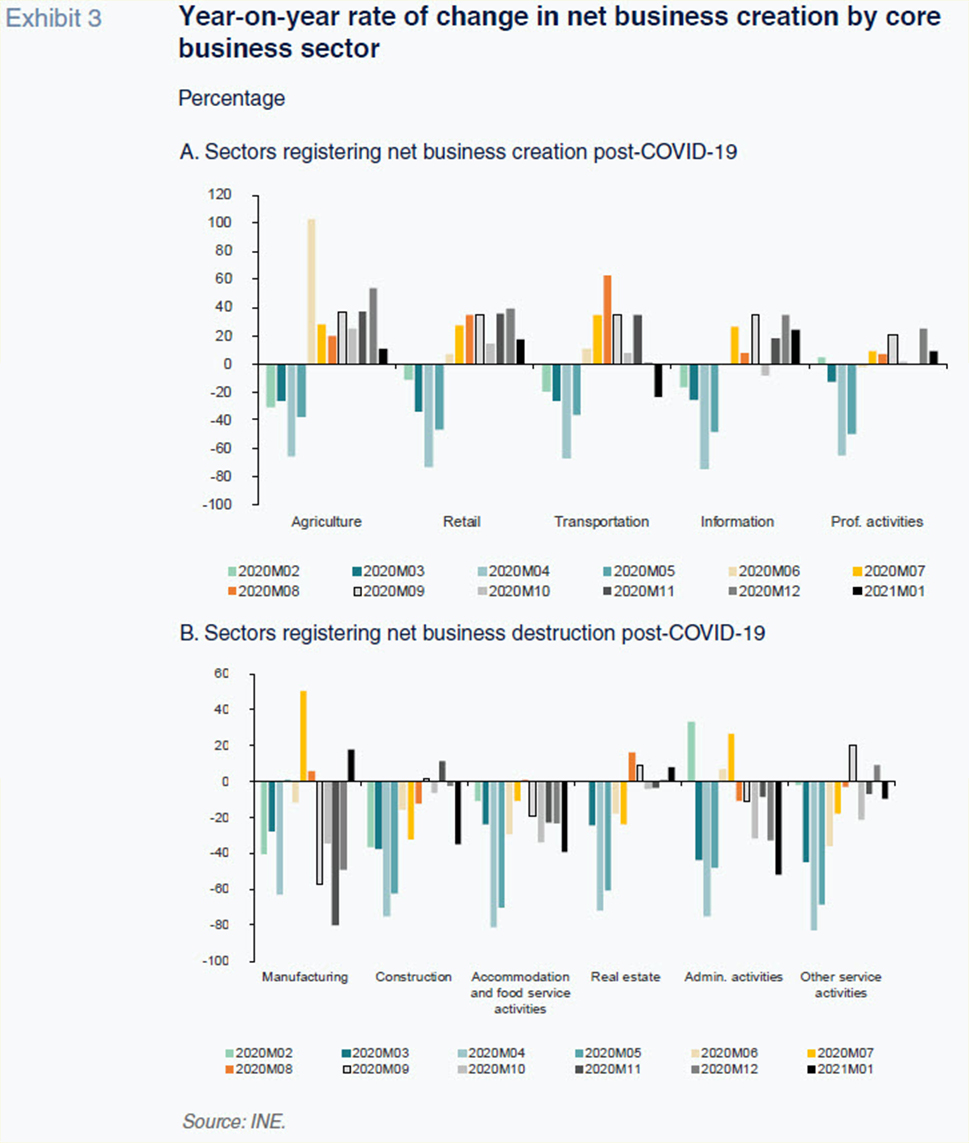
The exhibits reveal that the year-on-year reduction in the number of net new businesses in April 2020 was broadly similar across all sectors, with an average decrease of 72%. There is some divergence from this trend, with the manufacturing (63%), professional activities (65%) and agricultural sectors registering relatively smaller reductions, and hospitality (81%) and other non-financial services (83%) at the other end of the spectrum. It is also worth noting that net business creation fell in all sectors in March 2020 and in most sectors (all except administrative and professional activities), the number of businesses had already fallen in February 2020 (by 11% on average). The January 2020 figures are not included in the exhibit as the manufacturing sector experienced a sharp year-on-year contraction (144%), which would distort the analysis. This was the biggest decline in the sector since 2013 and one for which it is hard to find a natural explanation.
Despite the similarities among sectors before and during the height of the crisis, the trends begin to diverge during the ensuing months. In the sectors represented in Exhibit 3.A, net business creation has been positive, year-on-year, virtually every month between June 2020 and January 2021. As shown in Table 1, the sector experiencing the most dynamic pace of net business creation during the second half of 2020 was the primary sector (39%), followed by the retail sector (26%).
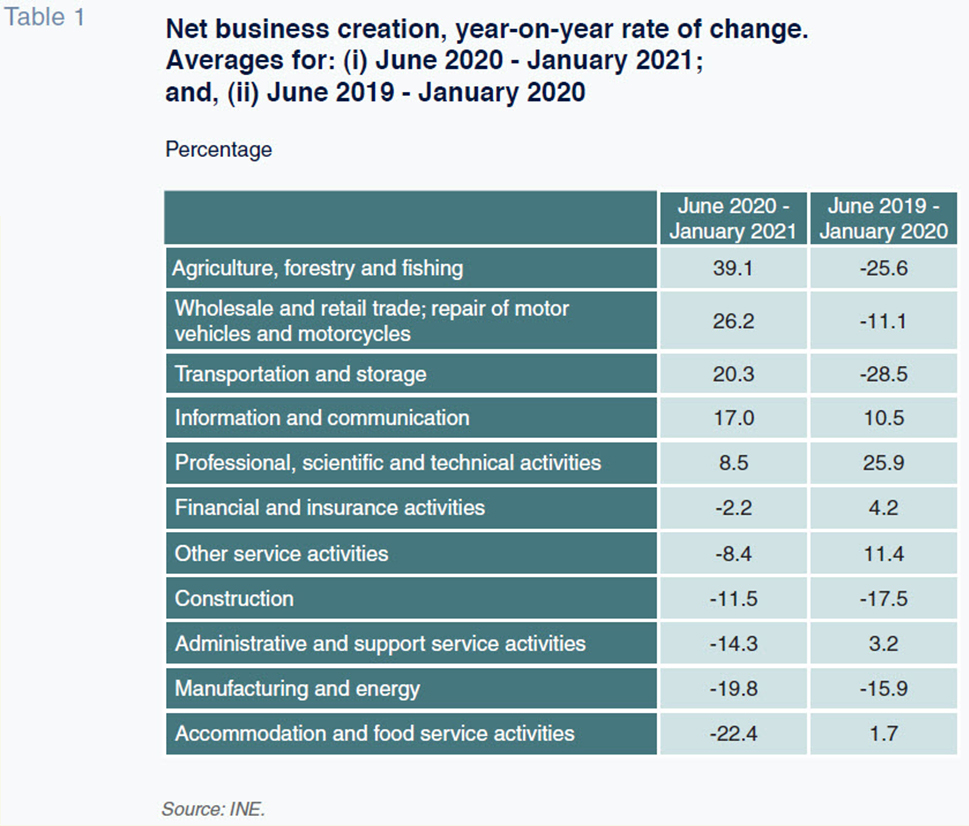
Conversely, in the sectors depicted in Exhibit 3.B the business destruction dynamic has continued during the months since the initial impact of the COVID-19 crisis. Revisiting Table 1, the worst-performing sectors —in terms of the year-on-year averages between June 2020 and January 2021— were hospitality (22%) and manufacturing (20%). The list of sectors that have continued to register net business destruction is rounded out by the construction, real estate, financial & insurance and other service activities.
To put the variability in sector patterns into longer-term context, Table 1 also provides the same rates of change 12 months earlier,
i.e., between June 2019 and January 2020. Exhibit 4 depicts Table 1 graphically and enables a comparison between the average changes in both periods.
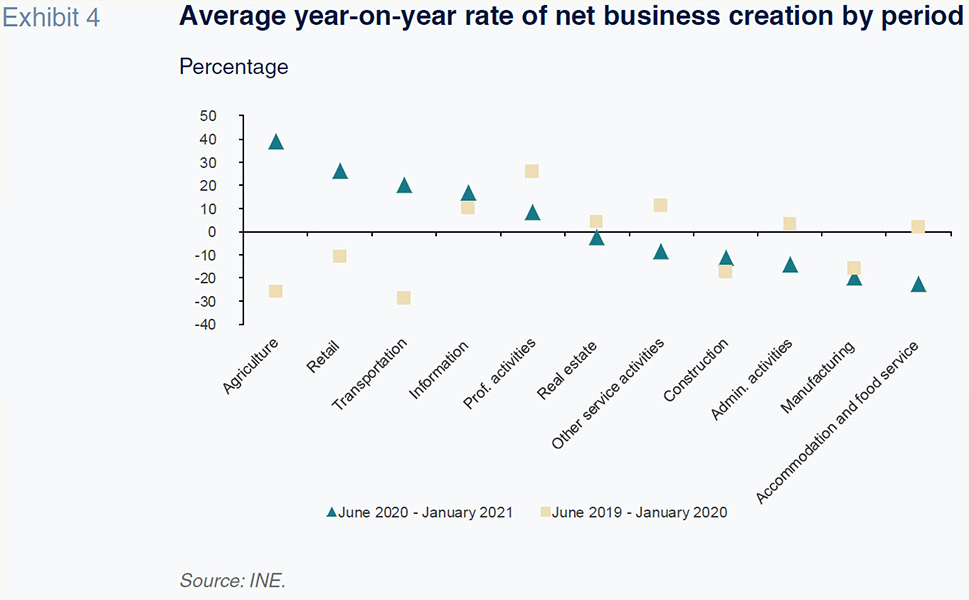
The data allow us to group the sector trends into different categories.
- First, we have a group of sectors with business creation dynamics that are proving similar before and since the COVID-19 crisis. The manufacturing and construction activities have been experiencing sustained business destruction for some time. In the case of telecommunication and information management, the ongoing dynamic is one of net new business creation. Real estate activities constitute a case apart: although the trend has reverted (from net creation to net destruction), the magnitude of the change is scantly significant quantitatively.
- The second category includes a mixed bag of sectors in which business creation dynamics have improved considerably since the crisis. It includes the agriculture, transportation and retail sectors, where the year-on-year average rates of net business creation have gone from being very negative before the crisis to being very positive since. In agriculture and transportation, the differences between the two periods are particularly eye-catching, with gains of 65 and 48 percentage points, respectively.
- Lastly, there are four areas of activity in which business creation dynamics have clearly deteriorated since the crisis: professional activities; other non-financial service activities; administrative and support service activities; and accommodation and food service activities. In the last three sectors, net business creation was increasing before the crisis and has fallen sharply in its aftermath, with the hospitality sector standing out for the magnitude of its decimation. This sector has gone from average year-on-year rates of business creation of 2% to a reduction of over 22%.
Conclusion
This paper provides an approximate and provisional snapshot of COVID-19’s impact on business volume indicators and dynamism and explores differences across sectors, comparing those impacts with the previous crisis and pre-COVID trends.
In terms of business turnover, the adverse impact of the COVID-19 crisis is without precedent, with the initial fallout roughly twice as large as the initial impact of the GFC. Nevertheless, the recovery in certain sectors, including manufacturing, has been relatively swift and far more intense than was seen in the wake of the financial crisis. The trend in revenue in other service activities, a category that includes the hospitality sector, is, unfortunately, far less encouraging, with turnover remaining below 80% of pre-crisis levels.
In terms of business dynamics, the available figures relate only to corporations and do not include the self-employed. It is possible to clearly single out three areas in which business dynamism has improved since the crisis: agriculture; retail trade; and transportation. Although it is very probable that the improvement observed reflects momentum in the wake of such a sharp initial contraction, some sectors have been registering net positive year-on-year growth in new businesses for eight months in a row. At the other end of the spectrum lie the construction, manufacturing and hospitality sectors, in which business destruction has continued in the aftermath of the crisis. In the hospitality sector, the change in trend is pronounced, with the sector having posted net new business creation prior to the pandemic.
The joint interpretation of the business turnover and business creation readings points to polarisation of the business landscape, both across and within sectors. Based on the data at hand, which run until January 2021, it is clear that some sectors, such as agriculture and transportation, are recovering vigorously from the crisis. The crisis has decimated the hospitality sector and the sub-sectors most reliant on it, with unpredictable consequences. The current state and perspectives for the manufacturing sector look mixed: there is a contraction in the number of new enterprises created but a significant recovery in this sector’s turnover. This observation is compatible with a process of concentration of economic activity and labour in those manufacturing companies that are more competitive. In the retail sector, turnover continues to fall in the wake of the crisis but net business creation is recovering. In this case, it is very likely that there is asymmetric behaviour across subsectors, with the segment of food and daily products keeping a certain stability coupled with a troubling situation and perspectives for the rest of the retail sector.
All of the above highlights the need to design economic support measures in accordance with each sector’s trajectory, reality and reasonable outlook. More specifically, governments need to ensure respect for legal and desirable labour conditions and to promote job stability to the maximum extent possible.
Notes
Following the NACE codes, activities are classified as follows for revenue tracking purposes: mining & quarrying and manufacturing industries (codes B-C); wholesale and retail trade; repair of motor vehicles and motorcycles (code G); other non-financial services, which includes transportation and storage; accommodation and food service activities; professional, scientific and technical activities; and administrative and support service activities (codes H-N, except for K).
References
PEÑA, I. and P. GUIJARRO (2021). The challenge of recapitalising Spain’s corporate sector.
Spanish Economic and Financial Outlook, Vol. 10, No. 2, March 2021. Retrievable from:
http://www.sefofuncas.com/Spain-in-year-two-of-the-pandemic/The-challenge-of-recapitalising-Spains-corporate-sector TORRES, R. (2021). State aid to enterprises in Germany, Spain, France and Italy.
Funcas Blog. Retrievable from:
https://blog.funcas.es/las-ayudas-directas-a-empresas-en-alemania-espana-francia-e-italia/ TORRES, R. and FERNÁNDEZ, M. J. (2021). The economic outlook following the third wave of Covid-19.
Spanish Economic and Financial Outlook, Vol. 10, No. 2, March 2021.
XIFRÉ, R. (2016). Spain’s business landscape: Structure, recent developments and remaining challenges.
Spanish Economic and Financial Outlook, Vol. 5, No. 3, May 2016. Retrievable from:
http://www.sefofuncas.com/European-banks-in-the-face-of-new-regulatory-pressures/Spains-business-landscape-Structure-recent-developments-and-remaining-challenges XIFRÉ, R. (2019). Business dynamism in Spain: Recent trends and outlook.
Spanish Economic and Financial Outlook, Vol. 8, No. 4, July 2019. Retrievable from:
http://www.sefofuncas.com/The-role-of-Spains-financial-sector-Taking-stock-of-key-metrics/Business-dynamism-in-Spain-Recent-trends-and-outlook
Ramon Xifré. ESCI – UPF, UPF Barcelona School of Management, PPSRC – IESE