Spain’s business landscape: Structure, recent developments and remaining challenges
Business creation in Spain is recovering for the first time since the latest crisis. However, some recent trends in business demography and innovation dynamics are raising questions regarding existing and potential future challenges for strengthening Spain´s business landscape.
Abstract: Spain’s business landscape has undergone major ups and downs, with a period of rapid growth up until 2008, followed by a phase of severe business destruction up until 2014. Fortunately, in 2015, there was a return to net business creation in Spain for the first time since the crisis. However, the way in which the business landscape is recovering raises some questions. Firstly, the number of self-employed people is rising rapidly, while the number of joint-stock companies continues to fall, and the number of limited companies is recovering only slowly, suggesting a substitution effect in the organisation of work. Secondly, the number of Spanish firms innovating – a key vector in boosting the country’s competitiveness – plummeted between 2008 and 2014 (the most recent year for which data are available). This affected both technology firms and non-technology firms. Recently published studies have addressed the various – often interrelated – economic problems affecting Spain, and holding back growth, from a wide range of perspectives and have proposed measures for tackling them, including improving human capital and promoting innovation, among others.
Introduction
The Spanish economy will only be able to recover if its companies recover and improve their productivity. Although this statement may seem obvious, it entails an effort to better understand the Spanish business landscape: its structural characteristics, recent evolution, and main outstanding challenges.
This article aims to address these points. First, it reviews the literature on the basic features of Spanish companies, which have remained fairly stable over time, and their best-known limitations, in terms of size and productivity. The data studied in this section are compared with those from four other large EU economies and cover the period up to 2011.
Second, the article analyses the most recent data on business dynamics in Spain, based on the INE’s Central Business Directory (DIRCE in its Spanish initials), which, in most cases, covers the period up to December 31st, 2015. This section pays particular attention to the dynamic behaviour of Spain’s business demography, distinguishing between the legal nature of its businesses.
Third, this article takes a closer look at innovation activities (both technological and non-technological), which are a key factor in raising businesses’ competitiveness.
Finally, the article concludes with an assessment of the results and looks at some of the proposals recently made by various authors to strengthen Spain’s business landscape.
Structural features of Spanish companies
The main structural features of Spanish companies are well known, thanks to a number of recent studies (see, for example, Huerta Arribas and Salas, 2012; Instituto de la Empresa Familiar, 2013; Fundación BBVA-Ivie, 2014; Huerta Arribas and Salas, 2014; Fariñas and Huergo, 2015; Andrés and Doménech, 2015).
As Fariñas and Huergo (2015) point out, Spain’s business landscape is dominated by micro-enterprises and differs from that of other neighbouring countries in that it has a smaller proportion of large companies. These authors, based on OECD data, give a breakdown of employment and value added in the economy by company size in 2011 for the five biggest EU economies (Table 1).
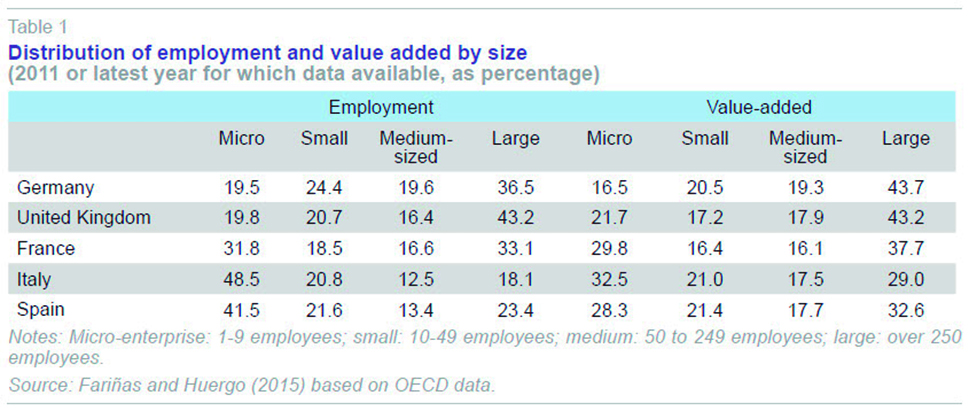
As the table shows, the size distribution of businesses in Spain is skewed towards the smallest companies. This combines with another important fact, namely the lower productivity of smaller Spanish companies when compared to similarly sized firms in other countries. In conjunction, these two factors explain a large part of the difference between the Spanish economy’s productivity and that of neighbouring economies.
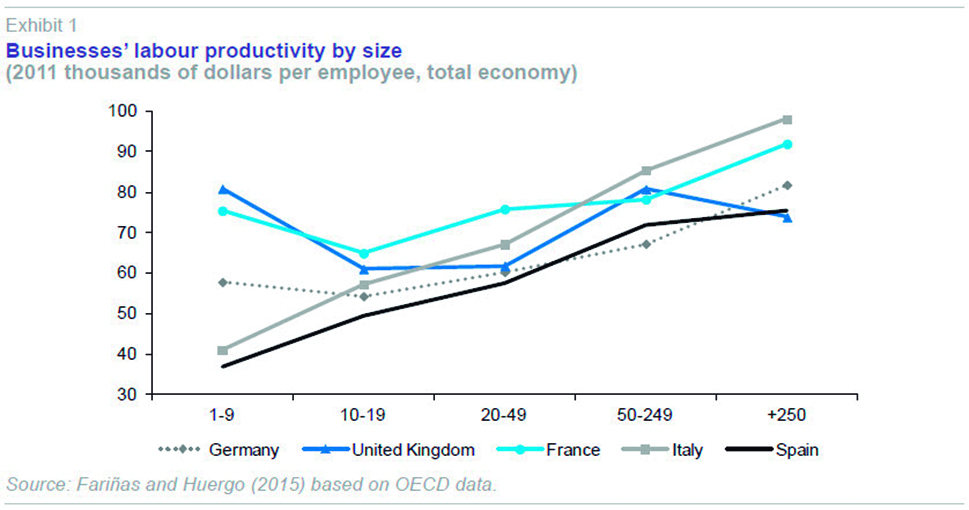
Using OECD data for 2011, Fariñas and Huergo (2015) find labour productivity in Spanish companies with fewer than 50 employees to be lower than in the five largest EU economies (Exhibit 1). Using OECD data for 2010, Andrés and Doménech (2015) confirm small Spanish firms’ productivity gap qualitatively in both manufacturing and services.
The significance of company size for the economy’s competitiveness is an established fact, as highlighted by the studies mentioned above. Larger companies are better situated to take on key activities to improve their products, processes, and devote more resources to them. This enables them to raise their competitiveness by investing in innovation and participating in internationalisation processes. Relatively large companies also tend to have access to bank finance on better terms and are better able to tap credit markets in general. They often have departments specialising in managing some of the legal requirements associated with business activity (Instituto de la Empresa Familiar, 2013).
However, it is worth noting, as Huerta Arribas and Salas (2012 and 2014) point out, that the causal relationship between company size and productivity is complex and it cannot simply be assumed that increasing company size will improve productivity. After analysing the wealth of literature on the subject in Spain and elsewhere, they suggest that it is more plausible that there are fundamental factors determining both company size and productivity and competitiveness. They point to the role that “the endowment of human capital, professional standards of company management, and implementation of good practices encouraging more decentralised company operation” can play an important part (Huerta Arribas and Salas, 2014).
Recent developments in Spain’s business demography
2008 was a clear turning point in the recent evolution of Spain’s business demography. In the period prior to the outbreak of the economic crisis, new business formation, understood broadly to include self-employed as well as all kinds of legal persons (joint-stock companies, limited companies and other types of companies) exceeded closures by a wide margin. The data for the analysis in this section come mainly from the Central Business Directory (DIRCE) maintained by the National Statistics Institute (INE) and refer to December 31st of each year.
Between 1999 and 2008, an average of around 100,000 businesses (94,386) a year were created (net). Growth was particularly strong in 2007, with the creation of over 160,000 businesses, and in 2004 − 2006 net new business registrations exceeded 120,000 a year (Exhibit 2).
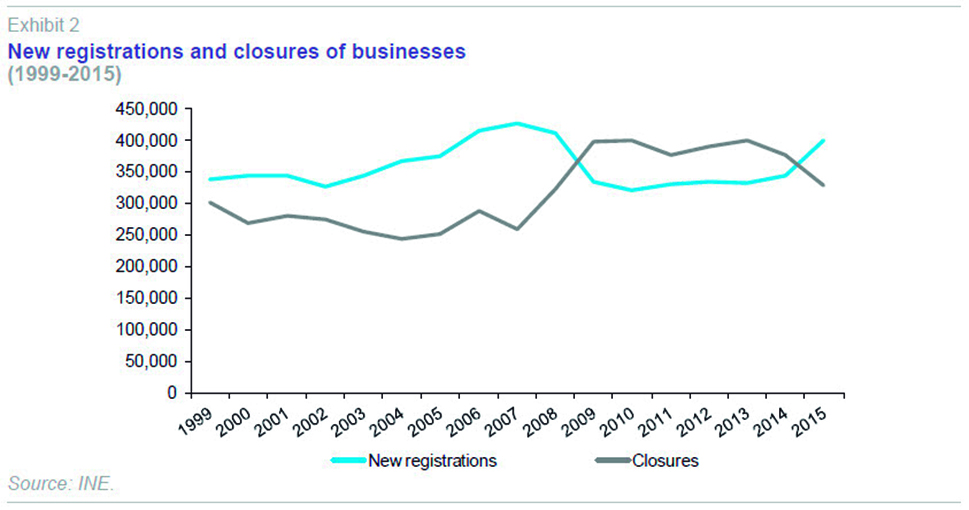
As the study by the Instituto de la Empresa Familiar highlights, this wave of new business creation was largely due to the boom in the construction industry, which accounted for 42% of new registrations between 1999 and 2007 (Instituto de la Empresa Familiar, 2013).
They dynamics of business creation began to change in Spain in 2009, with net business contraction just under 60,000 businesses (57,509) a year until 2014. As can be seen from Exhibit 2, the pattern changed again in 2015, the first year in which there was a net positive business registration rate (70,054) since the crisis, reflecting a slight recovery in Spain’s business landscape.
However, the recovery was atypical in historical terms on account of the composition of the businesses created. Exhibit 3 shows the net business registration figures broken down by legal nature.
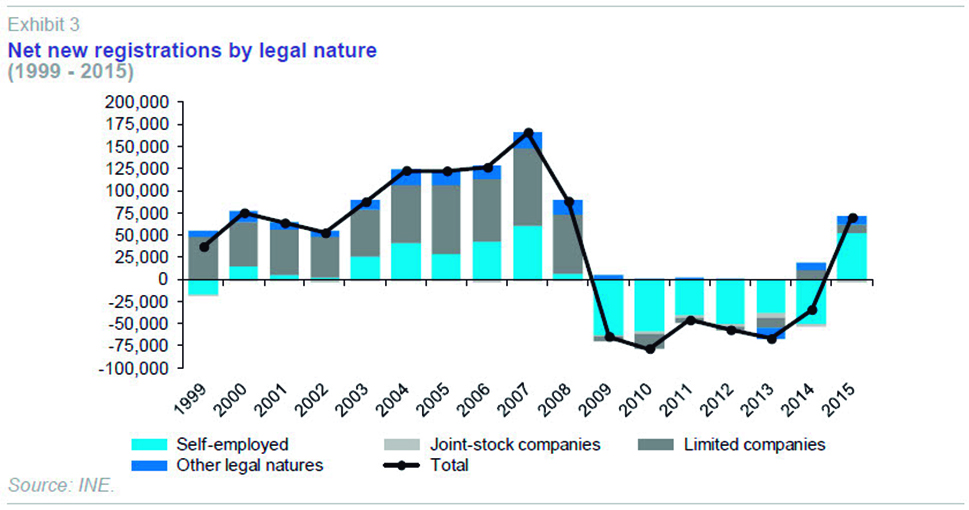
As can be seen, most of the net business registrations in 2015 (75%) were self-employed persons. This represents a difference from the trend prior to 2008, when limited companies made up the largest share of new businesses. In the absence of more information and trend analysis, the data suggest that the business recovery could in part be being sustained by a process of substitution of legal nature, in which self-employed persons replace legal persons (limited companies, in particular).
Taking into account the absolute number of businesses registered as active in the DIRCE, Exhibit 4 shows the number of businesses of each legal type, standardising the value of each series based on the value in 2008.
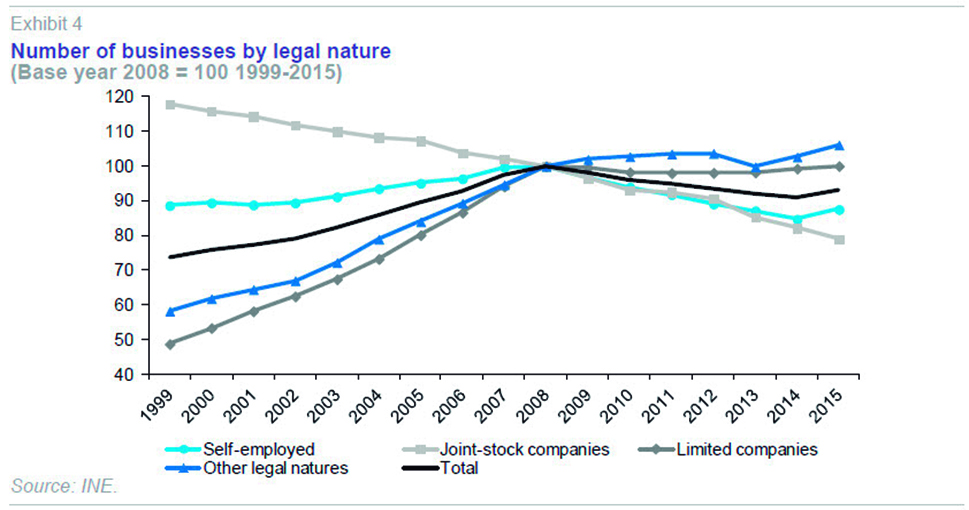
As can be seen, the number of joint-stock companies declined continuously between 1999 and 2015, and 2008 did not seem to have any additional impact on this trend. As a result, the number of joint-stock companies active in 2015 is 20% less than in 2008. In the case of limited companies, growth in net terms in 2014 and 2015 compensated for the drop in the years 2009 to 2013, with a similar total number of businesses active as in 2008. In the case of self-employed persons, the large increase in 2015 has not totally compensated for the losses experienced between 2008 and 2014. As a result, in 2015, the number of people registered as self-employed was still less than 90% of that in 2008. The business types on a clear upward trend since 2008 are the other types of legal natures (mainly corporate partnerships, partnerships, joint ownership, autonomous agencies, although no disaggregation is possible).
Demography of business innovation
To complete this overview of business trends in Spain, this section presents the most recent data available (from 2014) on Spanish businesses that carry out some form of innovation activity, drawn from the INE Innovation Survey.
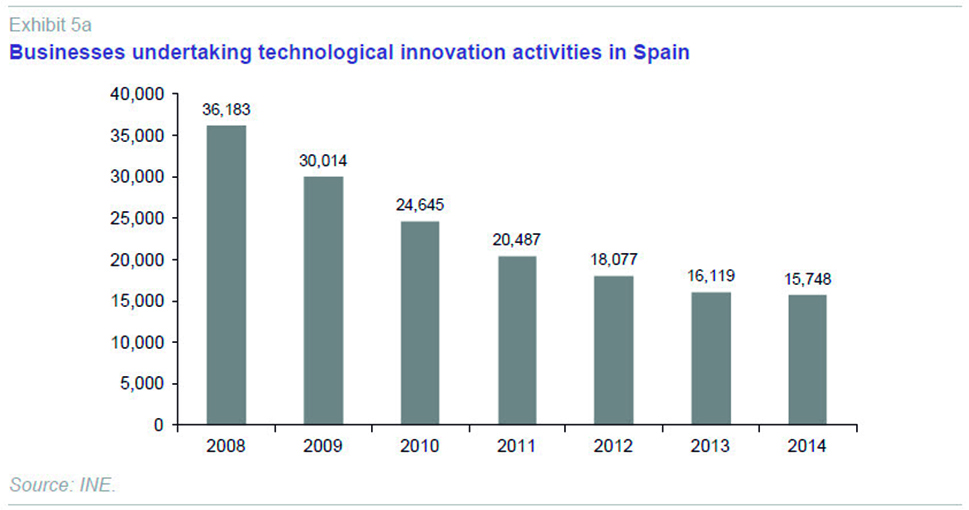
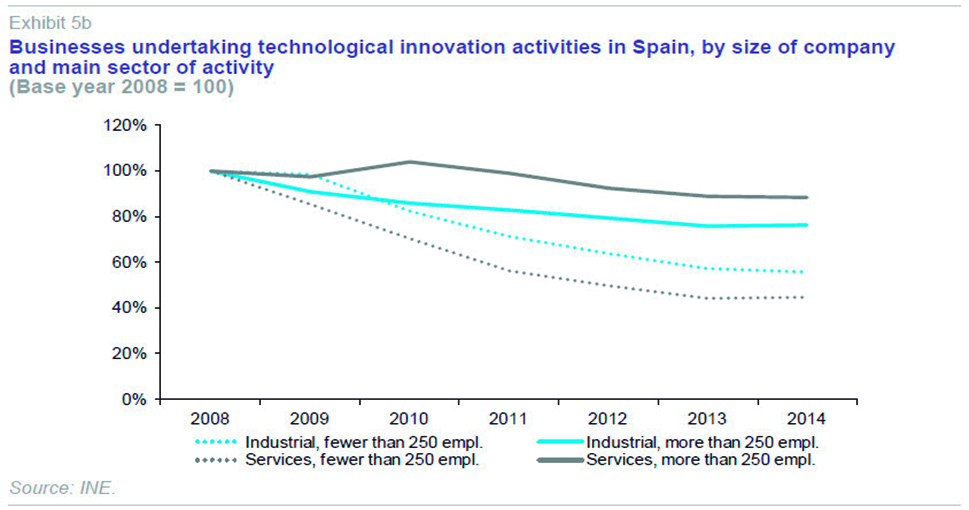
Exhibit 5a shows the number of Spanish businesses undertaking technological innovation activities in any year during the period 2008-2014. Exhibit 5b shows a breakdown of the number of businesses in four categories obtained by crossing-referencing two dimensions: the business’ main activity (manufacturing industry or services) and its size (whether it has more than 250 employees or not) and it shows the number of businesses in each year relative to that in 2008.
Exhibits 6a and 6b present analogous information for Spanish businesses that have conducted non-technological innovation activities.
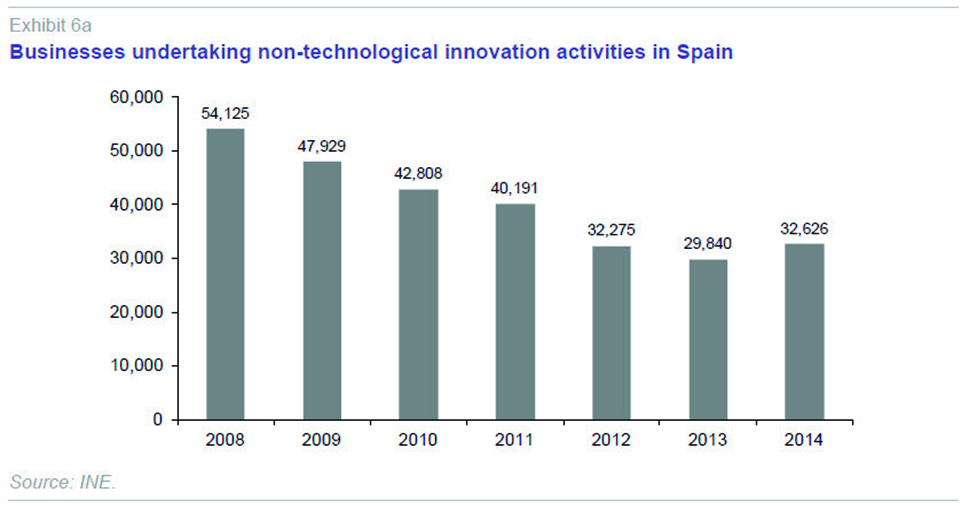
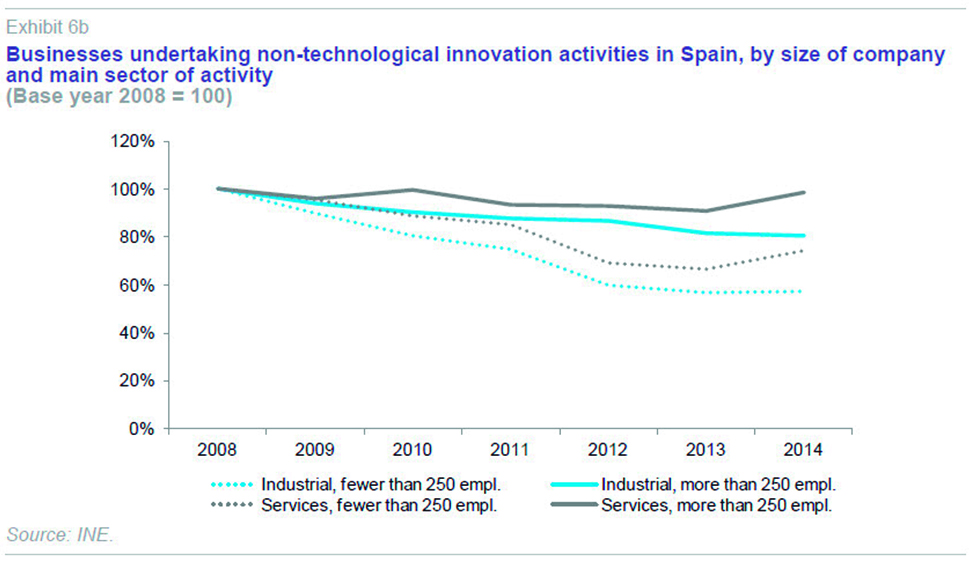
As can be seen, there has been a significant decline in the number of Spanish businesses carrying out innovation activities between 2008 and 2014, the drop being bigger in the case of technological innovation. Just 44% of companies that were technologically innovative in 2008 continued to be so in 2014, while in the case of non-technological innovation, the figure is almost 60% of the initial value.
This slump in business innovation activity manifests itself differently according to the business profile.In general, the reduction affects small businesses (fewer than 250 employees) much more than larger ones. Indeed, for large companies, regardless of the type of innovation (technological or non-technological) and their main sector of business (industry or services), the number of companies undertaking innovation activities in 2014 was more than 80% of the 2008 figure.
Conversely, businesses with fewer than 250 employees suffered a very sharp drop in innovation, particularly in the case of technological innovation (and this was especially severe in the services sector, where the level of innovation activity in 2014 was just 40% of that in 2008) and in that of non-technological innovation in industry.
Conclusion and remaining challenges
Spain is putting the worst years of the crisis behind it. This is reflected in the main macroeconomic indicators and in key microeconomic variables, such as those relating to business demography and dynamics. Whereas, in net terms, Spain experienced business destruction between 2009 and 2014, in 2015, there was a return to net growth, as had been the case in the years prior to the crisis.
However, the way in which the business landscape is recovering leaves some questions unanswered.
First, the recovery in the number of businesses in 2015 has mainly been driven by the sharp rise in the number of people becoming self-employed, and this suggests that job contracts are being replaced by business relationships between companies and self-employed people. There is insufficient data to evaluate this trend, but if it becomes established, it will require more analysis to understand its consequences.
Second, the economic recovery does not generally seem to be based – with some exceptions – on the acquisition and application of knowledge by businesses. This can be observed at the macroeconomic level (Xifré, 2015) and it is also apparent at the microeconomic level. The number of companies undertaking innovation activities (technological and non-technological) plummeted between 2008 and 2014, the most recent year for which data is available.
These two recent phenomena are in addition to the structural conditions that differentiate Spain’s business landscape from that of neighbouring countries: a larger share of small businesses, and on average – with exceptions – lower productivity among these smaller businesses.
Numerous proposals for changes or reforms have been made to address these challenges. We briefly mention two of these proposals. Huerta Arribas and Salas (2014) highlight the importance of improving human capital, making business management more professional, increasing delegation and worker participation, and strengthening the mutual trust between employees and employers. In a complementary way, Andrés and Doménech (2015) agree on the importance of promoting the accumulation of human capital, and also highlight that action is needed to promote innovation, encourage companies to take risks and foster employees’ careers.
Just as Spain has had to undergo a far-reaching reform of the labour market to raise its competitiveness, these reflections seem to suggest that a “business reform” is also needed to resolve some of the issues alluded to here.
References
ANDRÉS, J., and R. DOMÉNECH (2015),
En busca de la prosperidad, Ed. Deusto.
FARIÑAS, J. C., and E. HUERGO (2015), “Demografía empresarial en España: tendencias y regularidades,” FEDEA,
Estudios sobre la Economía Española, 2015/24.
FUNDACIÓN BBVA – Ivie (2014),
Crecimiento y competitividad. Los desafíos de un desarrollo inteligente, (F. PÉREZ, Ed.).
HUERTA ARRIBAS, E., and V. SALAS (2012), “La calidad del recurso empresarial en España: Indicios e implicaciones para la competitividad,”
Papeles de Economía Española, nº. 132.
— (2014), “Tamaño de las empresas y productividad de la economía española,”
Mediterráneo Económico, vol. 25.
INSTITUTO DE LA EMPRESA FAMILIAR (2013),
El dinamismo empresarial en España: diagnóstico de situación y propuestas, Documento 169, (Á. ESTRADA and R. XIFRÉ, eds.).
XIFRÉ, R. (2015), “Una recuperación sin I+D,” Blog Nada es Gratis,
http://nadaesgratis.es/admin/una-recuperacion-sin-id
Ramon Xifré. ESCI-Universitat Pompeu Fabra and Public-Private Sector Research Center, IESE Business School