
Business dynamism in Spain in the wake of recent crises
The majority of the 3.2 million economically active enterprises in Spain as of 1 January 2023 are pursuing organic growth, in which their headcount increases in line with their number of years in business. As there appears to be a divide between the sectors that are home to a higher number of active firms and the sectors with a higher incidence of startups, there could be scope for creating value by fostering collaboration between these two spheres – Spain’s legacy businesses and the startup ecosystem.
Abstract: Spain was home to 3,207,580 economically active enterprises as of 1 January 2023, growth of 0.5% from 2022. Over two-thirds of the total have been in business for less than 11 years. 57% of these businesses are natural persons and have no employees, while 92% have five or fewer employees. A combined analysis of the business population’s age and headcount shows that larger companies tend to have been in business longer. For the three main legal structures –natural persons, public limited companies (PLC) and limited liability companies (LLC)– the sectors with the biggest business populations are wholesale and retail trade, building construction, specialised construction services and real estate services. The 10 sectors of the economy with the largest business populations account for between 60% and 70% of all firms across these three forms of incorporation. In terms of turnover, most sectors, other than the retail sector, reported growth in 2023 and also in the first two months of 2024. As well, the studies on entrepreneurship in Spain point to a very significant gender gap across the business population (80% male and 20% female). Broadly speaking, analysis points to a clear divide between the sectors that are home to a higher number of established firms and the sectors with a higher incidence of startups, with the sole exception of the food industry. Essentially, it could be interesting to take a closer look at the scope for creating value by fostering collaboration between these two spheres: Spain’s legacy businesses and the startup ecosystem.
Foreword
The Spanish economy remained dynamic in 2023, reporting almost two points more growth than the Eurozone (2.4% versus 0.4%). In the near-term, there are signs of a slight slowdown in 2024, shaped by the contractionary shift in monetary policy and a host of prevailing uncertainties (Torres et al., 2024). The Bank of Spain recently highlighted a few key structural challenges which the Spanish economy needs to tackle if it to bring its income per capita in line with the Eurozone economies (Hernández de Cos, 2024).
This article attempts to round out the macroeconomic assessment with a microeconomic analysis of the business population in Spain. The goal is to zoom in on how economic activity has organised and structured itself business-wise and what that structure could mean for growth in the near-term.
Indeed, the Bank of Spain noted the importance of business size and composition as a key factor for convergence with the Eurozone. In a nutshell, the average size of enterprises in Spain is relatively small and their churn (start-up and failure rates) is relatively low. These facts constrain the economy’s potential productivity gains and, thereby, impede convergence with the economies at the forefront of the Eurozone and EU. This assessment is consistent with the conclusions reached in earlier studies of the business population in Spain (Fariñas and Huergo, 2015; García Perea, 2022; Xifré, 2016, 2021, 2022).
In this paper, we base our findings on data taken from three INE databases (DIRCE; the services sector activity indicator; and the industrial turnover index) linking them together using the NACE codes. We also draw from some interesting data about entrepreneurship in Spain (South Summit, IE University 2023).
Analysis of the number of enterprises
The main data source used to analyse the business population in Spain is the central company database, DIRCE, compiled by the National Statistics Office, the INE. Note that following the entry into force of Regulation 2019-2152 on European business statistics, certain changes were made to this database’s statistical methodology in 2022. The new definition of an economically active legal unit, implemented in 2022, affects the active business count and means that the figures from 2022 onwards are not comparable with the rest of the series.
As a result, this paper cannot provide an analysis of business start-up and destruction flows over time or a breakdown of those flows over time as a function of different criteria, such as their legal form or core business (Xifré, 2021, 2022). The new statistical methodology invites us to approach the Spanish business population in new ways, without the historical perspective, making the most of new data regarding company age, for example.
According to the DIRCE, Spain was home to 3,207,580 economically active enterprises as of 1 January 2023, growth of 0.5% from 2022. Exhibit 1 provides the breakdown of those companies using three parameters: their age in years, number of employees and legal form of incorporation.
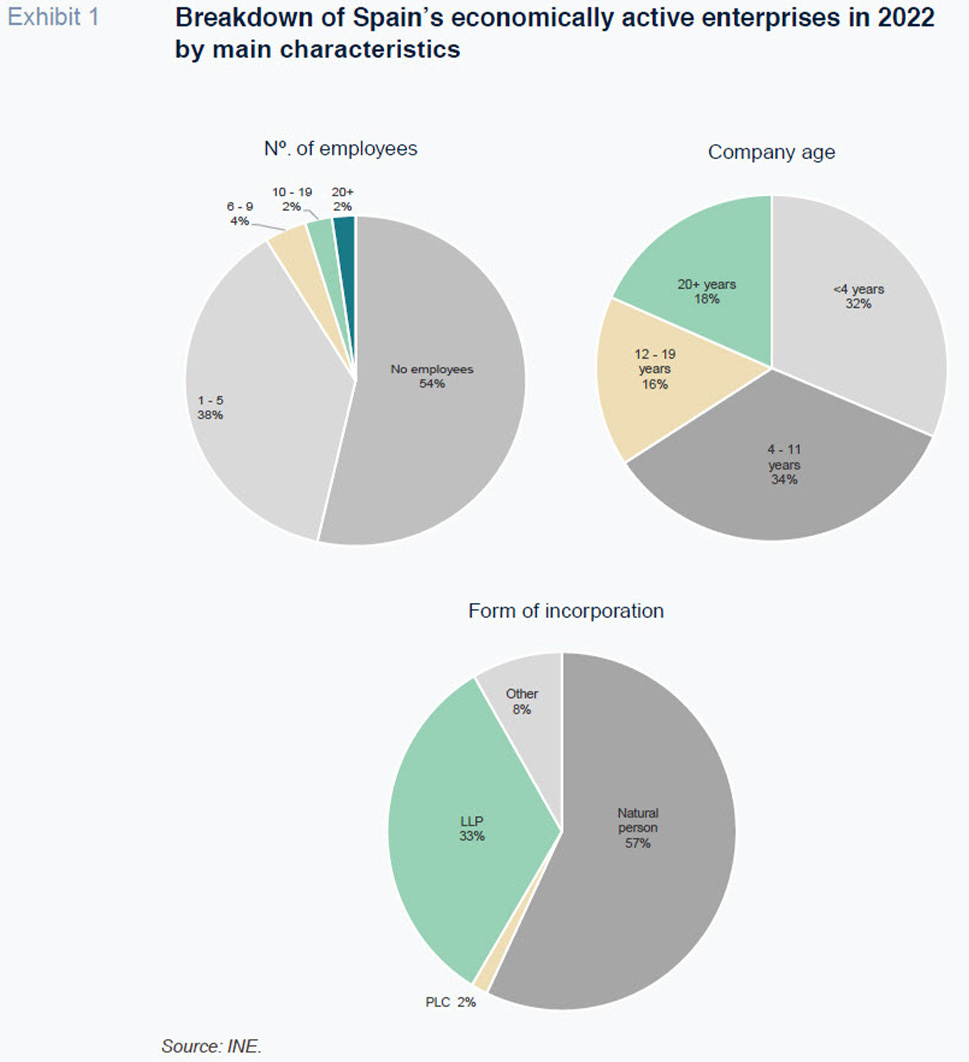
With respect to their age, more than two-thirds of the firms have been in business for less than 11 years, with a roughly equal amount in business for less than four years and for between four and 11 years. By the same token, the remaining third are evenly split between businesses that have been around for between 12 and 19 years and those that have been in existence for more than 20 years.
As for their headcount and legal form, over half of the 3.2 million units are natural persons (57%) and have no employees (54%). Thirty-eight percent have between one and five employees and just 2% have more than 20 employees. In other words, 92% of Spain’s businesses have five or fewer employees. One-third of the economically active business population are limited liability companies (LLCs) and just 2% are public limited companies (PLCs). The remaining 8% present other legal structures (cooperatives, community of goods/property, partnerships, etc.).
Exhibit 2 provides a combined analysis of the business population’s age and workforce figures, showing how the larger companies tend to have been in business for longer. In the case of natural persons and enterprises with no employees, the majority have been in business for less than four years; for companies with between one and nine employees, the most populous segment is that of companies aged between four and 11 years; for companies with 10 or more employees, the most populous is that aged over 20 years.
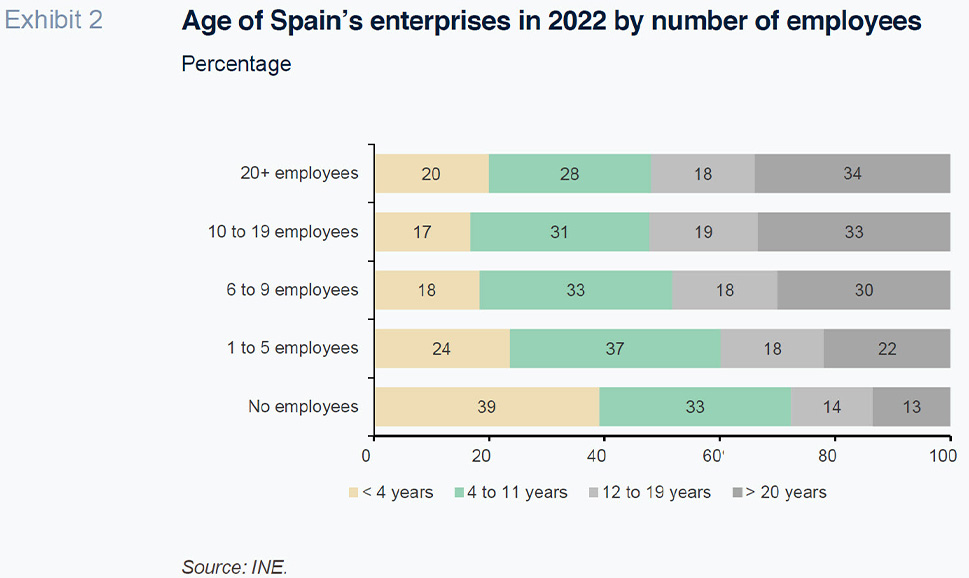
These figures suggest that most companies pursue organic growth, and that business churn is concentrated among the smaller-sized enterprises, measured by number of employees. Both traits are common to most economies. It would be preferable to see a higher share of young businesses with medium-sized workforces (from 6 to 9 employees and from 10 to 19 employees) as this would indicate that business dynamism is spreading throughout the population appropriately.
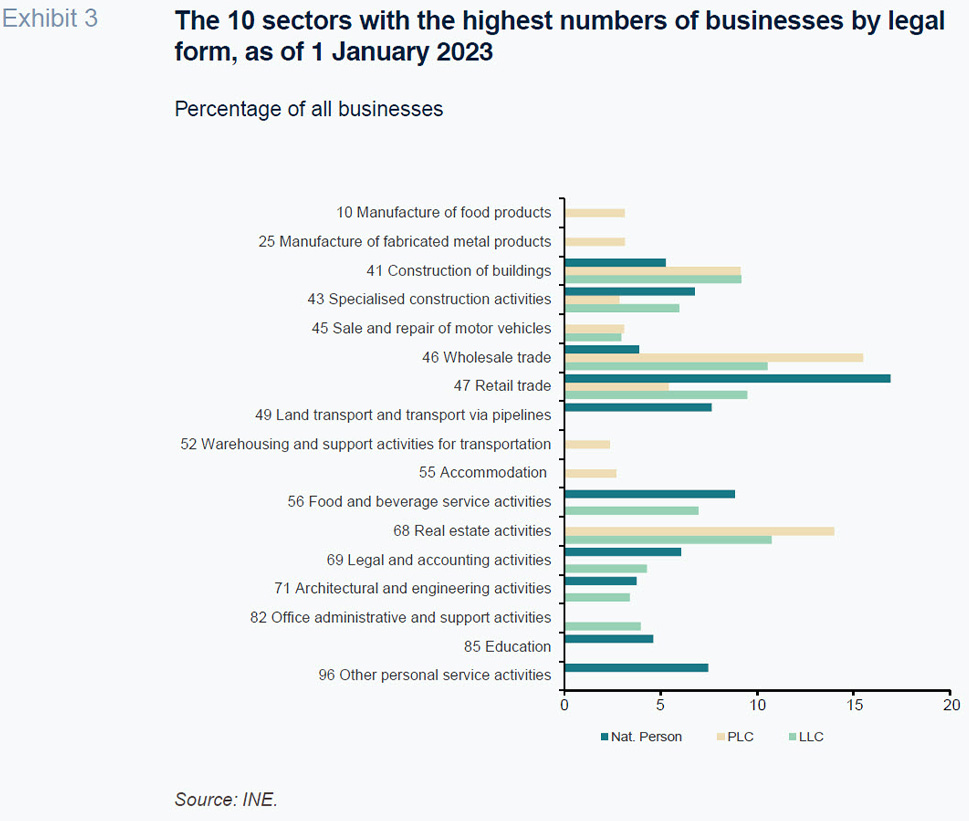
To get a better picture of the breakdown of the business population by core business as of 1 January 2023, Exhibit 3 depicts the top 10 sectors (using NACE codes) with the highest business populations for each of the three main legal forms: natural person, PLC and LLC. Given that some sectors are key for more than one form of incorporation, Exhibit 3 includes 17 sectors, ordered by their NACE code classifications.
This identification of the most important sectors allows us to then link the DIRCE figures with those of another two databases compiled by the INE which contain more recent information (up until February 2024) on the companies’ turnover.
The companies whose core business is one of the sectors itemised in Exhibit 3 encompass 71% of all natural persons, 67% of all LLCs and 61% of all PLCs. It is fair to say, therefore, that the choice of 10 core business sectors is a reasonably representative sample for each of the three main categories.
As the exhibit shows, four NACE sectors (41, 43, 46 and 47) are part of the top 10 sectors for all three forms of incorporation. These four NACE codes correspond to two areas of economic activity: construction (41, construction of buildings; and 43, specialised construction activities) and commerce (46, wholesale trade; and 47, retail trade). The sector with the highest concentration of PLCs (15.4% of the total) is the wholesale trade, while the retail trade presents the highest concentration of natural persons (16.9% of the total). In the case of the LLCs, which are spread more evenly across sectors, these sectors are also important, but the sector with the largest number of firms is real estate activities (NACE 68, with 10.7% of the total).
Among the other sectors of the economy, it is worth mentioning those that represent more than 5% of the businesses in their corresponding category: food and beverage service activities (NACE 56) for both LLCs (6.9%) and natural persons (8.8%); and other personal service activities (7.4%) and legal and accounting activities (6%) in the case of natural persons (NACE codes 96 and 69, respectively).
This analysis reveals that, by comparison with earlier studies (Fariñas and Huergo, 2015; García Perea, 2022; Xifré, 2016, 2021, 2022), the sectors of the economy that account for the largest number of companies have been stable in recent years despite the string of global crises that have affected the Spanish economy. Spain’s economically active enterprises are concentrated in labour-intensive sectors such as retailing, food services, construction and real estate activities, sectors that are very entrenched in the Spanish economy.
Turnover
Having identified the sectors that are home to the highest numbers of enterprises, we turned to two other INE databases which track the companies’ turnover and provide figures up until February 2024: the services sector activity indicator and the industry turnover index. In both cases, we used the series adjusted for seasonality and calendar effects. These databases build a monthly turnover index (in nominal terms).
For the sectors identified in Exhibit 3, Exhibit 4 presents the change in the average for the index between two time periods: (i) the 12 months of the year, between 2022 and 2023; and (ii) in January and February, between 2023 and 2024. For four of the sectors identified in Exhibit 3, the databases in question do not provide turnover data (NACE codes 41, 43, 85 and 96), making it impossible to calculate these percentage changes. As a result, Exhibit 4 provides the changes for the remaining 13 sectors, ordered from biggest to smallest changes between 2022 and 2023.
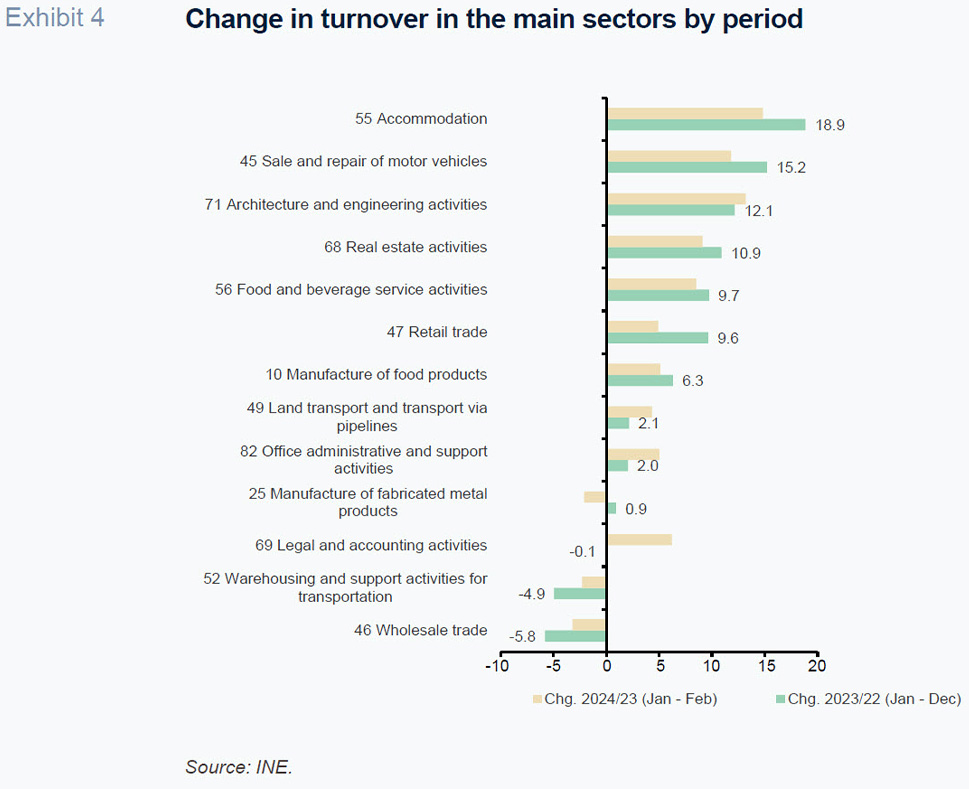
Nine of the 13 sectors reported year-on-year revenue growth in 2023 and in the first two months of 2024. Notably, accommodation, the sale and repair of motor vehicles, architectural and engineering activities and real estate activities reported growth of over 10% between 2022 and 2023. In two sectors – warehousing and the wholesale trade – turnover shrank in both 2023 and the first two months of 2024. In another two sectors – the manufacture of fabricated metal products and legal and accounting activities – the trend was contrasting in the two reporting periods.
As for the most populous sectors identified in Exhibit 3, Exhibit 4 sends a mixed message: whereas turnover in retail trade increased by 10% in 2023, in wholesale trade it contracted by close to 6%. Unfortunately, as already noted, we do not have the turnover data for the other two most populous sectors identified in Exhibit 3 (construction of buildings and specialised construction activities).
One interesting takeaway from this analysis is the dynamism in business turnover in high value-added sectors such as architectural and engineering services and the healthy growth in turnover in one of the pillars of Spain’s economy (particularly as it relates to its export performance) – the food industry.
Entrepreneurial dynamism in Spain: the latest data
For a fuller picture of the business community in Spain, we need to explore the entrepreneurial ecosystem. The recently published Entrepreneurship Map 2023 (South Summit, IE University 2023) provides insight into the profile of entrepreneurs in Spain. That report analysed close to 3,000 European startups, of which 20% were Spanish. According to the results, in Spain 80% of entrepreneurs are male and just 20%, female, a very similar split to that observed across the EU, indicating a very significant gender gap in both geographies. This gap is similarly on display in the composition of startup founder teams in Spain: 33% of the founder teams are mixed, 59% are male only and 8% are female only.
Most of the entrepreneurs come from previous salaried employment in the private sector (49%), followed by those who founded a startup (23%), those who previously worked for themselves (13%), those who worked for a startup (8%) and, lastly, those that were students right up until they became entrepreneurs (7%).
As for their first source of funding, the study distinguishes between new entrepreneurs and repeat entrepreneurs (those who have participated in the creation of at least two startups), although the differences between the two groups are not very significant. The first source of financing is equity (46% of the time in the case of repeat entrepreneurs and 41% in the case of new entrepreneurs), followed by family and friends funding (FFF) (15% and 19%, respectively) and then private equity (14% and 17%, respectively).
The sectors presenting the highest incidence of startups in Spain are: fintech, software development, education, healthcare and agrotech.
Relating this mapping to the analysis based on the INE databases, there appears to be a clear divide between the sectors that are home to a higher number of experienced firms and the sectors with a higher incidence of startups, with the sole exception of the food industry. This small overlap allows for two key takeaways: (i) the food sector is a compelling case, combining the experience and know-how of a traditional sector with the ability to attract entrepreneurs; and (ii), more generally, it could be interesting to take a closer look at the scope for creating value by fostering collaboration between these two spheres: Spain’s legacy businesses and the startup ecosystem.
Conclusions
The majority of the 3.2 million economically active enterprises in Spain as of 1 January 2023 are pursuing organic growth, in which their headcount increases in line with their number of years in business. Compared to the Eurozone and EU, it would be preferable to see younger companies with more employees.
Sector-wise, Spain’s businesses are concentrated in the wholesale and retail trade, food services, construction, and real estate activities. To accelerate convergence with the Eurozone and EU, it would be good to see more companies in the manufacturing sector and in sectors that use technology and knowledge intensely.
Lastly, judging by the information at hand, there is a significant disconnect between the sectors in which startups are concentrated in Spain and the sectors that are home to the highest numbers of businesses today, the food industry being the exception. It is likely there would be opportunities for mutual gains for both business ecosystems if they were to collaborate more closely.
References
FARIÑAS, J. C. and HUERGO, E. (2015).
Demografía empresarial en España: tendencias y regularidades [Business Demographics in Spain: Trends and Constants]. FEDEA Estudios sobre la Economía Española 2015/24.
GARCÍA PEREA, P. (2022). Análisis de la demografía empresarial en españa a comienzos de 2019 [Analysis of business demographics in Spain in early 2019].
Economic Notes – Economic Bulletin, 2/2020.
HERNÁNDEZ DE COS, P. (2024).
The main challenges facing the Spanish economy and how to tackle them. Bank of Spain Blog post.
SOUTH SUMMIT and IE UNIVERSITY. (2023). Entrepreneurship Map 2023.
TORRES, R., FERNÁNDEZ, M. J. and GÓMEZ DÍAZ, F. (2024). Outlook for the Spanish economy in 2024-2025: Navigating an uncertain international backdrop.
Spanish Economic and Financial Outlook, Vol. 13, No. 1 (January).
https://www.sefofuncas.com/Spain-and-Europe-Policy-considerations-in-2024/Outlook-for-the-Spanish-economy-in-2024-2025-Navigating-an-uncertain-international-backdropXIFRÉ, R. (2016). Spain’s business landscape: Structure, recent developments and remaining challenges.
Spanish Economic and Financial Outlook, Vol. 5, No. 3 (May).
https://www.funcas.es/wp-content/uploads/Migracion/Articulos/FUNCAS_SEFO/025art06.pdfXIFRÉ, R. (2021). Business demographics post-COVID An initial assessment.
Spanish Economic and Financial Outlook, Vol. 10, No. 3 (May).
https://www.sefofuncas.com/The-impact-of-the-pandemic-on-Spains-businesses/Spains-business-demographics-post-COVID-19-An-initial-assessmentXIFRÉ, R. (2022). The impact of the COVID-19 crisis on businesses and the self-employed.
Spanish Economic and Financial Outlook, Vol. 11, No. 3 (May).
https://www.funcas.es/wp-content/uploads/2022/05/SeFO-11_3Xifre.pdf
Ramon Xifré. ESCI-UPF, UPF Barcelona School of Management, PPSRC-IESE Business School