
Cost efficiency in the Spanish banking sector in the face of margin pressures: Contrast between SIs and LSIs
The sharp rise in interest rates since 2021 has driven up operating expenses for Spanish banks, making cost efficiency a key priority in the current context of slowing margin growth. A comparison between significant institutions (SIs) and less significant institutions (LSIs) highlights differences in cost structures, expense growth, and efficiency gains, with LSIs seeing more intense expense increases but also stronger improvements in efficiency.
Abstract: Despite driving considerable improvement in margins over the last three years, the rapid increase in interest rates since 2021 has also contributed to rising operating expenses across the Spanish banking sector, prompting banks to prioritize cost efficiency. With little additional upside for margins, the banks now need to focus hard on streamlining their operating expenses. Within this context, an examination of the trends in operating expenses over the past three years based on the financial statements of both significant institutions (SIs) and less significant institutions (LSIs) shows that while LSIs have faced more pronounced cost growth–especially in staff expenses–their efficiency metrics have improved more than those of SIs, reflecting a combination of business expansion, technology investments, and shifts in their cost structures. Despite these gains, both types of institutions now face the challenge of sustaining efficiency in a period of slowing income growth, requiring a focus on productivity, digitalization, and alternative revenue streams.
Operating expenses: Differing patterns between SIs and LSIs
After almost a decade of very contained operating expenses across the Spanish banking system, the onset of steep inflation from late 2021 (related with global supply chain friction in the wake of the pandemic), especially in 2022 and 2023 (higher energy and commodity costs against the backdrop of the war between Russia and Ukraine), has had a sizeable impact on the sector’s cost dynamics and structures. Now that there is little room for margins to contribute further to profitability, the banks need to look at managing and rationalising these costs.
Despite the fact that inflation is clearly converging towards the ECB’s target rates, the price growth of recent years has clearly affected the sector’s operating expenses. Specifically, judging by the figures published by the Bank of Spain, the sector has accumulated growth in this line item of over 8% since 2021, with staff costs up nearly 10% over the same timeframe.
Beyond the aggregate sector trend, it is interesting to analyse whether the different categories of banks have had clearly different experiences in this regard. To do that we undertook a more granular comparison, analysing the trend in expenses at the significant institutions (SIs) compared to a representative sample of less significant institutions (LSIs) with equivalent business models in Spain, using the entities’ financial statements, also published by the Bank of Spain. [1]
Exhibit 1a reveals that the growth in expenses at the LSIs has been more intense (+18%) than at the SIs (around 8%), mainly driven by staff costs, which in the case of the LSIs are up by over 20% since 2021.
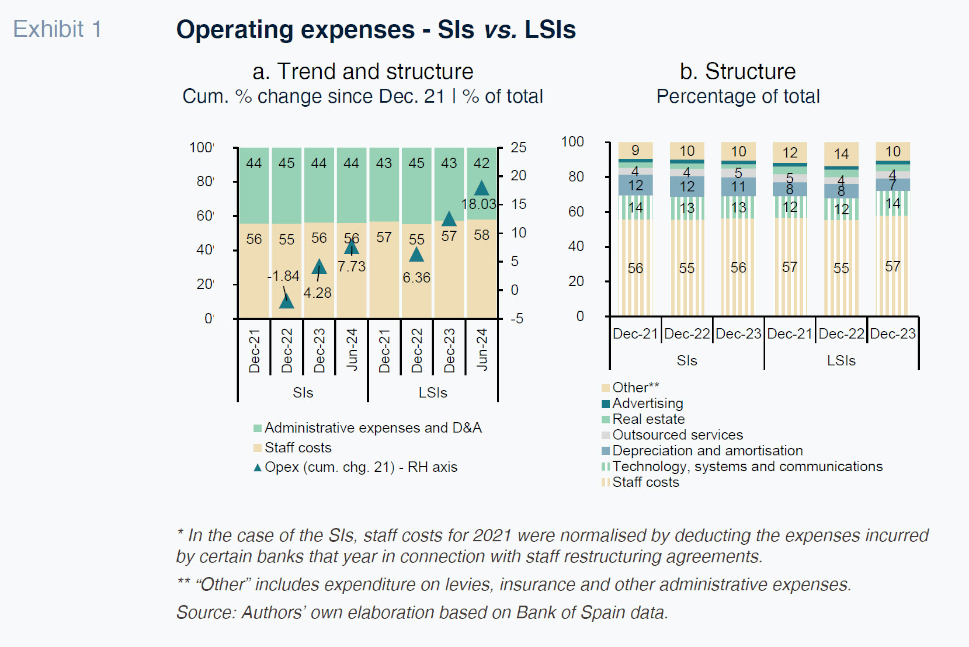
As a result, in terms of their cost structures, the higher growth in staff costs at the LSIs has translated into a degree of rebalancing, marked by a gradual shift towards a higher share of staff costs relative to other operating expenses.
Looking at the banks’ cost structures in greater detail using the information gleaned from their annual financial statements, as depicted in Exhibit 1b, we see that certain other items of expenditure have performed differently between the two groups. The weight of spending on technology, systems and communications has increased from 12% to 14% of the total at the LSIs, compared to relative stability at the SIs. This higher growth in spending on technology at the LSIs may reflect their taking advantage of the recovery in margins as rates rose to undertake investments that had been put off or downsized when rates were at or below zero and margins were clearly depressed.
This would explain the relative increase in technology spending at the LSIs in contrast to the stability observed for the SIs, entities that embarked on their transformation processes much sooner. The growth in investment in resources may also explain the relative growth in LSI staff costs, as the banks upskill and specialise in response to more stringent regulatory and supervisory demands and the expansion plans some of them are immersed in.
Expenses-to-business volume ratios: Convergence between SIs and LSIs
Despite the fact that growth in expenses has been more pronounced across the LSIs, analysing these expenses relative to business performance in both groups yields a slightly different conclusion, with both aggregates reporting similar cost-to-income ratios.
Comparing expenses to business volumes (loans, deposits and off-balance sheet items) is considered more appropriate than other metrics such as average total assets (ATAs), insofar as the volume of resources consumed by the retail banking business is significantly higher than that needed by the activities related with wholesale banking. Business volumes are therefore considered to provide a more representative vision of the relationship between expenses and the banking business.
In June 2024, the ratio of costs to business volumes was very similar for the SIs and LSIs, at 0.77% and 0.78%, respectively. The similarity in this ratio despite the different pace of growth in expenses evidences faster growth in business volumes at the LSIs during the period analysed. This relative better performance is attributable mainly to relatively higher growth in deposits at the smaller-sized banks, in line with their greater presence in territories generally characterised by a higher propensity to save rather than invest.
Cost efficiency: Clear improvement, more intense at the LSIs than at the SIs
Beyond the evolution of expenses in the last three years, it is crucial to contrast this with the performance of income in the context of rising rates and to analyse the implications in terms of sector efficiency.
Considering the main metrics used to assess cost efficiency, a widespread improvement in ordinary efficiency is observed. This metric relates the expense structure to the banks’ full capacity to generate income as it includes in its denominator the gross margin – net interest income, net fee and commission income, net trading income other operating income. [2] By the same token, improvements are also seen in the recurring efficiency ratios, which relate expenses to the institutions’ ability to generate recurring income, i.e., net interest income and net fee and commission income only.
Although both cost-efficiency indicators have trended in the same direction at both groups, Exhibit 2a and 2b reveal notable differences between the SIs and the LSIs. In terms of ordinary efficiency, the SIs are more efficient (33% versus 35% for the LSIs as of June 2024), reflecting the higher income diversification at the larger-sized entities (SIs) beyond the traditional intermediation and commission and fee-generating businesses. That income diversification is particularly notable at some entities where dividends from subsidiaries located in other geographies and income from complementary business lines like insurance make a considerable contribution to their gross margins.
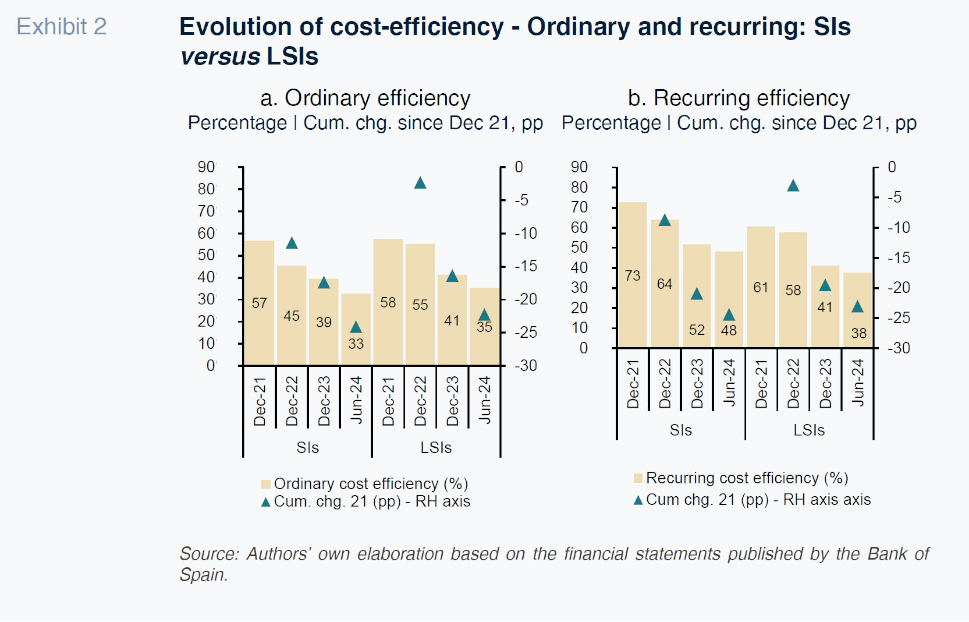
In contrast, in recurring cost-efficiency terms, the LSIs are 10 percentage points more efficient (38% versus 48% for SIs), evidencing a tighter cost structure relative to their recurring sources of income.
For a better understanding of the recent evolution in recurring cost efficiency, it is important to break down its main explanatory factors to identify which have driven the improvement and which have acted as constraints for each group of institutions.
This disaggregation of recurring cost efficiency reveals that unit profitability in the retail business has been the main driver of the improvement in this metric. At both the SIs and LSIs, profitability in retail banking (ratio between net interest income plus net fee and commission income over retail business volumes) has improved over the period analysed. However, as shown in Exhibit 3, this improvement has been more pronounced at the LSIs, where profitability has improved by nearly 90 basis points since 2021, reaching 2.06% by June 2024, compared to a 56 basis points improvement at the SIs, which stood at 1.60% during the same period. This more pronounced improvement in profitability in the retail business reflects the competitive advantage demonstrated by certain LSIs, as highlighted in a Aberni et al. (2025), thanks to their positioning in more rural areas, which has allowed them to better pass on the increase in rates to their average retail funding costs.
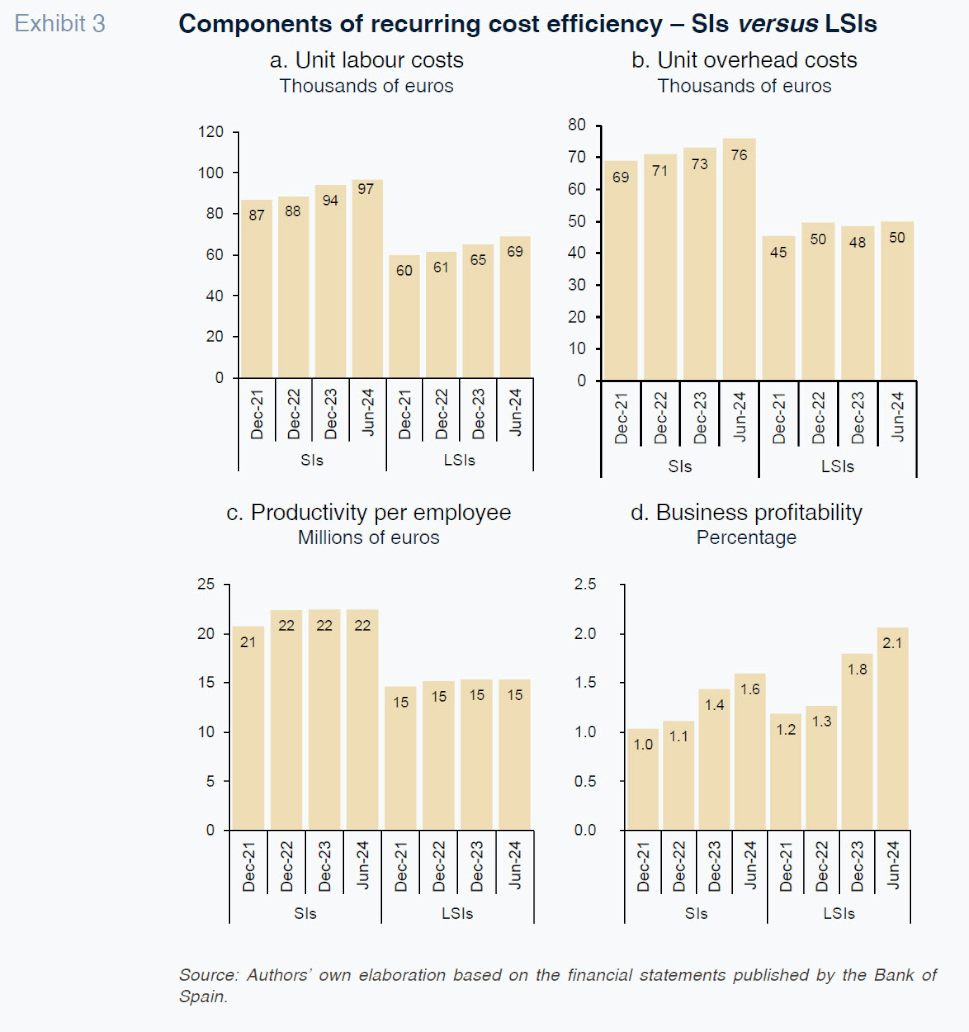
In contrast, the other factors that contribute to cost efficiency beyond profitability have either limited their improvement or had a nearly neutral effect. That is case, for example, of unit overhead costs
[3] and unit labour costs,
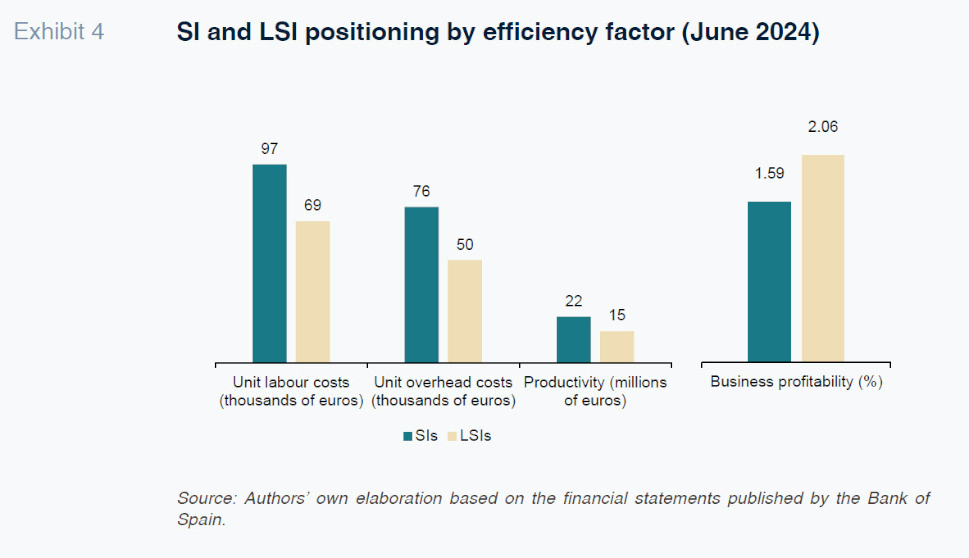
[4] which have shown an upward trend in both groups of institutions (Exhibit 3). At the SIs, these costs stood at 76 thousand euros per employee and 97 thousand euros per employee in June 2024, respectively. In contrast, the LSIs present lower readings of 50 thousand euros and 69 thousand euros per employee, respectively.
However, analysing the trend in these costs in terms of cumulative and year-on-year changes, we do observe some differences. Whereas unit labour costs have experienced sustained growth in both groups, the cumulative growth since 2021 has been more pronounced at the LSIs (+15.35%) than at the SIs (11.43%). This different pattern has continued in the first half of 2024, with growth in this metric accelerating at the LSIs (6.13% YoY vs. 2.83% YoY in June). Meanwhile, unit overhead costs have been more volatile at the LSIs, compared to a more stable growth trajectory at the SIs.
Elsewhere, as shown in Exhibit 4, productivity (business volume per employee) has been a more neutral factor, proving stable in both groups. Nevertheless, there is still a considerable productivity gap between the SIs and LSIs: 22 million euros versus 15 million euros, respectively.
Looking at the behaviour of the various factors explaining cost efficiency, it is clear that unit profitability in the retail business, and particularly the net interest margin between loans and deposits, has been the key driver behind the improvement in banking efficiency, more than offsetting the growth in operating expenses. However, the slowdown in growth in the net interest income over the course of 2024 has become increasingly evident, marked by quarter-on-quarter contractions evocative of the shift in monetary policy: in the third quarter of 2023, the Spanish banking sector reported year-on-year growth in net interest income of over 60%, which eased to 15% in the third quarter of 2024. It is likely that this trend will continue in the last quarter of 2024 and beyond, judging by the year-end figures already released by some of the banks.
Conclusions
In the current context of margin slack, the banks’ ability to maintain their cost efficiency will depend to a greater extent on other factors. In this respect, the SIs and LSIs have unique levers for tackling the looming scenario of declining margin contributions.
In the case of the SIs, the contribution by other non-retail income sources is highly relevant: international operations, dividends from investees, asset management fees and the insurance business. While it is true that these income sources are less recurrent than those directly linked to retail banking – hence the difference between the ordinary and recurring cost-efficiency metrics – their inherent diversification provides a reasonable degree of stability.
On the other hand, for LSIs, whose sources of income are less diversified, sensitivity to retail net interest income is higher. However, their income is reasonably shielded by the granular distribution of their customer base, which in turn impacts their productivity per employee, currently low.
Indeed, the key lever for offsetting the lower contribution of unit margins lies in the potential for productivity gains, aided by digitalisation and the significant investments made in technology. In any case, the contribution by unit margins should remain relatively high as long as interest rates remain sufficiently far from zero, where they hovered for nearly a decade, negating any positive contribution from deposits to margins.
Notes
In building the aggregates, we considered the separate financial statements of entities with a meaningful presence in other geographies in an attempt to isolate the impact of the even higher inflation rates to which they were exposed in those countries.
Generated from non-banking products: dividends, exchange differences and other operating income.
Unit overhead costs are defined as the ratio between administrative costs divided by the headcount (employees as of June, assuming stability, on account of a lack of information for some of the banks analysed).
Unit labour costs are defined as the ratio between staff costs divided by the headcount (employees as of June, assuming stability, on account of a lack of information for some of the banks analysed).
References
Marta Alberni, Ángel Berges and Lucía Ibáñez. Afi