
Spain’s trade competitiveness relative to the eurozone
Spanish exports registered nominal growth of 40% between 2012 and 2021, the highest rate among the euro area’s five largest economies. While the Spanish economy is capable of improving its internal cost competitiveness and transforming those gains into export growth, Spain’s export intensity remains below its weight as an economy within the universe of benchmark economies.
Abstract: Spanish exports registered nominal growth of 40% between 2012 and 2021, the highest rate among the five benchmark economies. The data corresponding to the first three quarters of 2022 suggest that momentum has continued, with Spain ranking as the country with the second-highest export growth compared to the same period of 2019. Analysis of the cost-competitiveness data suggest that the Spanish export sector has been competitive on the cost side, both before and since the pandemic-induced crisis. Thus, the Spanish economy is capable of improving its internal cost competitiveness and transforming those gains into export growth. In addition to this, it is likely that some Spanish firms are positively affected by the current reorganization of globalization, leaning towards shorter and safer supply chains. Nevertheless, Spain’s export intensity remains below its weight as an economy within the universe of benchmark economies.
Introduction
The recent surge in inflation could become a threat to the competitiveness of Spanish trade, which, to date, has demonstrated resilience, proving a source of growth for the economy as a whole. This paper performs a combined analysis of Spanish goods exports and cost-competitiveness terms in recent times. To do that, we look at the underlying trends from 2012 to 2019, the post-pandemic recovery between 2019 and 2021 and, lastly, the most recent data, which span the first nine months of 2022. The aim is to explore whether there are signs that the prevailing inflationary dynamics could be undermining the competitiveness of Spanish exports. The analysis encompasses the euro area’s five largest economies: Germany, France, Italy, Spain and the Netherlands (EA5).
The paper leverages the work contained in recent studies looking at the Spanish economy and its foreign sector (Álvarez-López, 2022; Díez Guijarro, 2022; Torres and Fernández, 2022a, 2002b) and complements previous studies specifically analysing the Spanish economy’s competitiveness (Xifré, 2014; Xifré, 2017; Xifré, 2020; Xifré, 2021).
Exports and competitiveness between 2012 and 2021
Exhibit 1 shows the volume of goods exported by the EA5 to the rest of the world between 2012 and 2021 in current prices, relative to their value in 2012 (rebased: 2012 = 100).
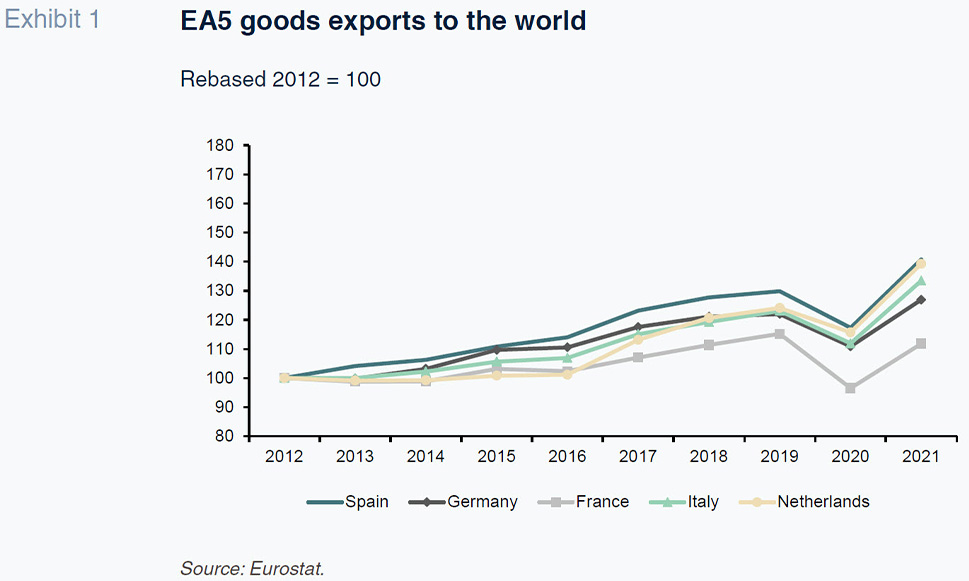
During the 10 years analysed, Spain and the Netherlands registered the highest growth in exports, reporting almost identical growth rates in nominal terms (Spain: 41%; Netherlands: 39%). The next most dynamic exporters were Italy (33%) and Germany (27%), with France lagging considerably behind (12%).
Although the COVID-19 crisis triggered a contraction in exports across all five economies in 2020, the speed of post-pandemic recovery has varied.
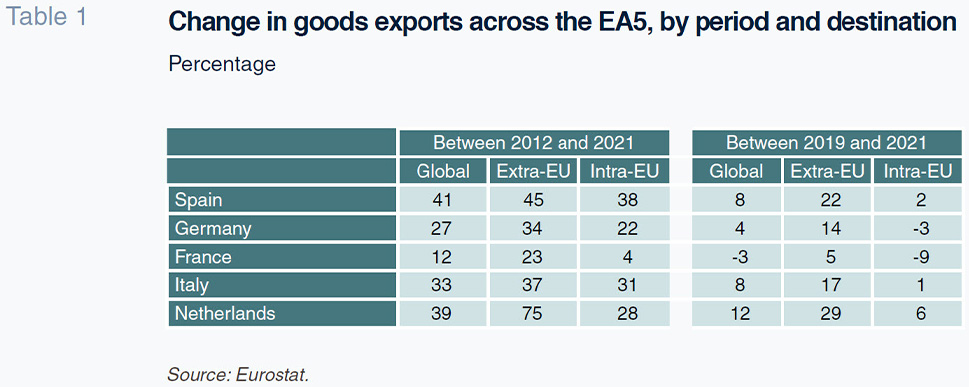
In four of the EA5, 2021 exports were already above 2019 levels by the following margins: Netherlands, 12%; Italy and Spain, 8%; and Germany, 4%. Once again, France was the outlier. In 2021, French exports were still 3% below those of 2019 (Exhibit 1 and Table 1).
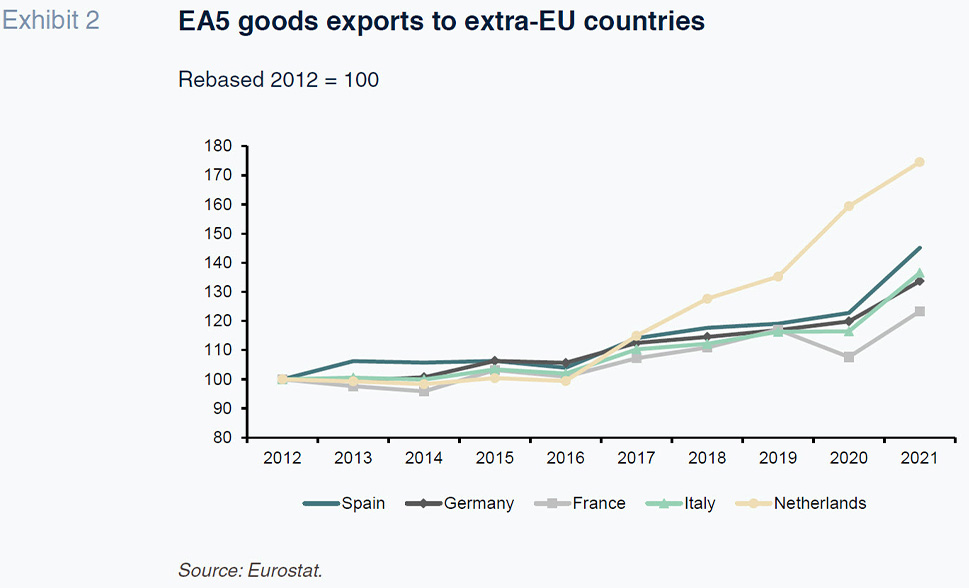
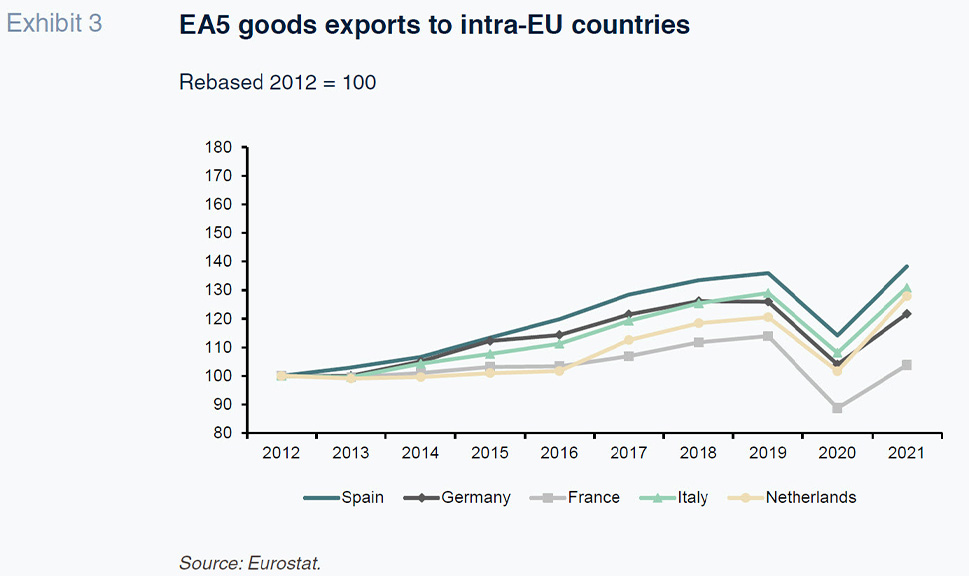
It is interesting to analyse the difference in export growth dynamics between intra-EU and extra-UE markets. To that end, Exhibits 2 and 3 are analogous to Exhibit 1, showing goods exports across the EA5 in constant prices between 2012 and 2021 (rebased to 2012) for extra-EU and intra-EU markets, respectively.
The highest growth rate recorded in either exhibit is that in exports from the Netherlands to extra-EU markets, which increased by 75% over the decade. Spain registered the second-highest level of growth in exports to those markets (45%) (Exhibit 2 and Table 1).
Within the EU, the EA5 economies registered broadly similar export growth, other than France, once again the laggard. Spain registered the highest export growth to those markets between 2012 and 2021 (38%). It is noteworthy that in the wake of the pandemic, EA5 exports to extra-EU markets rebounded faster than those to intra-EU markets. Both Germany and France exported less to the EU in 2021 than in 2019, Spain and Italy exported very similar levels both years and Dutch exports increased by 6% in 2021 (Exhibit 3 and Table 1).
Next, we look at the trend in EA5 competitiveness between 2012 and 2021. To do so, as in earlier analyses (Xifré, 2017; Xifré, 2021), we rely on the price and cost competitiveness indicators tracked by Eurostat.
In that conceptual framework, the main indicator of an economy’s competitiveness is its real effective exchange rate (REER), which is a generalisation of the nominal exchange rate. A country’s REER is defined as the weighted average of the nominal exchange rates of that country’s main trading partners, deflated by selected relative price or cost deflators. As a result, the REER is a proxy for the relative effective price of a country’s exports in terms of the exports of its most important international competitors. Due to the manner in which it is calculated, an increase in a country’s REER denotes a loss of competitiveness: it means its goods have become more expensive relative to those of its trading partners. For our purposes, we take all euro area countries as our reference group.
There are different versions of the REER depending on the deflator used to compare the exchange rates. The European Commission calculates REERs using four alternative deflators: (1) the (harmonised) consumer price index (CPI); (2) the GDP deflator; (3) the export price deflator; and, (4) the unit labour cost deflator for the economy as a whole. The first only considers consumer goods and services and does not factor in the prices of intermediate goods or capital. The second includes all goods and services produced but is not fully comparable across countries due to the different measurement (and weight) of the various service activities. The logic underpinning the third is similar but it only covers goods exports. The last deflator factors in the differences between countries in productivity and labour remuneration but does not consider other production costs, such as the cost of intermediate goods or business margins. For further details, refer to Xifré (2017).
Exhibit 4 provides Spain’s REER relative to the rest of the euro area countries for all four deflators between 2012 and 2021, rebasing the values to 2012 (2012 = 100). It shows how the Spanish economy’s cost-competitiveness indicators have increased moderately over the 10 years analysed using the GDP deflator (growth of 6% relative to the euro area average) but have increased by a scant 2% in terms of CPI and export prices. The deflator showing the biggest loss of competitiveness, albeit still contained, is the unit labour cost measure, which has increased by 10% more than in the euro area.
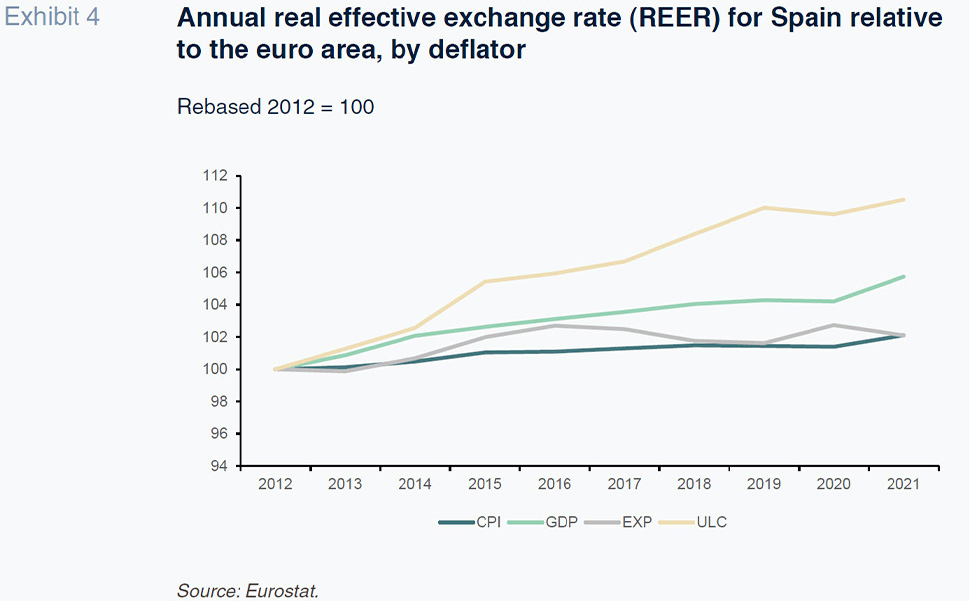
Analysis of the data suggests that the Spanish export sector has proven highly competitive on the cost side, potentially absorbing some of the growth in unit labour costs, not passing them through (or at least not in full) to export prices. That cautious approach by Spanish exporters vis-à-vis their customers and international markets may help explain the export boom documented above.
Exports and competitiveness in the first three quarters of 2022
Exhibit 5 shows the monthly change in EA5 goods exports to the rest of the world between 2019 and the same months of 2022. Rather than calculating the change year-on-year as usual we go back three years to analyse the extent to which exports had revisited pre-pandemic levels by 2022.
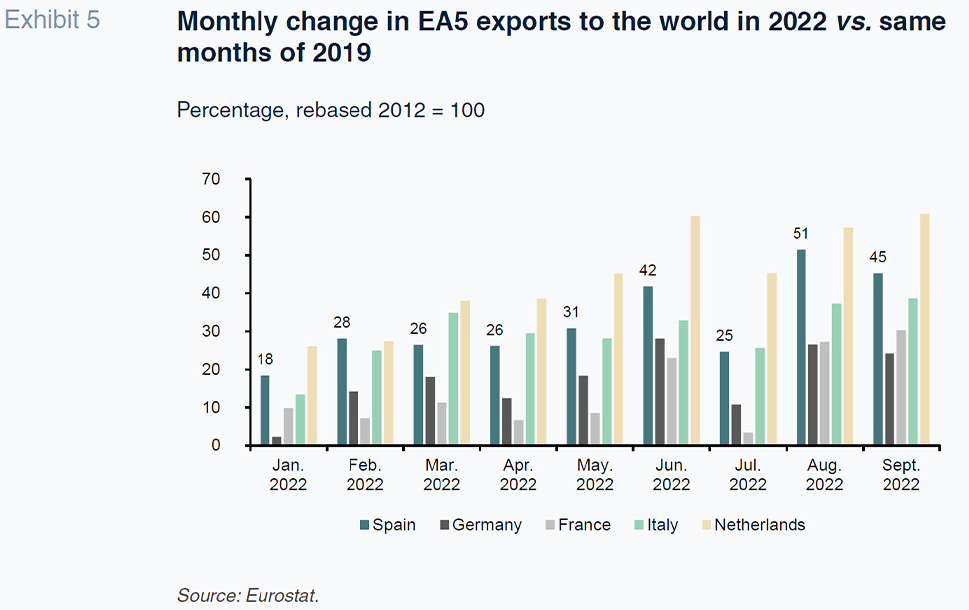
The exhibit shows how in each of the first nine months of 2022, the EA5 economies exported more than in the same month of 2019. Extending the trends first observed above, exports registered the sharpest growth in the Netherlands and Spain during that period.
Another point of interest is the acceleration in export growth as the year unfolded. In Spain, for example, exports in January 2022 were 18% above January 2019 levels, a figure that had risen to 45% by September. One possible explanation for that acceleration may be the fact that resolution of the bottlenecks (Álvarez-López, 2022; Torres and Fernández, 2022) generated by the COVID-19 crisis requires an extensive period of time.
Exhibit 6 focuses on the growth in Spanish exports between 2019 and 2022, distinguishing between global, extra-EU and intra-EU exports. In five of the nine months analysed (January, February, April, May and July), Spanish exports to non-EU markets grew by twice as much as its exports to EU markets.
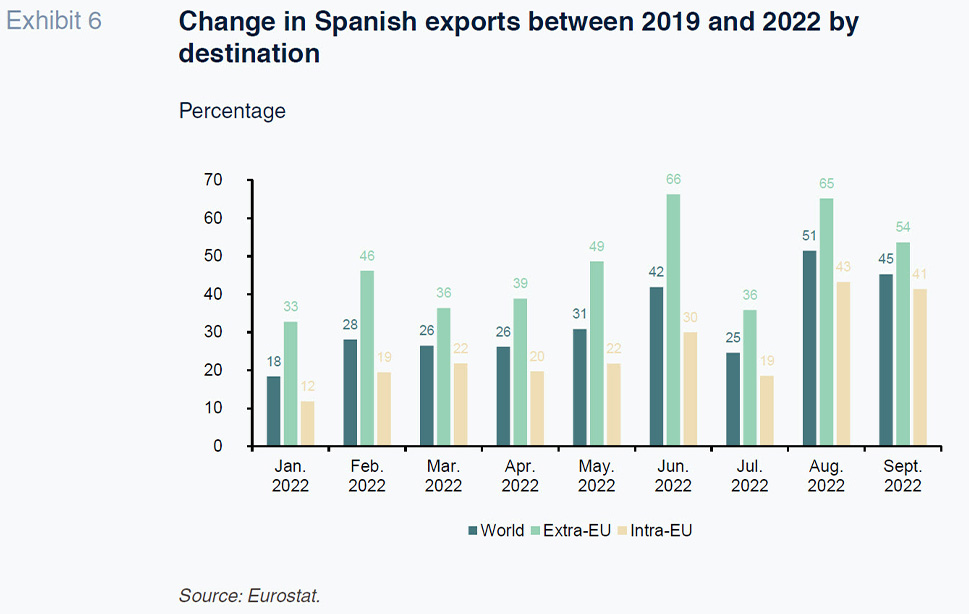
Exhibit 7 analyses the trend in monthly cost-competitiveness for the EA5 economies using the CPI deflator, which is the only one for which Eurostat provides a monthly breakdown. The data run to September 2022 and have been rebased to January 2019 levels.
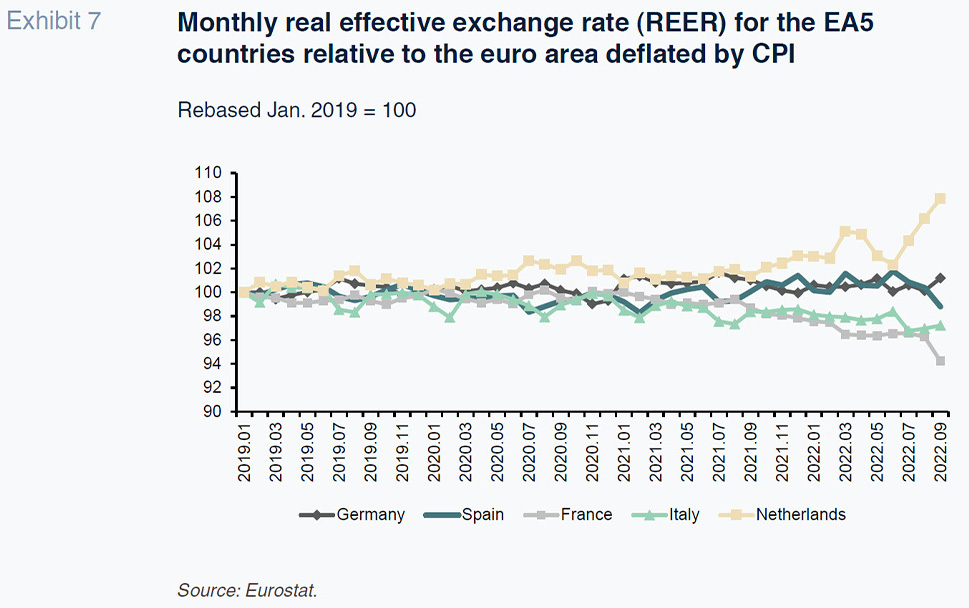
The exhibit shows how the Spanish economy has preserved its cost competitiveness, deflated by CPI and compared to the euro area, at fairly constant levels between January 2019 and September 2022, showing only negligible fluctuations relative to the rest of the EA5. That suggests, based on the data available to date, that the Spanish economy’s cost competitiveness has not eroded significantly in the first three quarters of 2022. It is fair to say, therefore, that the favourable domestic conditions that underpinned part of the documented growth in Spanish exports between 2012 and 2019 remain in place.
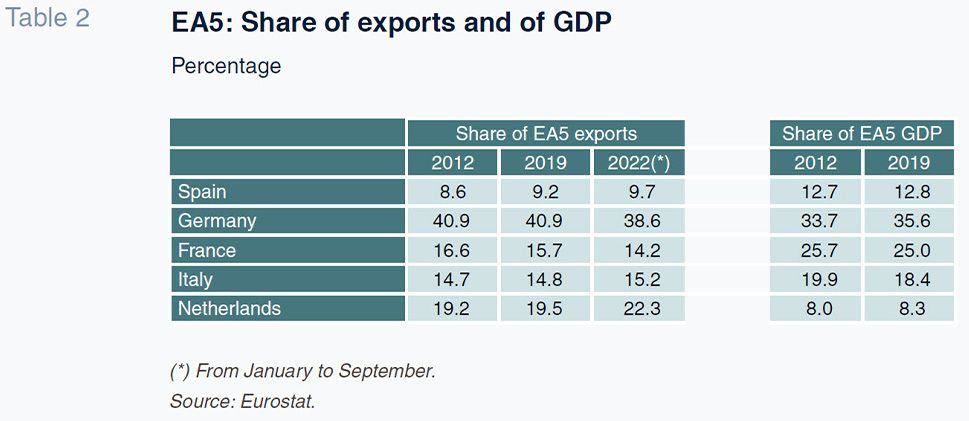
In an attempt to arrive at as impartial an assessment of the situation as possible, likewise singling out the continued upside for Spanish exports, Table 2 provides Spain’s share of goods exports within the EA5 for three different periods: 2012, 2019 and the first nine months of 2022. To provide a benchmark for comparison, the table also provides the breakdown of share of GDP by EA5 economy in 2012 and 2019. Table 2 shows how, despite the momentum in its exports in recent years, the Spanish economy’s share of EA5 exports remains below its weight of GDP, indicating considerable export growth upside.
Conclusions
Spanish goods exports registered dynamic growth between 2012 and 2021, of over 40% in nominal terms, the highest level among the euro area’s five largest economies (EA5). This paper shows that the cost competitiveness of Spanish exports has remained propitious and has probably contributed to that momentum.
Average export costs in Spain relative to the other euro area economies increased a scant 2% between 2012 and 2021. During that same period, the Spanish economy’s labour costs increased by a little over 10%. That suggests that Spain’s exporters may have (partially) contained their export prices, by not fully passing on the growth in export costs they may have incurred with the aim of gaining (or maintaining) cost-price competitiveness abroad. Note that in addition to improving cost-price competitive positioning, it is important to remain mindful of the continuous improvement in non-cost competitiveness, which has also traditionally played a significant role in underpinning growth in Spanish exports (Xifré, 2021). These non-price factors (such as quality or post-sale services of export products) may help improve the positioning of Spanish exports in the current reorganization of globalization and supply chains. The recent crises of COVID-19 and the invasion of Ukraine have tended to reshape outsourcing, prioritsing shorter and more robust supply chains and it is likely that some Spanish firms are benefitting from this move.
The most recent figures, corresponding to the first three quarters of 2022, reveal ongoing momentum in Spanish exports, marked by three observations. Firstly, Spain is the EA5 economy to have registered the second-highest monthly growth in exports in 2022 by comparison with 2019 and that growth has been accelerating. Secondly, growth in Spanish exports to markets outside of the EU (which present higher growth potential in the long-term) was twice the growth in EU markets in five of the first nine months of last year. Thirdly, despite the inflationary pressures affecting the Spanish and the rest of the world’s economies, so far there are no signs that they are significantly harming export competitiveness. Lastly, to arrive at a balanced diagnosis of the situation, it is worth recalling that Spanish exports continue to be under-represented within the EA5 block relative to GDP.
References
ÁLVAREZ-LÓPEZ, M. E. (2022). El comercio exterior español en tiempos de pandemia: del gran confinamiento al estallido de la guerra en Ucrania [Spanish trade in times of pandemic: From the great lockdown to the onset of war in Ukraine.]
Papeles de Economía Española, No. 173, pp. 60-77.
DÍEZ GUIJARRO, J. M. (2022). The return of geopolitical risk: Economic effects of the war in Ukraine.
SEFO, Spanish and International Economic and Financial Outlook, Vol. 11, No. 3.
https://www.funcas.es/articulos/the-return-of-geopolitical-risk-the-economic-effects-of-the-war-in-ukraine/ TORRES, R. and FERNÁNDEZ, M. J. (2022a). La economía española, de la pandemia a la crisis energética [The Spanish economy, from the pandemic to the energy crisis.]
Papeles de Economía Española, No. 173, pp. 2-15.
TORRES, R. and FERNÁNDEZ, M. J. (2022b). Perspectivas de la economía española tras la crisis energética [Outlook for the Spanish economy in the wake of the energy crisis]
Papeles de Economía Española, No. 291, pp. 1-9.
XIFRÉ, R. (2014). Four years of economic policy reforms in Spain: An analysis of results from an EU perspective.
SEFO, Spanish and International Economic and Financial Outlook, Vol. 3, No. 5.
https://www.funcas.es/wp-content/uploads/Migracion/Articulos/FUNCAS_SEFO/015art02.pdfXIFRÉ, R. (2017). Non-price competitiveness factors and export performance: The case of Spain in the context of the Euro area.
SEFO, Spanish and International Economic and Financial Outlook, Vol. 6, No. 3.
https://www.funcas.es/wp-content/uploads/Migracion/Articulos/
FUNCAS_SEFO/031art07.pdfXIFRÉ, R. (2020). Spanish high-tech exports.
SEFO, Spanish and International Economic and Financial Outlook, Vol. 9, No. 4.
https://www.sefofuncas.com/Challenges-for-Spanish-industry-under-COVID-19-and-beyond/Spanish-high-tech-exportsXIFRÉ, R. (2021). Non-price competitiveness factors - A simple measure and an application to the five largest euro area countries.
The World Economy, 44(11), 3091-3110.
Ramon Xifré. ESCI-Universitat Pompeu Fabra, UPF Barcelona School of Management, PPSRC – IESE Business School