
Spanish high-tech exports
Despite having registered sustained growth in recent years, Spanish exports of high-tech products as a percentage of total exports are the lowest of the four major EU economies. This indicator can be used as a proxy for the country’s strength in science and technology, suggesting a more robust policy approach may be required to generate and draw large-scale international science and high-tech investments to Spain.
Abstract: The COVID-19 crisis highlights the importance of a robust science and technology base in a country. One way of measuring this is by analysing exports of high-tech products. Looking at export intensity of high-tech products, Spain ranks 25th out of the 27 EU member states and in terms of net trade, it is the country with the highest deficit in this product category among the four major EU economies. From 2008 to 2013, high-tech imports fell by close to 30% (in a context of rising exports). However, between 2013 until 2018, this category of imports increased by 45%, pointing to certain shortcomings in the national high-tech product manufacturing sector. While it is tempting to draw a connection between investment in R&D and export intensity in high-tech products, data analysis indicates there is no linear relationship between the two variables. Unsurprisingly, Spain trades more with its EU than its non-EU partners. By sector, Spanish high-tech exports are dominated by the aerospace and chemistry industries, while electronics and telecommunications dominate on the import side. Given the importance of high-tech exports for national science and knowledge, it is crucial that Spain improves these indicators.
Introduction
The COVID-19 crisis has revealed the extent to which countries need a robust science and technology base. From the onset of the crisis, it was clear that the best-prepared countries were those that boasted a specialised, well-funded and advanced base.
Importantly, the industry of science not only serves to tackle public health crises and other emergencies, but also offers an avenue for economic development. This is due to its important knock-on effects for a host of economic activities that generate high, or very high valued-added, as well as stable and skilled employment opportunities (Poncela García, 2016; Cáceres Núñez, 2016).
This article analyses a specific aspect of the industry of science in Spain, namely high-tech product exports. These exports can be seen as a proxy for the reach and robustness of the national knowledge generation ecosystem as their existence requires an appropriate public support system as well as a private sector capable of monetising its developments on the international knowledge frontier.
Export intensity of high-tech products
Our analysis relies on the Eurostat statistical specifications to define the universe of high-tech products (Eurostat, 2016). Based on the SITC Rev.4 product classification, Eurostat considers nine lines of manufacturing to be high-technology products. These sectors are aerospace, computers and office machines, electronics and telecommunications, pharmacy, scientific instruments, electrical machinery, chemicals, non-electrical machinery (numerically controlled machinery), and armaments.
One of the most common ways of measuring high-tech exports is to calculate their weight in total exports of goods. Exhibit 1 provides that percentage for the 27 EU member states in 2007 and 2018. Exhibit 2 provides the trend in that same percentage for the four major EU economies (Germany, France, Italy and Spain) between 2007 and 2018.
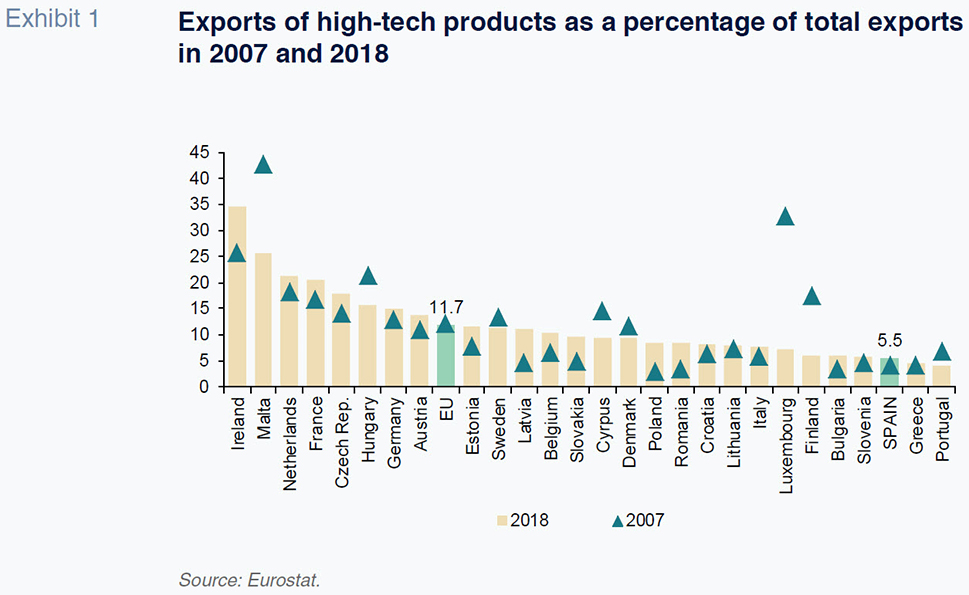
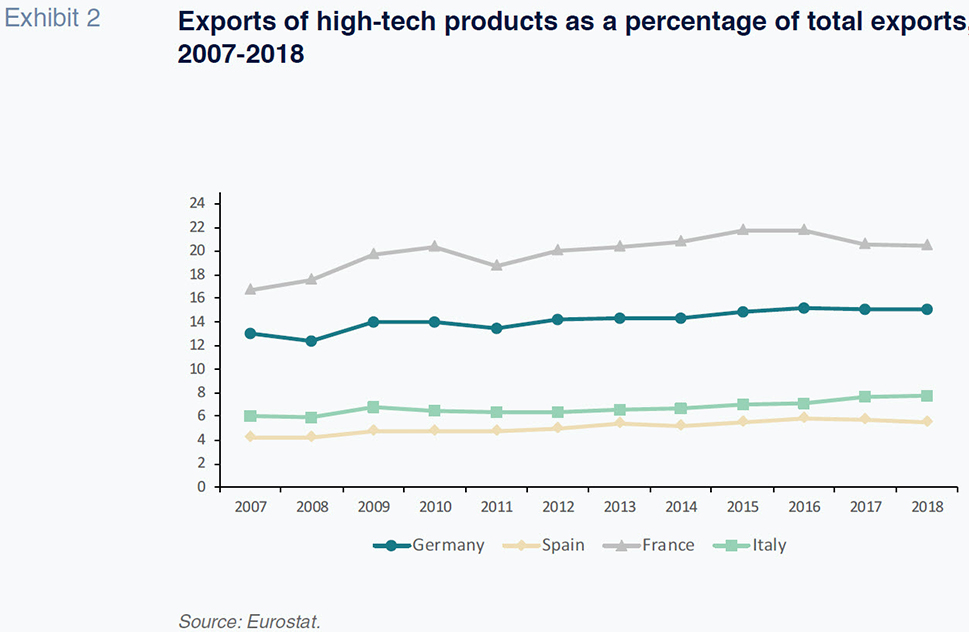
Exhibit 1 shows that in 2018, high-tech product export intensity in Spain (5.5%) was less than half of the EU average (11.7%), ranking 25th out of the 27 EU member states.
Exhibit 2 shows how export intensity ratios are structural. The intensities presented by the four largest EU economies were relatively stable between 2007 and 2018, with a slight general upward trend. Spain ranks last among those four economies, not far behind Italy, even though export intensity in high-tech products in Spain has increased by 1.3 percentage points, from 4.2% to 5.5%, during the 11-year period. France is the clear leader, with an export intensity of close to 22% in 2015 and 2016, albeit trending slightly lower since then. Germany occupies the middle ground, exhibiting slower yet steady growth.
The analysis might suggest that export intensity in high-tech products depends significantly on another equally structural variable, investment in R&D. To examine whether that is the case, Exhibit 3 plots the export intensity of high-tech products for the 27 EU member states against their R&D investment intensity (domestic expenditure on R&D as a percentage of GDP) in 2018.
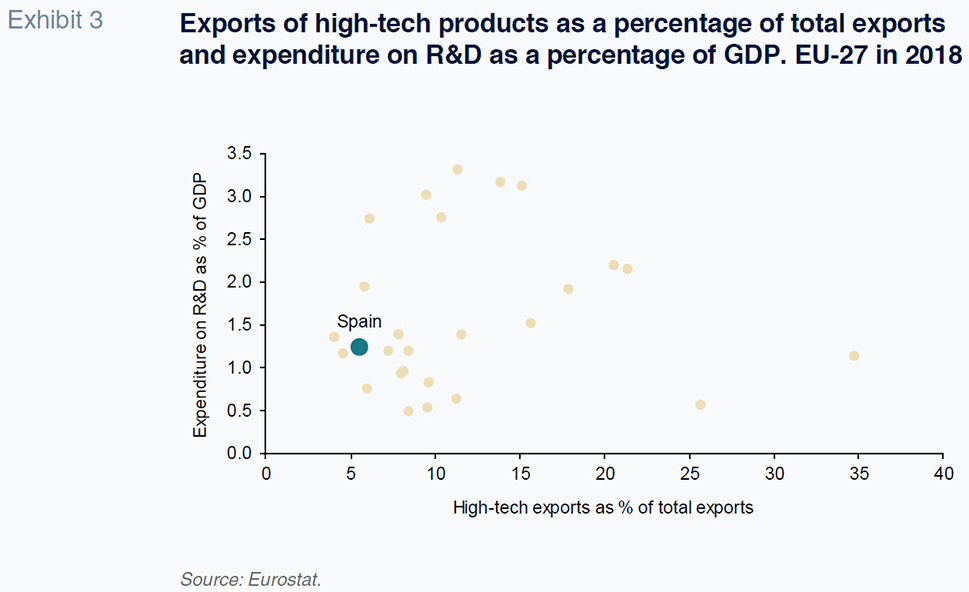
There is no linear relationship between the two variables (the correlation coefficient is an insignificant 0.004). That observation fits with other documented findings which show that the role played by high-tech exports in economic growth is more important in developing economies than in advanced economies (Crespo Cuaresma and Wörz, 2005; Falk, 2009). In fact, the key drivers of high-tech exports remain somewhat of an open issue. The body of literature on the subject suggests that a country’s ability to attract foreign investment, coupled with certain specific and ad-hoc measures such as collaboration with large-scale international scientific projects, may play a crucial role (Wilkinson and Eliot Brouthers, 2000).
Trade balance in high-tech products
Exhibit 4 takes a different perspective, depicting the net trade balance (exports less imports) for the four largest EU economies with the rest of the world (in millions of euros).
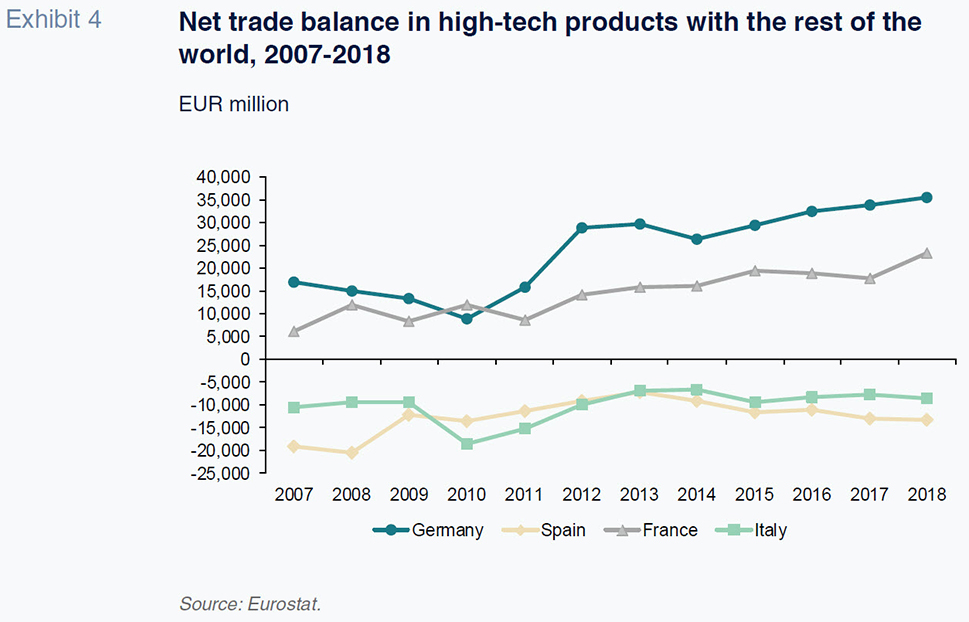
The figures show that Spain and Italy are not only the countries with the lowest export intensities in high-tech products but are also the countries that present trade deficits in this category of goods, i.e., they import more than they export. In Spain, the deficit amounted to over 13.2 billion euros in 2018, while in Italy it stood at 8.5 billion euros. The best performing country is Germany, with a trade surplus in high-tech products of over 35.5 billion euros in 2018, followed by France, with a surplus of nearly 23.4 billion euros. Regarding trends, the two groups of countries also present differences. The countries with trade surpluses have increased those surpluses significantly in recent years, while Spain, which had managed to cut its deficit by half between 2008 and 2013, has seen it widen since 2014. Italy’s deficit, on the other hand, has been relatively constant. The resulting snapshot is not only one of certain countries with trade surpluses and others with deficits but also a contrasting trend between the former (France and Germany) and the latter, particularly Spain.
Exhibit 5 breaks down the trade balance for Spain between imports and exports of high-tech products in millions of euros. The exhibit shows how exports have been trending consistently higher, doubling their value in absolute terms between 2007 and 2018 (from 7.8 to 16.1 billion euros), albeit slowing from 2016 onwards. The pattern in imports presents more ups and down and is the key driver of the fluctuations in the trade deficit.
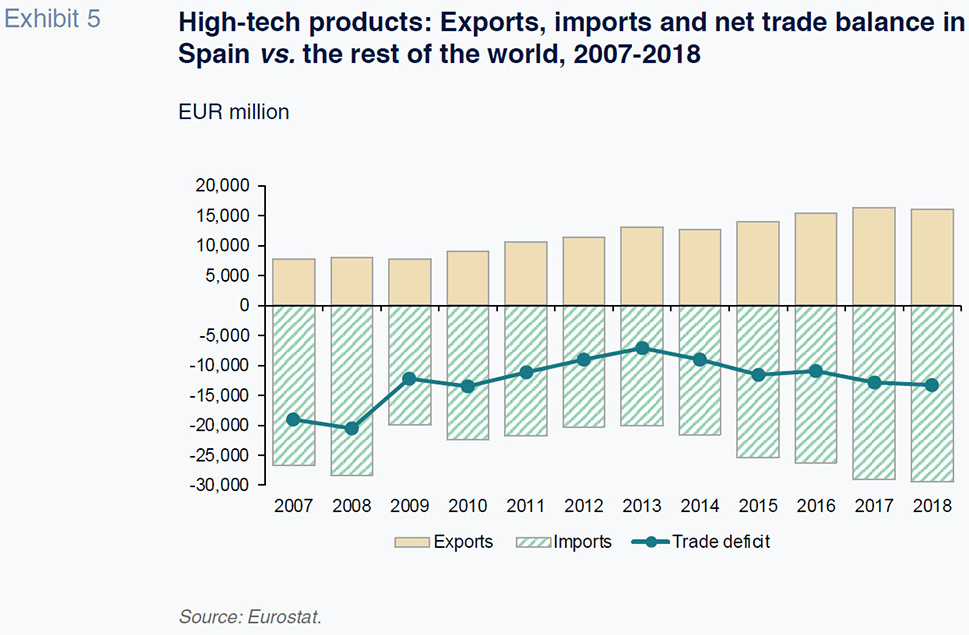
We can clearly distinguish between two phases in Spain’s imports of high-tech products. From 2008 to 2013, imports fell by close to 30% (in a context of rising exports). However, between 2013 until 2018, imports increased by 45% (from 20.2 to 29.4 billion euros), pointing to certain shortcomings in the national high-tech product manufacturing sector.
To understand the geographic patterns underlying these trade trends, Exhibit 6 breaks down the trade balances for each of the four benchmark economies distinguishing between the balance of trade with the rest of the EU (intra-EU trade) and the balance with the rest of the world (extra-EU trade).
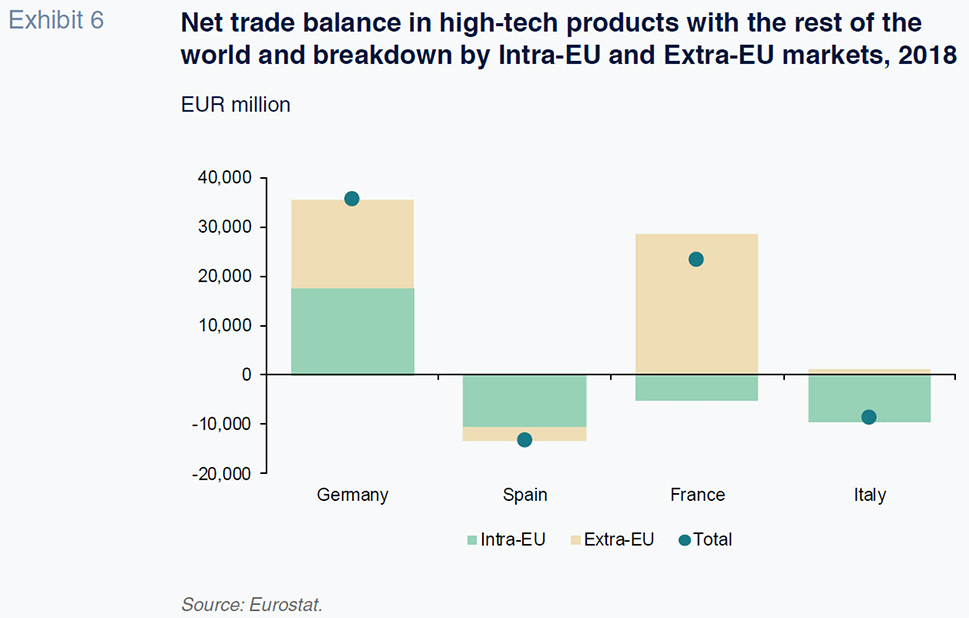
Only Germany presents a trade surplus with the rest of the EU, with the other three countries importing more high-tech products from the single market than they export. As for the extra-EU trade balance, Germany and especially France present significant surpluses. In fact, France’s trade surplus with non-EU countries is so significantly higher than its intra-EU trade deficit, that it reports an overall surplus. Italy also presents a trade surplus with non-EU trading partners albeit not large enough to offset its intra-EU deficit. Lastly, Spain is the only one of the four countries analysed to register deficits in its trade with both EU and non-EU countries.
Sector analysis
To round out the analysis, we layer in the sector dimension. Table 1 shows worldwide exports and imports of Spanish high-tech products in 2018, again distinguishing between intra-EU and extra-EU destinations.
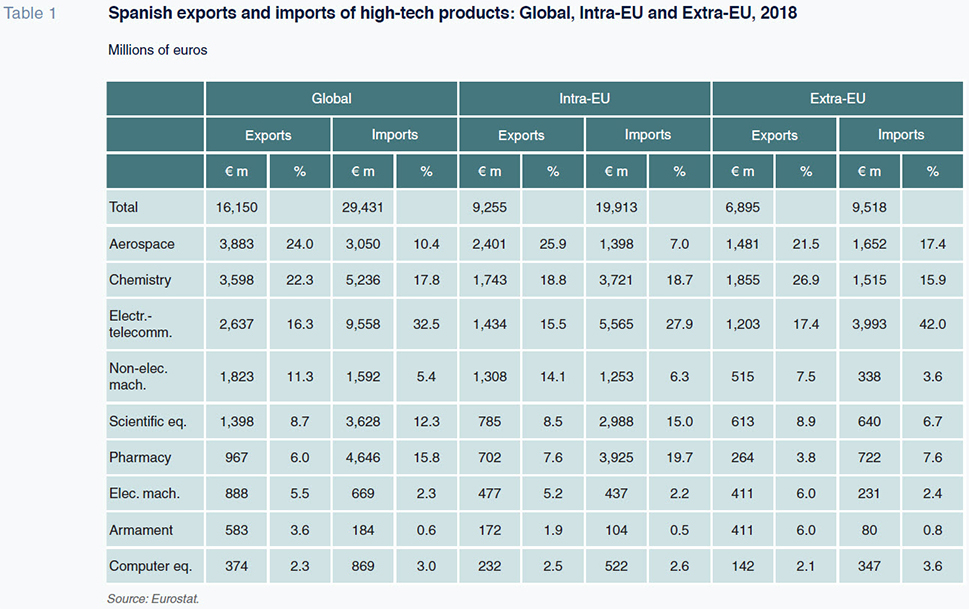
In aggregate terms, as with exports in general, Spain trades more with its EU than its non-EU partners. The concentration of trade with EU partners is higher in the case of imports (67%) than exports (58%). By sector, Spanish high-tech exports are dominated by the aerospace and chemistry industries. The former dominates in the intra-EU markets (and therefore the total tally) and the latter dominates in the extra-EU markets. On the import side, a third sector comes into play, electronics and telecommunications. Spanish imports of products from this sector account for over 40% of total imports from extra-EU markets and 28% of those from EU markets. The second spot is occupied by different sectors depending on the market of origin. In extra-EU high-tech imports, it is occupied by aerospace products, while in intra-EU imports, the second place goes to chemistry and pharmacy.
Conclusions
Spanish exports of high-tech products as a percentage of total exports are the lowest of the four major EU economies, despite having registered sustained growth in recent years. In terms of net trade in high-tech products, Spain similarly presents the highest deficit within this group of countries. That deficit narrowed between 2008 and 2013 but has widened since then, due mainly to growth in high-tech imports. 0a net trade deficit with non-EU trading partners. By sector, Spanish high-tech exports are concentrated in the aerospace, chemistry and electronics-telecommunication sectors.
Given the importance of high-tech exports for the national science and knowledge ecosystem (and the high associated social and economic impacts) it is crucial that Spain improve on these indicators. Although the precise factors that drive exports of high-tech products remain open to discussion, strategies designed to generate and draw large-scale international science and high-tech investments in a country appear to be among the most effective.
References
CÁCERES NÚÑEZ, F. J. (2016). La industria de la ciencia: Una aproximación a sus mercados [The industry of science: an approximation of its markets].
ICE: Cuadernos Económicos, January-February, No. 888, pp. 33-45.
CRESPO CUARESMA, J. and WÖRZ, J. (2005). On Export Composition and Growth.
Review of World Economics, Vol. 141, pp. 33-49.
EUROSTAT. (2016). High-tech industry and knowledge-intensive services. Reference Metadata in Euro SDMX Metadata Structure (ESMS). Retrievable from:
https://ec.europa.eu/eurostat/cache/metadata/Annexes/htec_esms_an5.pdfFALK, M. (2009). High-tech exports and economic growth in industrialized countries.
Applied Economics Letters, 16, pp. 1025–1028.
PONCELA GARCÍA, M. L. (2016). La industria de la ciencia y sus implicaciones en los otros sectores industriales [The industry of science and its implications for other industrial sectors].
ICE: Cuadernos Económicos, January-February, No. 888, pp. 47-59.
WILKINSON, T. and ELIOT BROUTHERS, L. (2000). Trade Shows, Trade Missions and State Governments: Increasing FDI and High-Tech Exports.
Journal of International Business Studies, 31, pp. 725–734.
Ramon Xifré. ESCI – UPF, UPF Barcelona School of Management, PPSRC – IESE