
EU trade agreements and goods exports: The Spanish differential
Spanish goods exports exhibit greater responsiveness to EU trade agreements than those of other member states, with the divergence becoming more pronounced over time. Where trading partners share historical or linguistic ties with Spain, export growth is driven primarily by the intensive margin; where such ties are absent, the expansion of the export basket through the addition of new products plays a comparatively more important role.
Abstract: The EU has accelerated its trade agreement agenda in recent years, yet the effects of those agreements have not been uniform across member states. Spain’s trade profile is distinctive: exports account for 37% of GDP, the country records a goods surplus with EU partners but a deficit with the rest of the world, and its trade with third countries is particularly concentrated in markets with historical or linguistic ties. This distinctiveness raises the question of whether EU trade agreements are associated with differentiated effects on Spanish goods exports, and whether they widen the basket of exported products or instead intensify existing flows. Spanish goods exports to agreement partners exhibit greater responsiveness than those of other large EU economies, with cumulative growth reaching 23.5% in Neighbouring partner markets, compared with 10.1% for Germany and 7.7% for France over the same horizon. Moreover, the deepening of existing trade flows explains most of that performance, particularly in markets where historical ties already lower entry costs. In more distant markets without such ties, Spain activates the extensive margin more intensively than its European peers, expanding its export basket through the addition of new products at a comparatively faster rate. The pipeline of agreements now entering into force—including Mercosur, the modernised agreements with Mexico and Chile, and prospective agreements with India and Indonesia—aligns closely with these patterns in ways that carry distinct implications for Spanish exporters. Realising that potential, however, will depend not only on the agreements themselves, but also on the depth of their provisions, firms’ effective utilisation of trade preferences, and the availability of institutional support at the point of market entry.
Spain’s exposure to the EU’s network of trade agreements
A first approach to understanding Spain’s trade position is to look at the trend in its current account balance over time. The period following the financial crisis marked an inflection point for Spain, giving way to a current account surplus which the country has maintained ever since (2.9% of GDP in 2025). Although services exports played a key role in turning the deficit around, goods have also played an important role, thanks to a considerably reduced deficit (Hidalgo and Steinberg, 2023). The Spanish economy’s increased export bias is reflected in the share of internal output sent abroad, which increased by eight points of GDP between 2000 and 2025.
Despite this strategic focus on exports, the Spanish economy remains reliant on trade with the rest of the European single market, where sales of Spanish goods exceed purchases by 1.5% of GDP. In contrast, Spain presents a considerable goods trade deficit with the rest of the world (4.4% of GDP).
Trade with European partners and the rest of the world are not mutually exclusive trade-offs. The single market provides scale, integration in production chains and a stable base of demand, whereas penetration of third countries creates the ability to leverage specific competitive advantages and geographically diversify the export base.
Moreover, a goods trade deficit is not in itself a negative performance indicator: it can reflect production specialisation patterns and be consistent with a balanced current account, as is the case in Spain. The important analytical question, therefore, relates to its composition and the tools that could modify it, notably including trade agreements.
Exhibit 1 provides the balance of trade in goods, excluding energy products, distinguishing between countries with and without trade agreements with the EU. The UK is excluded from the analysis because its agreement is the result of Brexit, which implies a move away from the single market to a regime with trade barriers.
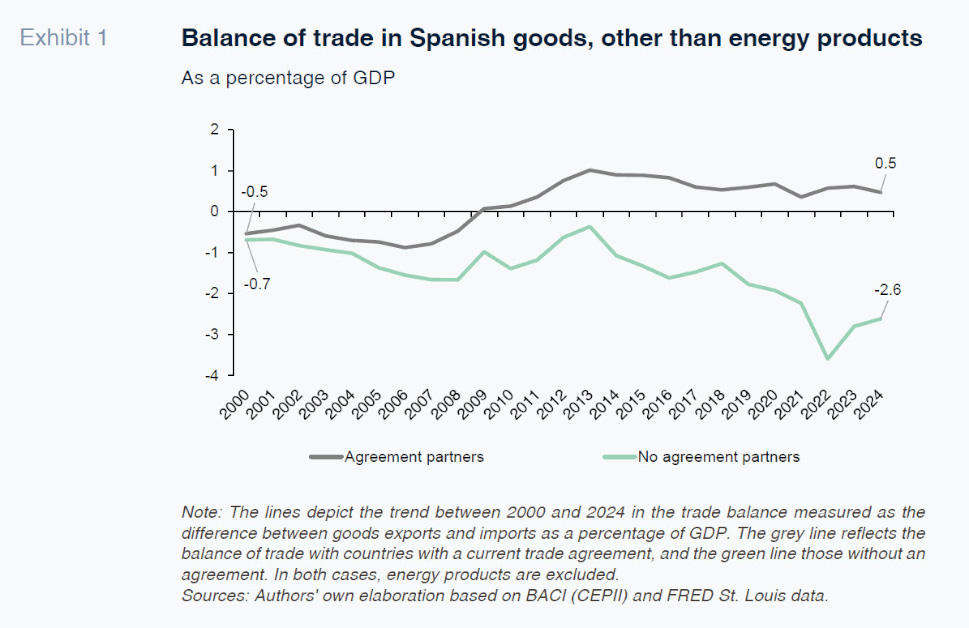
The balance of trade in goods with partners with trade agreements has been roughly balanced since 2000 and marked by a small but consistent surplus since 2009. In contrast, the balance with countries without an agreement has been deteriorating steadily, from a deficit of 0.7% of GDP in 2000 (similar to the original deficit with countries with trade agreements) to one of 2.6% in 2024, marked by a pronounced drop from 2018. China accounts for a considerable share of that deficit, but the conclusion is similar in qualitative terms even if China is excluded from the analysis. The asymmetry does not reflect an ad-hoc episode, therefore, but rather a pattern of sustained divergence across trading partners depending on whether or not they are part of the network of EU trade agreements.
Although the sign of the overall trade balance reflects that asymmetry, the analysis that follows focuses on exports. The reason is that trade agreements reduce the costs of accessing the partner market for European firms, and vice versa, although the trend in European imports is also shaped by internal demand and the composition of the counterparty’s product offering. Arjona et al. (2026) tackle the import side of this issue, documenting a shift in EU imports to partners with trade agreements in recent times.
All member states enjoy the same terms and conditions when trading with third countries; the differences in performance depend on the structure of their trade, their sector specialisation and the geographical mix of their trading partners. The EU trade agreement network encompasses over 80 countries, with 39 agreements coming into effect between 2000 and 2024. The agreements present a relatively homogeneous profile geography-wise, and they have been coming into force steadily throughout the twenty-first century.
The analysis presented in the rest of this paper focuses on the agreements taking effect between 2000 and 2024 and uses the taxonomy put forward by Arjona et al. (2026), which allows their classification as (i) geographically close partners (Neighbouring agreement partners) with whom an agreement is in place; (ii) geographically distant partners (Non-neighbouring agreement partners) with whom an agreement is in place; and (iii) trading partners, regardless of proximity, with whom there has been no agreement during the period analysed (Non-agreement partners). In this analysis, therefore, the countries belonging to the EFTA, an agreement that pre-dates 2000, belong to the Non-agreement category. As do the United States and China, with whom there is no agreement in force.
An additional dimension is included to reflect colonial ties and linguistic affinity between Spain and third countries to represent the importance of this aspect in Spain’s export activities. This criterion is applied symmetrically for Spain and the rest of the EU so as to be able to draw comparisons for the same set of markets.
The pattern of goods exports to third countries reveals considerable differences between Spain and the rest of the EU (Exhibit 2). Spanish goods exports are geographically more biased towards the trading partners with whom agreements have been struck since 2000 (41.3%) than the other member states (26.8%). Although a higher share of Spanish trade is exposed to those agreements, that higher exposure does not, by itself, translate into a bigger advantage.
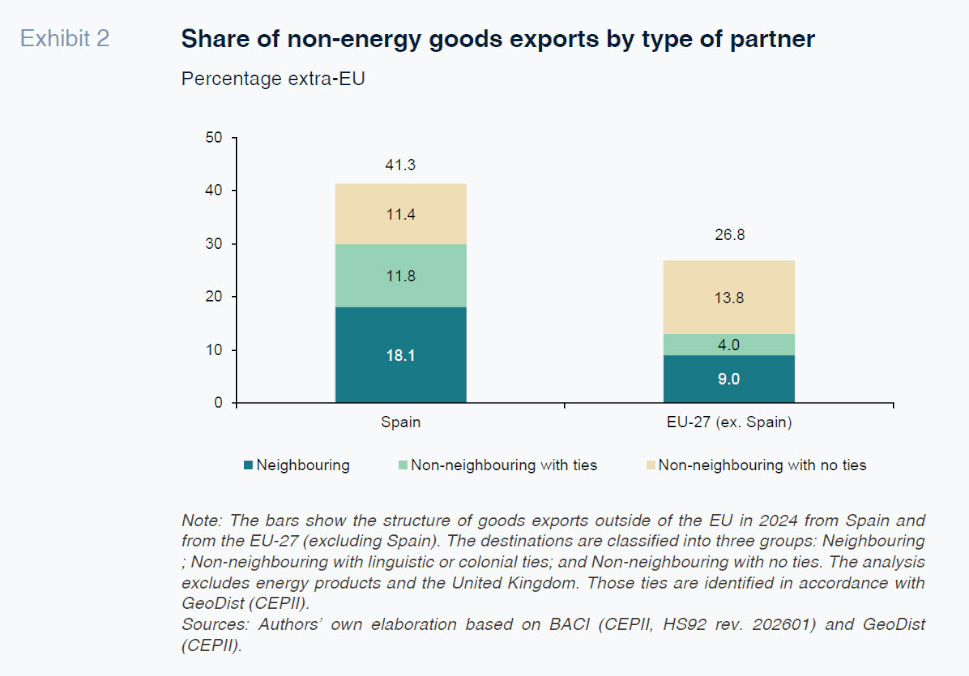
Among the agreement partners, Spanish goods exports are more exposed to the Neighbouring partners than the rest of the EU (18.1% for Spain vs. 9.0% for the EU) as well as the group of Non-neighbouring partners with language or colonial ties (11.8% vs. 4.0%), reflecting the extent of trade relations with partners with such ties, characteristics that potentially reduce the costs of accessing those markets. In contrast, exposure to more distant countries without historic or language ties to Spain is higher in the other member states (11.4% share of goods exports for Spain vs. 13.8% for the EU).
These differences shape how trade agreements can affect the exports of each member state. Their effects may differ not only in magnitude but also in composition terms. Next we examine whether Spain’s higher exposure relative to the other member states to agreement partners translates into more momentum following their entry into effect and how that materialises.
Export responsiveness to trade agreements
There is consensus in the literature that the average effect of a trade liberalisation agreement is to increase bilateral economic flows, a finding that is robust to the methodology used. Baier and Bergstrand (2007) correct for endogeneity in the choice of agreements and estimate that, on average, bilateral trade doubles in 10 years. Nagengast and Yotov (2025) examine the staggered entry into effect of the agreements and estimate an even bigger impact.
The evidence for Europe’s trade agreements is related primarily to specific case studies. Jung (2023) finds that exports increased by a cumulative 39% over five years as a result of the agreement with South Korea. Van der Vorst (2025), meanwhile, assessed the effectiveness of the agreement with Japan, concluding that it depends on the utilisation of the tariff preferences by exporters. Those documents establish quantitative references for specific agreements but do not provide an aggregate reading of the overall universe of agreements.
The contribution made by this paper is, indeed, to examine, firstly, whether entry into effect of the agreements translates into more dynamic goods exports. And, secondly, to examine what explains that momentum.
Exhibit 3 depicts the trend in non-energy goods exports around the time of entry into force of the different agreements. Each agreement is weighted by the volume of sales by the exporting nation to the partner in question in the year before the entry into force of the agreement, denoting its importance. There is also a minimum threshold for exports of 100,000 dollars and a two-year persistence requirement applied symmetrically before and after the agreement with the aim of stripping out
ad-hoc flows that could distort the results.
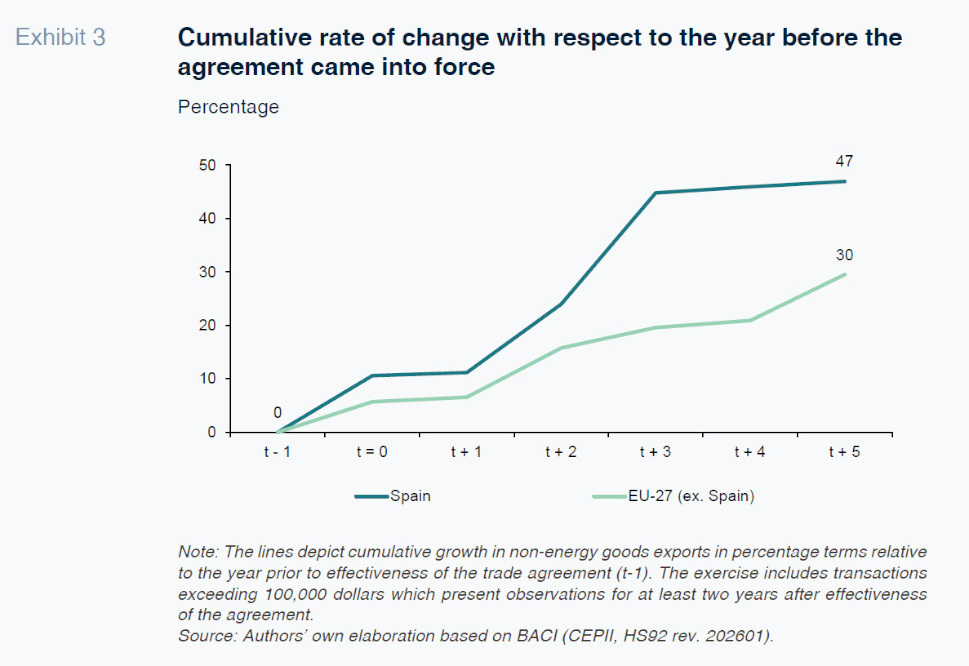
The aim is to illustrate whether the agreements are related to an acceleration in exports to the countries with whom they are arranged. This exercise does not constitute causality as the entry into force of the agreements could coincide with other factors that affect bilateral trade. However, the comparison between goods exports under the same trade terms, on the one hand, and with respect to the same partners before the agreement, on the other, depicts reasonably differentiated patterns.
Both paths depict a dynamic trend since the entry into effect of the agreements pointing to a positive impact on goods exports by European firms. However, Spanish goods exports respond more intensely than those of the rest of the EU. This gap does not open up right from the beginning. The two geographies register similar growth rates in the first two years and begin to separate from then on. The countries making the biggest contributions are Mexico and Algeria, while sector-wise, the biggest contributors are machinery and reactors and automotive vehicles.
Overall, the results show divergence between Spanish goods exports and those of the other member states after the agreements take effect. However, these results do not allow us to distinguish whether the greater responsiveness of Spanish exports is explained by higher exports of products that were already being exported or the addition of new products to the export basket.
Growth in exports can materialise through two channels with different implications. On the one hand, businesses can increase the volume of products they are already exporting to a given market, deepening the existing trade (intensive margin). On the other hand, they can introduce new products into their export baskets, widening the universe of goods they sell overseas. This second channel, called the extensive margin, is particularly relevant from the standpoint of trade policy as it represents around 60% of large economies’ exports (Hummels and Klenow, 2005).
To differentiate between the two margins, Exhibit 4 disaggregates the growth in goods exports following effectiveness of the trade agreements under analysis. The extensive margin shows the contribution of products that were not exported to the trading partner before the agreement and that are sold consistently (at least two years) following its entry into force. The intensive margin captures the change in the volume of products that were already being exported to that country, whereas the disappearances reflect the impact of products that cease to be exported to those markets. In this exercise, for consistency, the same filters (minimum threshold and consistency) are applied as for the Exhibit 3 analysis.
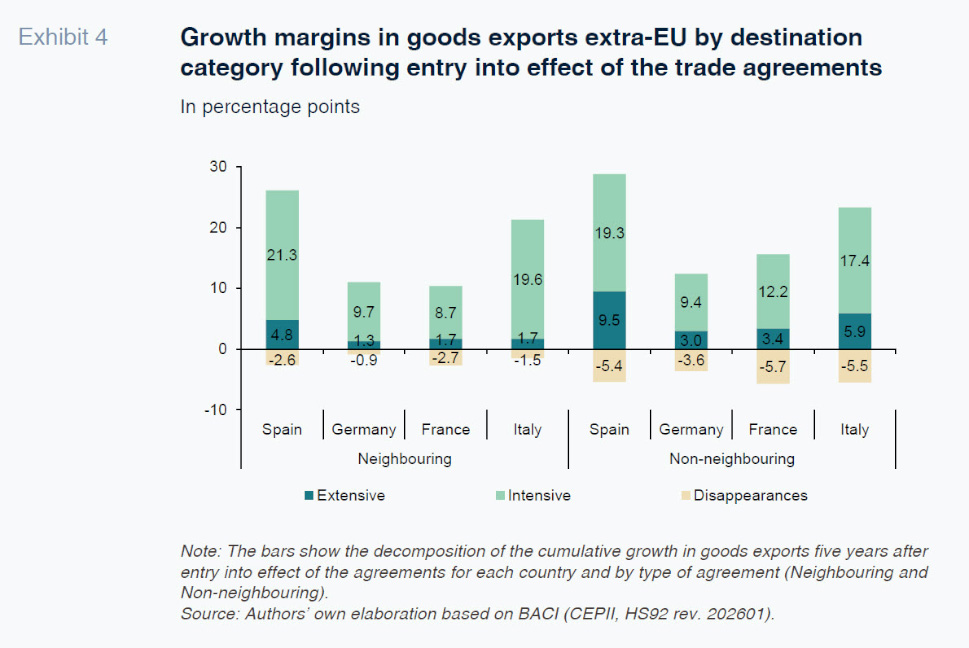
The decomposition of the growth in exports reveals a pattern that is common across the four largest EU economies. The intensive margin explains most of the growth in exports in all instances, whereas the extensive margin makes a more limited contribution. In aggregate terms, the Italian pattern is more similar to the Spanish experience, while Germany and France both display a less pronounced uplift in their goods exports associated with the agreements.
The decomposition of the growth in exports reveals a pattern that is common across the four largest EU economies. The intensive margin explains most of the growth in exports in all instances, whereas the extensive margin makes a more limited contribution. In aggregate terms, the Italian pattern is more similar to the Spanish experience, while Germany and France both display a less pronounced uplift in their goods exports associated with the agreements.
In Neighbouring, Spain registers net growth of 23.5%, compared to 10.1% in Germany, 7.7% in France and 19.6% in Italy. This result is concentrated in the intensive margin, which contributes 21.3 percentage points (pp) of the growth in Spain, marking a big difference with respect to Germany (9.7pp) and France (8.7pp). That contribution is explained primarily by Algeria and Morocco (70%), while in terms of sectors, the mix is relatively diversified, although the steel and automotive sectors stand out.
In Non-neighbouring, the aggregate growth in Spanish goods exports (23.4%) is similar to the growth in Neighbouring and compares to a range of between 8.8% and 17.8% for the other European economies. The differences in aggregate growth between the four major economies are smaller but not the composition effect. The contribution of the extensive margin in the case of Spain amounts to 9.5pp, compared to a range of between 3pp and 5.9pp for its European peers.
The decomposition by historical and linguistic ties reveals that these links are more relevant for the intensive margin, explaining 71.7% of its contribution (13.8pp). Chile and, especially, Mexico, are the countries that make the biggest contribution to this result. By sector, machinery and reactors and automotive vehicles stand out.
Meanwhile, the extensive margin kicks in more in the agreements reached with countries without ties. Those agreements explain 64.2% of the extensive margin contribution, or 6.1pp, and that contribution alone is bigger than the total extensive margin of Spain’s European counterparts. South Korea, Singapore and Japan explain most of the result in the case of Spain, while steel, iron and electronics are the biggest-contributing sectors.
The “disappearances” segment reflects pre-existing product-market pairings that cease to exist following effectiveness of an agreement and in the four major economies act as counterweight, playing a bigger role in Non-neighbouring.
The results highlight that the momentum in Spanish export activity not only depends more on Non-neighbouring trading partners compared to its European peers, but also its composition is different. That differentiation runs through two asymmetric channels associated with historic or linguistic ties. The markets with those ties account for most of the intensification in pre-existing flows, while the markets with no ties explain most of the new product flows. This decomposition suggests that future trade agreements could shape exports in different ways depending on the characteristics of the new trading country or region.
The agreements have a positive impact on Spanish goods exports, a bigger one than in the rest of the EU, and the composition of the growth by margins and geographies is also different. That contribution is consistent with the asymmetry observed in Exhibit 1 but does not explain it in full. Moreover, some of the gap between Spain and the other member states may reflect factors that are not captured in the analysis, such as productive specialisation. The study identifies, therefore, the correlation between the agreement network and the Spanish export pattern but not all of the determinants of its goods trade balance.
In sum, the national response associated with this EU Trade Policy instrument is not uniform across the member states. Next, we provide a forward-looking assessment of the more recently concluded trade agreements, building from the analysis presented.
Takeaways for new agreements and conclusions
The analysis shows that Spanish exports respond more intensely to trade agreements than the rest of the EU in both aggregate and composition terms. When the trading partners are Neighbouring countries, the growth is explained mainly by the intensive margin. With more geographically distant countries, the Spanish economy triggers the extensive margin more intensely than the other large European economies.
Moreover, historical and linguistic ties count. If the countries have a prior relationship with Spain, the intensive margin dominates. If not, the extensive margin comes into play more. These patterns are consistent with a differential response in Spanish goods exports.
Against this backdrop, the agreements closed or pending effectiveness since 2024 can be classified into three groups. The first group comprises the Mercosur region, with whom the agreement has been in partial and provisional effect since May 2026. The expected transmission channel is mixed. Linguistic ties should reinforce existing flows, whereas the agreement could also activate the extensive margin on account of the region’s size and sector structure.
The second group consists of the modernised trade agreements with Mexico and Chile, where the intensive margin can be expected to come into play. Agreement updates can have meaningful positive effects on trade relations (Nagengast and Yotov, 2025). The third group includes partners without meaningful pre-existing ties and includes India, Indonesia and Australia, where the results suggest that the extensive margin will be more of a factor. The specifics will depend, however, on the depth of the agreement and support for businesses.
The network of trade agreements is, therefore, a necessary but not sufficient condition on its own to manifest the export potential documented in this paper. The entire process from signature, through ratification and, ultimately, effective implementation can move in fits and starts and take years to complete. Once in force, another constraint is effective utilisation of the trade preferences by businesses. Also, the sensitivity of certain sectors, such as the food and automotive industries, is an additional factor in agreement effectiveness.
The interplay between the characteristics of the agreement and the starting position of the Spanish firms has implications for the provision of institutional support. The agreements’ impact can be expected to be bigger where there is more scope for growth via the extensive margin, but market entry costs are higher.
In an environment marked by tariff tensions and competitive pressure, trade agreements are an additional tool for achieving Europe’s economic targets. The EU’s common trade policy does not have a uniform impact on all member states. The results of this paper suggest that the potential for stronger growth in Spanish goods exports depends on the existence of deep agreements, institutional support and effective utilisation of trade preferences.
References
ARJONA, R., CONNELL, W., & HERGHELEGIU, C. (2026). Supply Chain Tectonics: Empirics on how the EU is plotting its path through global trade fragmentation. The World Economy.
BAIER, S. L., & BERGSTRAND, J. H. (2007). Do free trade agreements actually increase members’ international trade? Journal of international Economics, 71(1), 72-95.
HIDALGO PÉREZ, M., & STEINBERG, F. (2023). Changes in the Spanish external sector: are they sustainable and has there been a change in the productive model? Real Instituto Elcano.
HUMMELS, D., & KLENOW, P. J. (2005). The variety and quality of a nation’s exports. American Economic Review, 95(3), 704-723.
JUNG, B. (2023). The Trade Effects of the EU-South Korea Free Trade Agreement: Heterogeneity Across Time, Country Pairs, and Directions of Trade within Country Pairs: Jung. Open Economies Review, 34(3), 617-656.
NAGENGAST, A. J., & YOTOV, Y. V. (2025). Staggered difference-in-differences in gravity settings: Revisiting the effects of trade agreements. American Economic Journal: Applied Economics, 17(1), 271-296.
VAN DER VORST, C. (2025). An economic assessment of the EU–Japan economic partnership agreement with realistic preference utilization rates. World Trade Review, 24(1), 1-24.
Miguel Ángel González Simón and Rocío Arroyo González. Funcas