
AI diffusion in the EU: Why geography still determines technology adoption
AI adoption among EU firms has accelerated rapidly but remains highly uneven, with Scandinavian economies recording adoption rates above 35% compared with single digits in parts of Southern and Eastern Europe. Persistent gaps in economic development, research capacity, and workplace digitalisation help explain this divergence, with potentially significant implications for long-term productivity convergence across the bloc.
Abstract: The economic impact of artificial intelligence will depend not only on how firms use the technology, but also on how widely adoption spreads across Europe. While AI adoption among EU firms has risen sharply—from 7.6% in 2021 to around 20% in 2025—the pace of diffusion remains highly uneven, ranging from more than 35% in Scandinavia to below 10% in parts of Southern and Eastern Europe. Drawing on EU-ICT-Firm Survey data and diffusion of innovation theory, this study finds that GDP per capita, R&D intensity, and workplace digitalisation are key drivers of firm-level AI adoption, whereas general human capital appears less significant. Yet even after accounting for these factors, a persistent divide remains between the Central-Northern and Southern-Eastern blocs, pointing to deeper differences in institutional quality and management practices. Even as the experience of early adopters facilitates the subsequent diffusion of AI across lagging regions, the continuous evolution of these technologies nevertheless risks turning existing adoption gaps into a more persistent source of economic divergence within the EU.
Foreword
Artificial intelligence (AI) is considered a new general-purpose technology (GPT) with the potential to transform productive processes, organisational practices and the competitive dynamics in a broad spectrum of sectors. As with earlier GPTs, such as electricity, information and communication technologies (ICT) and the internet, AI is characterised by its broad range of applications, dependence on complementary investments and scope for continuous improvement (Peña, 2026). Much of the interest in calibrating the economic impact of AI has focused on the consequences for employment and productivity in the businesses using this technology (Yotzov et al., 2026, for example). However, less attention has been given to the fact that not all firms adopt AI at the same time, which means that the impact of AI on the economy as a whole will depend not only on the technical capabilities and use of the technology by those that adopt, but also the speed and breadth of diffusion within the business ecosystem.
A hallmark and well-documented characteristic of the major technology transitions of the past is that diffusion proves highly uneven. Adoption tends to follow an S-shaped curve over time but at certain points in time, significant disparities are observed across firms and sectors. In the case of AI, that inequality goes beyond specific industries and firm traits and includes substantial differences across countries. The firms doing business in certain economies present relatively high AI adoption rates whereas those in other economies are clearly lagging behind, despite presenting similarities in terms of size, sector or observable capabilities (Bick et al., 2026). Moreover, the gaps across countries are showing little sign of closing rapidly, generating concern about the persistence of differences in productivity growth and international competitiveness.
This paper focuses on documenting and explaining the differences across countries and regions in AI take-up by businesses using data gleaned from the EU-ICT-Firm Survey of businesses in countries and regions of the EU (Eurostat, 2026).
[1] Although a significant body of literature has analysed the determinants of technology adoption at the firm level (highlighting factors such as company size, human capital, management practices and access to financing), most of those studies were conducted in specific national contexts, detached from the broader geographic landscape in which the firms operate.
[2] In parallel, the macroeconomic literature on technology diffusion has underscored the importance of country-specific factors, such as their institutions, education systems, infrastructure and regulatory frameworks (Comín and Mestieri, 2014). Ideally, the two perspectives should be brought together to yield an explanation as to why firms with similar observable characteristics exhibit systematically different AI adoption behaviours depending on their country of origin. However, the data available for this study only allows for an analysis of observable differences in AI adoption rates in the business universe in different countries and regions.
AI adoption usually requires access to advanced digital infrastructure, large volumes of well-managed data and a labour force with specialist skills. Other enabling factors include regulatory clarity around the use of data, the strength of the innovation ecosystem and the availability of complementary assets such as cloud computing and organisational knowledge. Those factors are largely determined at the national level. In this sense, firms do not adopt AI in a bubble: their adoption decisions are embedded into national systems that can facilitate or curb the diffusion process. This paper shares the results of a preliminary study that explains the differences in AI adoption rates across EU countries and regions as a function of variables that are observable for each, such as GDP/capita, the stock of knowledge, and human capital endowment, which have proven their ability to explain differences in technology diffusion between countries with respect to prior episodes of innovation.
The analysis shows that AI adoption starts sooner and spreads faster in the more economically developed countries, measured using GDP/capita, going on to spread more slowly thereafter in less developed countries. Elsewhere, for a given level of development, diffusion is faster in countries with a bigger stock of scientific and technical knowledge and more digitalised productive processes. However, differences in the stock of general human capital do not explain differences in adoption rates across countries and regions. Controlling for these structural differences between countries and regions, we are still left with differences in average firm-level AI adoption rates between the central and northern bloc of EU member states, on the one hand, and the southern and eastern bloc, on the other, which may be attributable to differences in productive specialisation, management practices, and institutional quality. Here, further analysis is required.
These differences in countries and regions’ ability to foster the diffusion of general-purpose technologies like AI will influence future patterns in productivity growth and divergence between economies because AI is not a one-off innovation but rather an evolving one. Therefore, although the firms in follower countries benefit from pioneer adopter knowledge and experience spillovers, the permanent innovation in AI technology could lead to chronic differences in its adoption, use and leverage across countries with different starting development levels. Public policies can in theory help alter the structural constraints and prevent or mitigate entrenchment. However, the “structural” nature of the contributing factors means that results should not be expected in the short term. For example, public policies designed to close gaps in digitalisation levels curtailing AI adoption take time to materialise.
AI adoption by firms in the European Union and Spain
This section provides a synthesis of the results of AI adoption by firms in the European Union using data from the EU-ICT-Firm survey. A firm is considered to have adopted AI when it declares having used at least one of the technologies itemised in the questionnaire. Accordingly, the adoption rate is defined as the percentage of firms with 10 or more employees that use some form of AI technology out of the total firm population. Eurostat provides this information at the country level and, partially, at the regional level (NUTS-2), allowing us to analyse not only differences between member states but also internal heterogeneity in countries like Spain. Next, we examine the aggregate results for the EU, going on to present AI adoption rates by Spanish region.
AI adoption by EU member state
The information on average adoption rates by country is provided in Exhibit 1. In 2025, approximately 20% of the European Union’s firms were using at least one type of AI, up from 7.6% in 2021, denoting rapid recent growth in the use of this technology in the business ecosystem. However, adoption rates vary widely across the different countries. Penetration is highest in Denmark, Finland and Sweden, which present rates of over 35%. At the opposite end of the spectrum are several Southern and Eastern European countries, including Romania, Poland, Bulgaria and Greece, where adoption rates are below 10%.
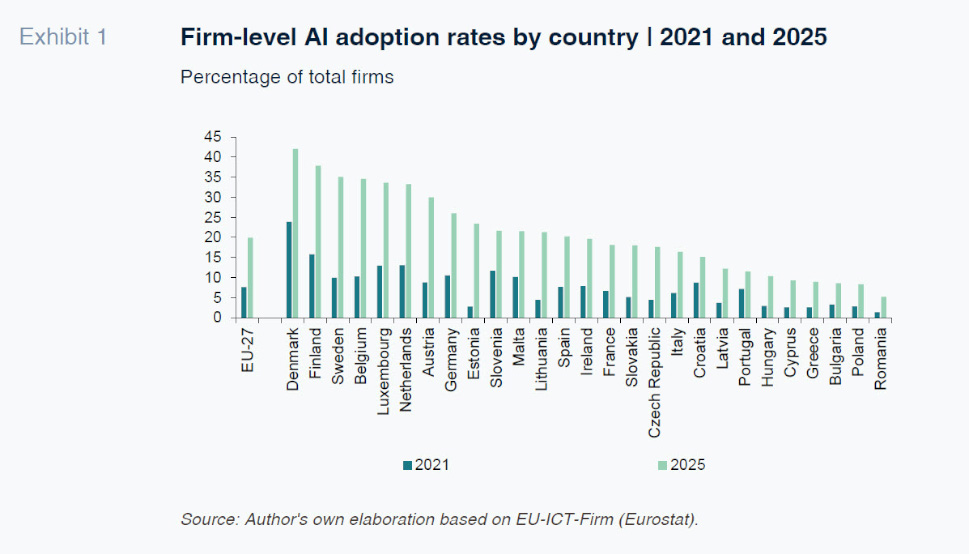
Spain ranks somewhere in the middle, with a rate of 20.3% in 2025, practically in line with the European average. That figure is below that of Germany, for example (26%), but higher than the rates reported for France (18.2%), Italy (16.4%) and Portugal (11.5%). In general terms, the distribution of the adoption rates within the EU is statistically dispersed, even among countries which share a common institutional framework, indicating the importance of national structural factors.
Compared to the results from other studies, Ferrando et al. (2026) —ECB— report a business adoption rate in the eurozone for 4Q25 of 38% (moderate or significant use of AI), well above the 20% found for the EU-27 by the EU-ICT-Firm. The adoption rate published by Fernández Cerezo et al. (2025) —Bank of Spain— for Spain, 20%, coincides almost exactly with the figure in Exhibit 1. Bick et al. (2026) compare firm-level AI adoption in Europe (EU-ICT-Firm) and the U.S. (BTOS) in the production of goods and services and, by extrapolation, for any business purpose. The results show rates of 7% (production) and
34% (general) in the U.S. and rates of 4% and 20%, respectively, in the EU.
Adoption speed dynamics
The trend in adoption rates over time permits an assessment of speed and convergence (or otherwise) in diffusion across countries. Between 2021 and 2025, adoption increased in all countries, but at different speeds. Exhibit 2 shows the lower (lowest 10
th percentile) and upper (90
th percentile) limits and the median for the adoption rate distributions between 2021 and 2025, along with the trend in the adoption rate in the EU and Spain.
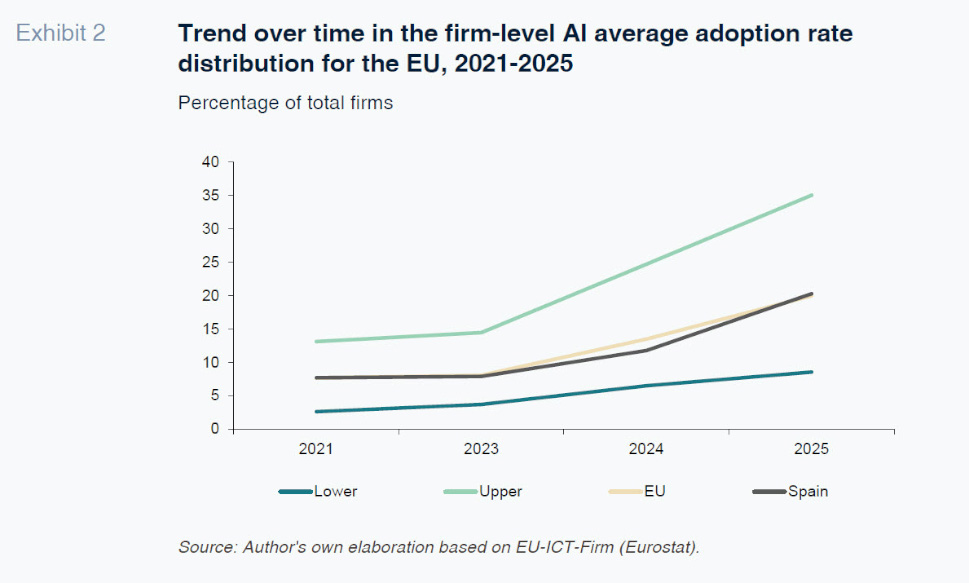
Diffusion accelerated in 2024 and, at the same time, the absolute gap between the lower and upper limits of the distribution widened, shaped above all by an increase in the distance between the upper limit and the median. The trend in the average adoption rates in Spain coincides with the trend in the median of the rate distribution for the EU countries. That figure once again singles Spain out as a country that is representative of what is happening in the broader European Union and implies that AI diffusion in Spain is lagging relative to diffusion in the countries that are ahead of the curve. Relating the absolute rate of change between 2025 and 2021 to the adoption rate in 2021, the simple correlation between the two variables is positive, indicating that the absolute change has been higher in the countries starting from higher rates in 2021, which is consistent with the increase in the distance between the lower and upper limits of the distribution range in Exhibit 2.
[3]
Differences attributable to firm size and sector of activity
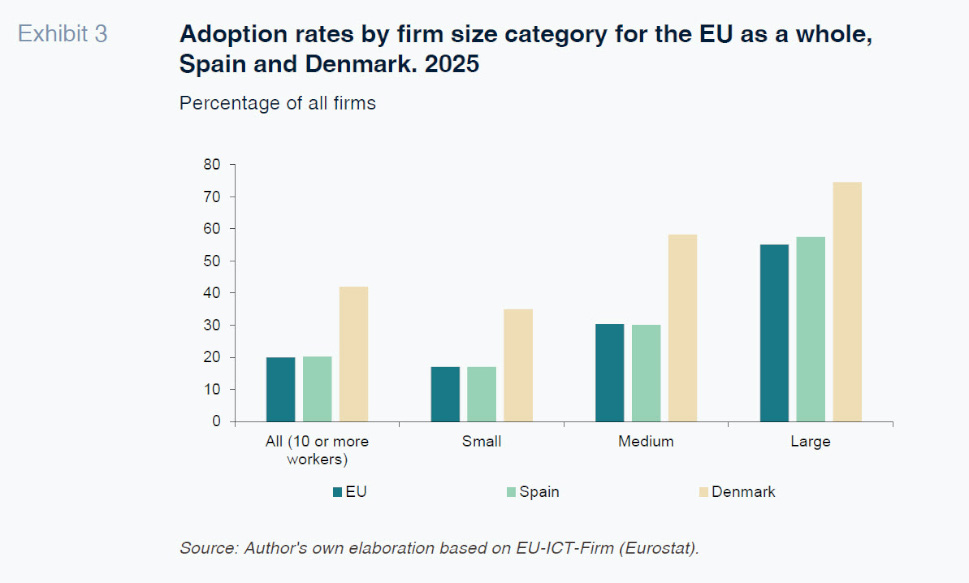
Exhibit 3 compares the adoption rates for small firms (between 10 and 49 workers), medium-sized firms (between 50 and 249) and large enterprises (250+) for the EU as a whole, for Spain and for Denmark, the selected benchmark on account of the fact that it reported the highest AI adoption rate in the EU in 2025. The distribution of adoption rates by firm size in Spain is once again similar to that of the EU as a whole, except for slightly higher penetration in Spain among the large enterprises. The firm-level adoption rate in Denmark is significantly higher than the Spanish rate and EU average in all size categories but the relative differences are more pronounced among SMEs (where the adoption rate in Denmark is twice that of Spain) than among large firms, where the distance to Spain narrows to 36%. In addition, in Spain, the adoption rate among large enterprises is three times that of its small firms, compared to a multiple of two times in Denmark. In terms of annual growth between 2023 and 2025, the absolute changes in the adoption rate are highest among large corporations but in relative terms they are highest among small businesses.
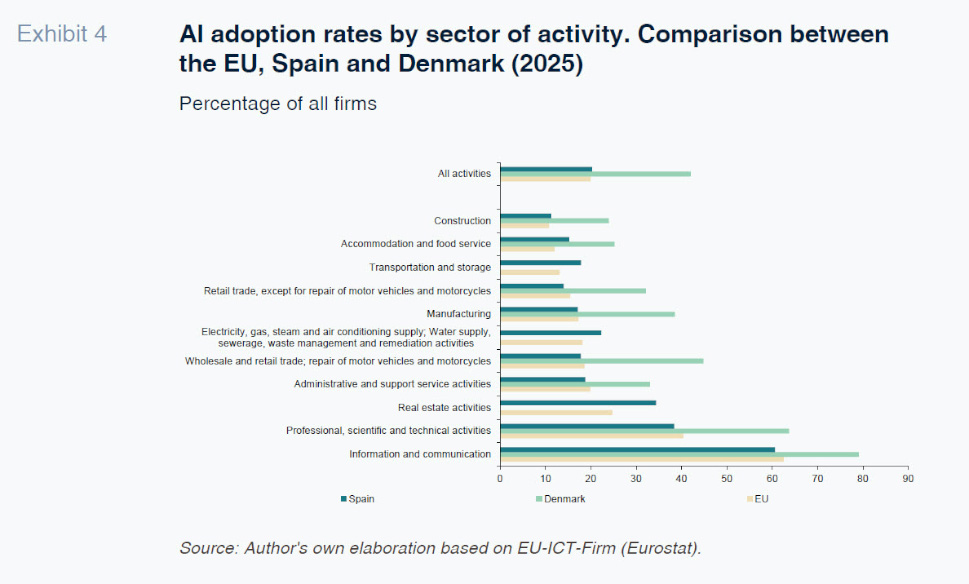
The propensity to adopt also varies by sector of activity, a pattern seen across all three geographies analysed (Exhibit 4). The sectors with the highest adoption rates in 2025 are the ICT sector in all cases (60% in Spain and 80% in Denmark), followed by scientific and technical activities (40% and 60%, respectively). Behind those industries, with adoption rates of under 15%, are construction, transportation and storage and accommodation and food services. In the manufacturing sector, adoption stood at 17.3% in Spain and close to 40% in Denmark in 2025.
Firm-level AI adoption by Spanish region
Eurostat disaggregates the AI adoption rates for firms in the EU at the NUTS-2 region level, which yields insight into AI adoption rates by businesses in the different regions of Spain and in a subset of regions in the EU (Exhibit 5). In Spain, the regional analysis also reveals considerable heterogeneity. In 2025, certain regions, including Madrid, Catalonia and the Basque region, presented adoption rates well above the national average, whereas other regions, notably Ceuta and Melilla, but also the Balearic Islands and Cantabria, ranked considerably below it. Overall, the regional differences observed in Spain reproduce, on a smaller scale, the pattern observed across European countries.
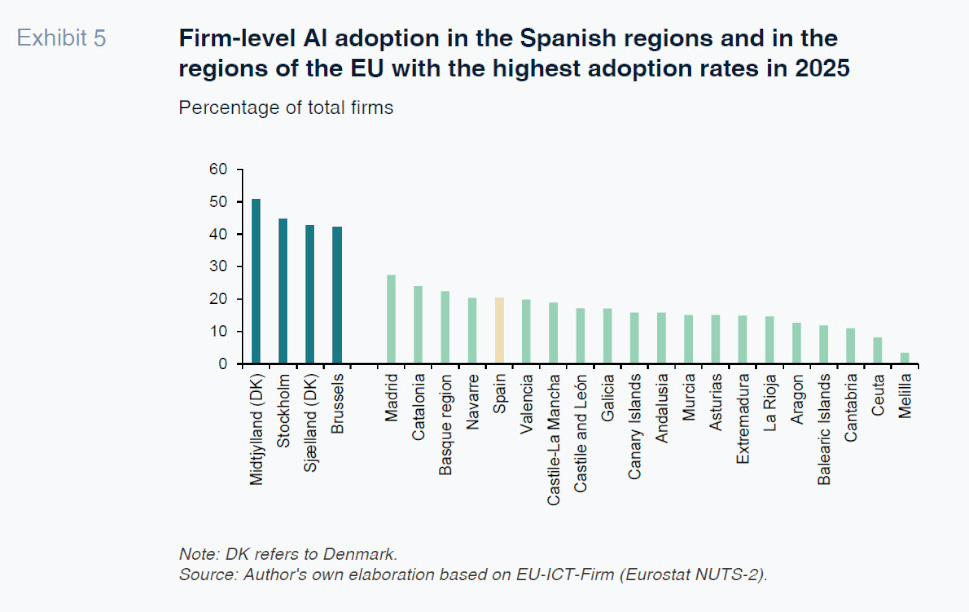
By comparison with the EU countries, the adoption rate in Madrid, at 27.4%, would rank it eighth on the country ranking, between Austria and Germany, far from the penetration rate of 42% observed in Denmark, which tops the ranking. Exhibit 5 also shows the AI adoption rates for the top four NUTS-2 regions in the regional ranking. The adoption rate in Madrid, which tops the regional ranking for Spain, is well below the top-performing regions in 2025 (Midtjylland, Denmark: 50.8%; Stockholm: 44.78%; and Brussels: 43.2%), which means that the differences between national averages shown in Exhibit 1 are repeated when comparing differences in regional distributions within the countries.
By way of summary of the results of this descriptive part of the study, the evidence shows that the EU is lagging the U.S. in terms of AI adoption at the firm level. The diffusion of AI — the result of technology adoption decisions at the firm level - emerges as a dynamic albeit uneven process across EU countries. Based on the data provided thus far, two variables —differences in the distribution by firm size and in productive sector specialisation across countries— may explain the differences observed in firm adoption rates. For example, the higher share of large corporations and/or sectors in the information and communication and scientific and technical activities sectors in Denmark than in Spain. However, the descriptive information does not explain why firm size and/or sector specialisation influence the propensity to adopt AI technology. Moreover, even if the distribution by size of firms with 10 or more workers were similar in the two countries, the adoption rate would continue to be higher in Denmark because within each size category, the propensity to adopt AI is higher in Denmark than in Spain. The next section outlines the fundamentals of the economic theory of how technology adoption spreads and provides a preliminary empirical analysis informed by the theory and prior evidence that correlates the differences in adoption rates to structural differences across countries.
Firm-level AI adoption explained by diffusion of innovation theory
The theory
Diffusion of innovation theory studies the decisions taken around the adoption and use of new technologies by firms (or individuals) that have not participated directly in their development. Its purpose is to characterise the accumulation of technology over time that results from individual adoption decisions. It includes theoretical and empirical analysis aimed at answering three main research questions (Comín and Mestieri, 2014; Stokey, 2020): What patterns are observed in technology diffusion and how do they change over time? What factors influence new technology adoption times, diffusion speeds and diffusion breadth? What are the micro and macro consequences of diffusion? Application of diffusion of innovation theory can help answer these three questions in the specific case of AI technologies. However, this specific analysis focuses exclusively on partial aspects of the first and second questions (the economic impact of AI diffusion falls outside the scope of this analysis).
The general premise of the exercise is that the adoption of new technology by a firm consumes time and resources and that economic motives determine who adopts the new technology and at what speed. As use of the innovation extends, its quality tends to increase while the costs of adoption fall. As a result, early adoption of the innovation by certain users facilitates subsequent adoption by the remaining potential users. Adoption cost dynamics, flows of information whereby followers can learn from pioneers and the ability to harness the information and know-how received explain the adoption times and the cumulative adoption pattern in a given country or market over time. The study of innovation diffusion processes completed in the past reveals an almost universal consistency: the rate of first adopters of the technology evolves in an S-shape (a logistics function) over time (slow introduction, acceleration, tipping point, deceleration and saturation).
[4]
Elsewhere, the speed and breadth of innovation diffusion tend to be uneven across countries and markets, which is attributable to differences in their structural factors, shaping the costs and benefits of adoption that are common to all firms in a given country. The literature has identified a set of variables that explain the differences observed in the speed of innovation diffusion across countries, which could also explain the differences being observed in the speed of adoption of AI by businesses in the EU countries to date. Comín and Mestieri (2014), in a review of their own research work and that of other authors, group these variables into three categories: knowledge, institutions and policies and demand. For example, in a pioneering study which includes multiple technologies and countries over time, Comín and Hobijn (2004) find that income per capita (demand), human capital endowment (knowledge), the level of openness to trade (policies), type of government (institutions) and adoption of predecessor technologies (knowledge) have a positive effect on countries’ technology adoption rates.
Explanation of the differences in adoption rates across countries in 2025
The hypothesis implicit in this study is that the firm-level AI adoption rates for EU countries and regions between 2021 and 2025, as published by Eurostat, correspond to points in logistics functions, one for each country, which describe their respective innovation diffusion paths. In this respect, by explaining the differences observed in diffusion across countries and regions for the most recent year, that with the most complete datasets, i.e., 2025, the model is explaining differences in the parameters of the corresponding logistics functions. Those parameters, in turn, vary across countries as a function of structural variables that can be observed. The explanatory variables were selected on the basis of the existing body of literature and the information available (Eurostat).
Variables and empirical model
The dependent variable is the adoption rate (percentage of firms using at least one of the AI technologies) in the EU country or region in 2025. The explanatory variables are the following:
GDP per capita (in euros in purchasing power parity terms) in the country or region. The expectation is that in the wealthier countries firms have more of an incentive to adopt AI than in poorer countries because (i) there are more resources available, so reducing uncertainty about the costs and benefits of adoption; and (ii) because more demand for the output generated by the innovation will increase the return for a given fixed adoption cost.
Share of people employed in the country or region who work in activities related with research and development (R&D). The countries with more people employed in R&D activities are more technologically advanced countries with a bigger stock of scientific and technical knowledge, facilitating adoption of AI by virtue of having better information and judgement in terms of knowing how to adapt the new technology in order to be able to use it profitably sooner.
Share of workers who use the internet in their ordinary job activities. This variable attempts to measure differences across countries in workers’ experience with digital technologies, giving them know-how that could be useful in facilitating usage and thereby accelerating the adoption of AI. It represents another form of knowledge embodied in individuals, which, unlike the more general knowledge accumulated through R&D activities, is a better proxy for the knowledge required to use the new AI technology. Internet connection at work varies with an economy’s productive specialisation. Elsewhere, an internet connection is a prerequisite for using AI.
Share of individuals with third-level education. A higher variable is associated with a higher level of formal education in the population in the country or region in question, with more general knowledge to complement the scientific and specific knowledge accumulated from prior adoption of digital technologies.
Geography and institutions. The countries and regions in the sample are grouped into four blocs based on their geographical location and presumed institutional affinity: Central Europe (Belgium, Netherlands, France, Germany and Austria), Scandinavia (Denmark, Finland and Sweden), Southern Europe (Spain, Portugal, Greece, Malta and Cyprus) and Eastern Europe (the remaining EU countries). Each country and region within the bloc is ascribed a value of 1, while the countries and regions that do not belong to that bloc are assigned a value of zero. In this manner, four dichotomous variables are defined: Central Europe, Scandinavia, Southern Europe and Eastern Europe. Implicit in the definition of this variable is the assumption that geography determines a series of cultural affinities and institutional similarities (not directly observable) that may condition the adoption of innovation, as has been established in earlier literature. In this manner we also control for variables related to geography and institutions omitted from the empirical regression model that are correlated with the dependent variable and the other explanatory variables; for example, differences across blocs in average firm size, productive specialisation, management practices, etc.
The empirical model estimated attempts to explain the adoption rate in country/region j in 2025,
yj as a function of the explanatory variables
Xij; the subindex i corresponds to each of the variables in the above list:
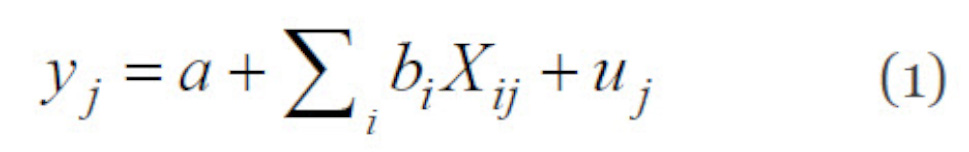
Where a and bi are the parameters to estimate and uj is the error term.
The adoption rate values, which relate to 2025, and the explanatory variable values, which relate to 2024, are sourced from Eurostat. In total, full information is obtained for 131 EU countries and/or regions. The results of the OLS estimation with heteroskedasticity-consistent standard errors are shown in Table 1 for different specifications of the equation (1).
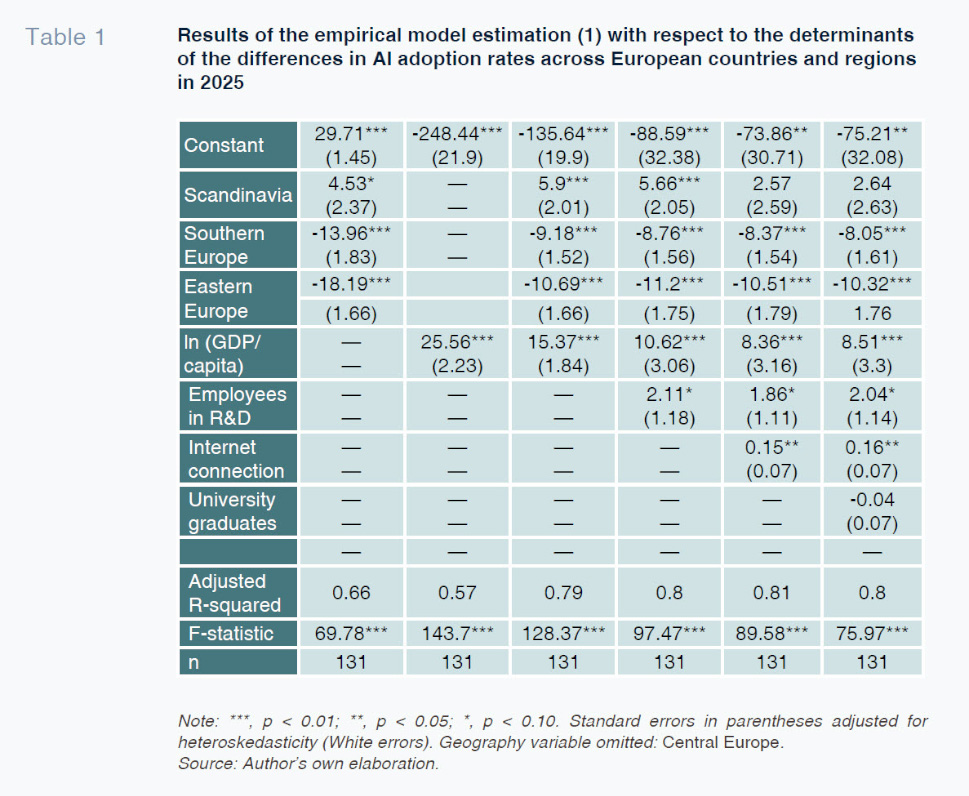
In the first specification, only the dichotomous variables (geography-institutions) are included. Those variables present a high explanatory capacity: an adjusted R² of 66%. The average AI adoption rate in the Scandinavian regions is 4.5 percentage points above the average adoption rate in the Central European regions and countries. The average AI adoption rates in the Southern and Eastern European regions are 14 and 18 percentage points, respectively, below the average diffusion rate in the Central Europe regions. The geographical location of a region within the EU (defined as Central, Southern or Eastern Europe and Scandinavia) is very informative of the average rate of AI adoption by the firms located there, yielding economically and statistically significant differences, particularly between the Central-North axis on the one hand and South-East axis, on the other.
In the second calibration, the adoption rate is explained solely by GDP per capita (in logarithms). The estimated coefficient of 25.56 indicates that a 10% difference in GDP per capita across countries is associated with an approximately 2.56 percentage point difference in the AI adoption rate. Based on the average value of the dependent variable (18.4%), this implies an estimated elasticity of AI adoption with respect to GDP per capita of 1.39.
[5] In other words, the sensitivity of AI adoption to differences in the level of economic development is particularly high. The adjusted R² yielded by the regression is lower than in the first column, which means that the geographical-institutional bloc to which the region belongs within the EU is more informative than the level of GDP/capita in explaining the differences in AI adoption rates by firms.
The third column in the table shows the results of the empirical model estimation that explain the regional adoption rate as a function of GDP per capita and the geographical-institutional variables. Here the adjusted R² rises to 79%, i.e., the model’s explanatory power increases. Elsewhere, the coefficient estimated for the GDP/capita variable (in logs) decreases to 15.4 and the estimated coefficients for the dichotomous geography variables change with respect to the first column: controlling for the level of GDP/capita, the differences in average adoption rates across regional blocs narrow, albeit without changing the sign of the differences. Lastly, controlling for the geographical bloc to which each region belongs, the elasticity of the AI adoption rate to changes in GDP decreases to 0.84.
Columns four, five and six show the results of the empirical model estimation when successively adding in the three variables that capture differences in knowledge and human capital across regions. The incremental increase in the adjusted R2 obtained by layering in these explanatory variables is smaller, increasing from 79% (column three) to 81% (column five). The coefficients estimated for the proxies for people working in R&D activities and those using an internet connection to do their jobs are positive and statistically significant, whereas, controlling for the other explanatory variables, the coefficient estimated for the share of individuals with third-level education (university graduates) is not statistically significant.
In quantitative terms, a difference across regions of one percentage point in the share of individuals employed in R&D activities implies a difference of approximately two percentage points in the AI adoption rate, in favour of the region with more R&D workers. Meanwhile, the variable measuring the use of internet at work yields a coefficient of around 0.15–0.16. That means that a difference of 10 percentage points in the share of workers who use internet at work is associated with a difference in the adoption rate of approximately 1.5–1.6 percentage points. This outcome evidences the role of digitalisation as direct enabler of AI deployment at companies. The fact that the variable measuring the share of people with third-level studies is not statistically significant indicates that, when controlling for the other explanatory variables in the model, the differences in a population’s general knowledge or human capital do not explain cross-regional differences in AI adoption rates.
[6]
When including the proxy for the level of an economy’s digitalisation in the explanatory variables in the model, the coefficient for the Scandinavia variable ceases to be statistically significant, whereas the coefficients estimated for the Southern and Eastern European variables barely budge. Apparently, the differences in average AI adoption rates by firms doing business in the Scandinavian countries and regions and the average adoption rates by firms in Central Europe are explained by a higher level of digitalisation (higher share of individuals working using an internet connection) in Northern Europe relative to Central Europe.
Lastly, in column five, when the R&D employment and internet connection variables are added in, the estimated coefficient for the GDP/capita variable falls again to approximately 8.5. Differences in GDP per capita across regions are positively correlated with differences in R&D employment and digitalisation levels, as borne out by the positive and statistically significant correlation of 0.6-0.8 between GDP/capita and each of these variables. When isolating the effect of GDP/capita as an explanatory variable for the AI adoption rate by controlling for the other two variables that are positively correlated with GDP/capita and the adoption rate, the elasticity of the adoption rate to changes in economic development levels falls to 0.46 (8.5/18.4); i.e., to one-third of the elasticity estimated when GDP/capita is the only explanatory variable in the model.
If we turn to the results for the Spanish regions within the general model, the difference between the average adoption rate for the Spanish regions, 16.3%, and the average adoption rate for the European regions as a whole, 18.4%, appears to be explained by less intense employment in R&D and less digitalisation in the workplace in the Spanish regions compared to the averages for these variables in the EU regions as a whole (the average of Log-GDP/capita for the Spanish regions is similar to that of the EU regions as a whole).
On balance, the quantitative results are in line with those of Comín et. al and confirm that AI adoption is sensitive to differences in the level of regional wealth and, in particular, to differences in the levels of wealth correlated with differences in human capital (scientific knowledge, specific knowledge unlocked by experience with digitalisation and education standards). These differences act by influencing the propensity to experiment of the early adopters (mainly thanks to greater scientific knowledge) and the speed with which the followers imitate them (shaped by experience with digitalisation). In turn, controlling for differences in wealth levels and their determinants, considerable differences persist in the average AI adoption rates in the regions and countries in Northern and Central Europe and the average adoption rates in Southern and Eastern Europe, which remain unexplained (differences in institutional quality, openness to trade, management practices and productive specialisation, among others, that are not fully embodied in GDP/capita).
Conclusions
The adoption of artificial intelligence technologies by firms is a necessary first step in unlocking their potential effects on productivity, employment and competitiveness at the aggregate level. This paper analyses the diffusion of AI in firms in the EU using data from the Eurostat EU-ICT-Firm Survey, combining descriptive evidence, focusing on the data for Spain, and empirical analysis of the determinants of the differences in adoption rates across countries and regions grounded on the theory of technological diffusion.
The results reveal, firstly, that AI adoption in the EU has increased rapidly in recent years. However, penetration in the EU as a whole is estimated to lag behind adoption in the U.S. Also, adoption is highly uneven across countries and regions. Whereas certain countries in Northern and Central Europe present high adoption rates, in other regions, concentrated in Southern and Eastern Europe, penetration remains relatively low. Spain falls somewhere in the middle, both by comparison with the rest of Europe and in terms of its internal regional heterogeneity. Regionally, Madrid presents by far the highest adoption rate, albeit still less than half of the adoption rates observed for the pioneering regions of the EU.
Secondly, the empirical model estimated to explain the adoption rates across EU regions and countries as of 2025 reveals that the differences in AI penetration are largely explained by structural factors. The level of economic development, intensity of employment in R&D activities, level of digitalisation and stock of human capital associated with experience with digital technologies adjacent to AI emerge as significant determinants. Overall, these variables explain a substantial amount of the observed variation, suggesting that the diffusion of AI is not a random process but rather one shaped by well-defined economic and institutional traits.
The strongest general conclusion from this exercise is that, as with earlier innovations, AI adoption begins in the richest regions and countries and then spreads to those with lower levels of GDP per capita. The difference in the propensity to adopt between rich and poor regions increases when the wealth differences are correlated with differences in scientific and technical knowledge and experience with digitalisation across regions and, despite not directly evidenced in this paper, differences in institutional quality, economic openness and management practices. In Spain, a relatively smaller average R&D effort and relative lag in digitalisation, coupled with high dispersion of these resources across regions, are dragging on the adoption and spread of AI among firms.
These results have relevant implications for economic policy. More specifically, they highlight how differences in the starting conditions across countries and regions can amplify differences in the economic impact of AI across territories because those initial conditions will determine the propensity to adopt this technology and the speed with which it spreads through the economy. In the absence of public intervention to at least partially correct the effects of the starting differences, AI could accentuate economic divergences within the European Union, directly at first until the follower firms complete adoption and later indirectly insofar as the early adopters will be in a better position than the laggards to move quicker in response to successive innovations in the AI space.
The results of this paper should be interpreted considering the limitations with respect to the data available, particularly the lack of information about the intensity with which AI is being used, and the unknowns on how the technology may develop in the future. Elsewhere, the analysis focused exclusively on the first stage of adoption of the technology. To complete the impact assessment, studies are needed into the impacts on productivity and employment and the interaction between firm-level technology adoption and organisational changes.
Notes
This is an abridged version of a longer text published in the form of a Funcas research note (Salas Fumás, 2026).
By way of example, for Spain, Fernández de Guevara and Mínguez (2025); Fernández Cerezo et al. (2025); COTEC-ISEAK (2025); Rodríguez Fernández (2026).
This result is the opposite of what would be expected if adoption rates were converging over time. However, when the change in the adoption rate between 2025 and 2021 is measured in relative terms, the correlation with the 2021 adoption rate is negative, which would support the convergence hypothesis.
The pioneering studies include those of Griliches (1957), Mansfield (1961) and Bass (1969).
Elasticity of the adoption rate, z, to GDP per capita derived from the estimation is calculated as: Elasticity of the adoption rate to GDP

The simple correlation between the share of people with third-level education and AI adoption rate variable is 0.54. On the other hand, the correlation between general human capital and GDP/capita, the share of individuals working in R&D and the share of individuals working with an internet connection is around 0.65.
References
BASS, F. (1969). A New Product Growth for Model Consumer Durables.
Management Science. 15(5): 215–227.
doi:10.1287/mnsc.15.5.215 BICK A., BLANDIN, A., DEMING, D., FUCHS-SCHÜNDELN, N., JESSEN, J. (2026). Mind the Gap: AI Adoption in Europe and the US.
Brookings Papers on Economic Activity, BPEA Conference Draft.
COMIN, D., and HOBIJN, B. (2004). Cross-country technology adoption: making the theories face the facts.
Journal of Monetary Economics, 51(1), 39–83.
COMIN, D., and MESTIERI, M. (2014). Technology Diffusion: Measurement, Causes and Consequences. En
Handbook of Economic Growth Volume 2B.
COTEC/ISEAK. (2025). Inteligencia Artificial y sus efectos en la productividad laboral. Fundación COTEC para la Innovación/ISEAK.
https://cotec.es/wp-content/uploads/2025/10/IA_WoK-v8_FINAL-IA-y-Productividad-Laboral.pdf EUROSTAT. (2026).
The USE of Artificial Intelligence (AI) Technologies in the European Union: Key results. Eurostat Statistical Report.
https://ec.europa.eu/eurostat/web/products-statistical-reports/w/ks-01-26-009 FERNANDEZ CEREZO, A., HIDALGO, I., and IZQUIERDO, M. (2025). Adoption of Artificial Intelligence in Spanish Firms: An initial analysis based on the Banco de España Business Activity Survey.
Economic Bulletin, Q2.
FERNANDEZ DE GUEVARA, J., and MÍNGUEZ, C. (2025).
La Inteligencia Artifical en España: Formación y Empresas Nativas. Monografía Fundación Areces.
https://www.fundacionareces.es/fundacionareces/es/publicaciones/la-inteligencia-artificial-en-espana-formacion-y-empresas-nativas.html?tipo=3GRILICHES, Z. (1957). Hybrid corn: an exploration in the economics of technical change.
Econometrica, 25(4),501-522.
MANSFIELD, E. (1961). Technical change and the rate of imitation.
Econometrica 29(4), 741-766.
PEÑA, D. (2026).
Comprender la Inteligencia Artificial. Funcas.
https://www.funcas.es/libro/comprender-lainteligencia-artificial/ RODRÍGUEZ FERNÁNDEZ, F. (2026).
Inteligencia Artificial y Mercado de Trabajo en España. Exposición Ocupacional, Efectos sobre el Empleo y Adopción Empresarial. Investigaciones de Funcas, 33/2026.
https://www.funcas.es/documentos_trabajo/inteligencia-artificial-y-mercado-de-trabajo-en-espana-exposicion-ocupacional-efectossobre-el-empleo-y-adopcion-empresarial/ SALAS FUMÁS, V. (2026).
La adopción de las tecnologías IA por las empresas de la Unión Europea: evidencias y explicaciones desde la teoría de la diffusion tecnológica. Investigaciones de Funcas, 34/2026.
https://www.funcas.es/documentos_trabajo/la-adopcion-de-las-tecnologias-ia-por-las-empresas-de-la-union-europea-evidenciasy-explicaciones-desde-la-teoria-de-la-difusion-tecnologica/ STOKEY, N. (2020). Technology Diffusion.
NBER Working Paper, 27466.
http://www.nber.org/papers/w27466 YOTZOV, I., MARIA BARRERO, J., BLOOM, N., BUNN, P., DAVIS, S. J., FOSTER, K. M., Y JALCA, A. (2026). Firm Data on AI.
NBER Working paper, 34836.La adopción de la IA por las empresas en países y regiones de la UE. Un análisis preliminar desde la teoría de la difusión tecnológica
Vicente Salas Fumás. Professor Emeritus at Zaragoza University and Funcas