
The recovery of the eurozone periphery: Structural growth or cyclical momentum?
Growth rates across the countries of southern Europe, once considered the weakest link in the eurozone, have outpaced the bloc’s core economies in recent years. While structural reforms have played a part, continued economic convergence within the eurozone will depend on consolidation of structural improvements, boosting productivity and resilience to global uncertainty.
Abstract: Once heavily impacted by the EMU sovereign debt crisis, the economies of southern Europe, or the peripheral countries, have shown significant economic resilience in recent years, growing faster than the bloc´s largest economies. While this momentum has been partially driven by post-pandemic recovery and external factors like energy market shifts, structural improvements–including labour market reforms, banking sector restructuring, and fiscal adjustments–have played a key role in narrowing the gap with core eurozone peers. Foreign investment flows and sovereign risk premiums reflect renewed investor confidence in the periphery, reinforcing the perception that these economies have gained stability. However, sustaining this convergence will depend on continued productivity gains and the ability to withstand global economic uncertainties.
EMU crisis (2010-2012)
The eurozone sovereign debt crisis (2010-2012) seriously affected the southern European economies of Spain, Portugal, Italy and Greece, as well as Ireland (hereinafter, the “periphery” or the “peripheral economies”). Those economies presented significant macroeconomic imbalances, including high debt and deficit levels. The causes of that crisis and its bigger impact on those countries had to do with structural factors as well as the aftermath of the Great Financial Crisis of 2008.
The creation of the EU’s Economic and Monetary Union (EMU) in 1992 led to greater financial integration but also evidenced structural differences between the bloc’s member states. On the one hand, the so-called “core” economies (Germany, France and the Netherlands) presented more stable and sustained growth, higher GDP per capita and greater financial discipline. The “periphery” economies, on the other hand, were characterised as presenting more volatile growth, reduced competitiveness and higher debt and deficit levels.
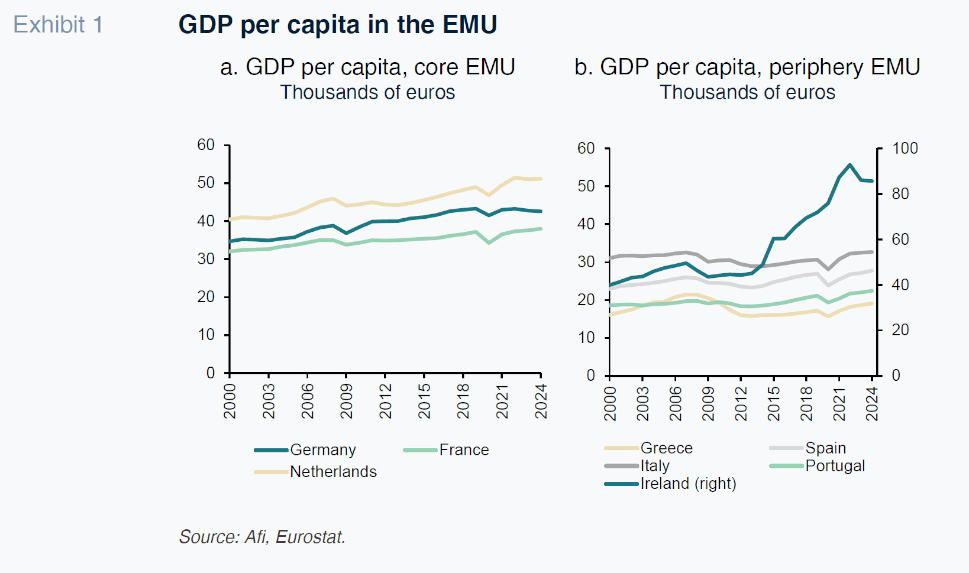
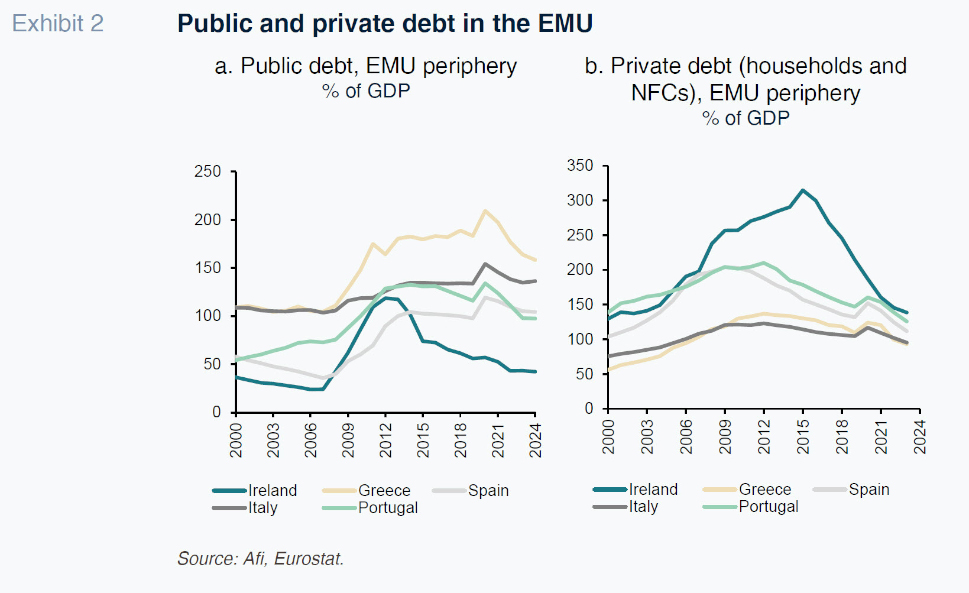
The Great Financial Crisis of 2008, while originating in the US, had an impact on the global economy and financial system. The drop in growth triggered a drastic reduction in the European countries’ tax receipts, intensifying existing fiscal shortcomings along the periphery and exposing their sharp current account imbalances to a sudden correction. Greece and Italy reported the highest public debt levels in 2008, at 110.9% and 105.8% of GDP, respectively, levels that would surge to 147.8% and 118.7%, respectively, in 2010, in the aftermath of the Great Financial Crisis. Despite presenting controlled public debt ratios before the crisis, Spain and Ireland experienced real estate and banking credit bubbles that led to unsustainable levels of private debt, pushing them into a balance sheet recession. Portugal, Spain and Ireland headed into the crisis of 2008 with private debt levels of around 200% of GDP.
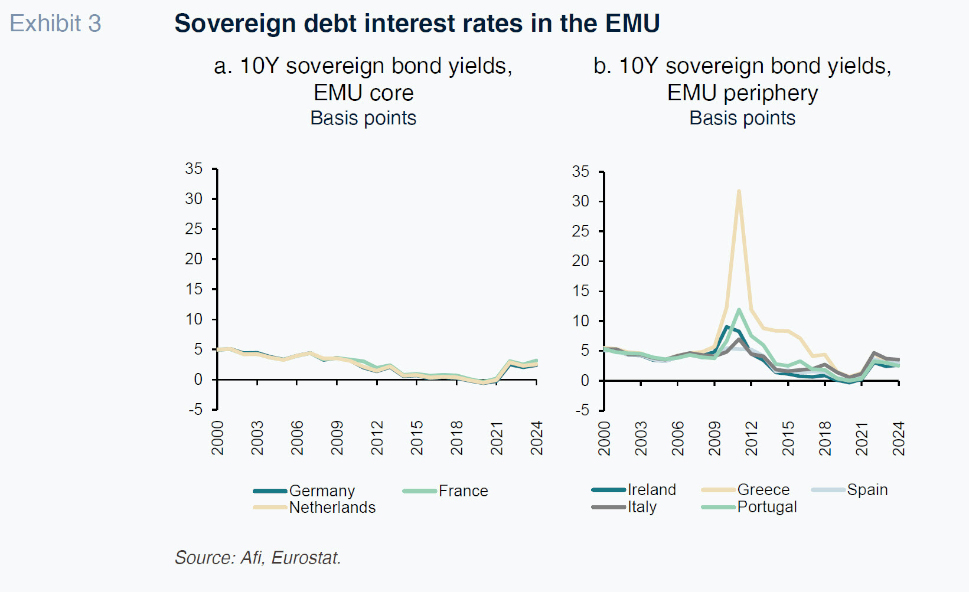
The EMU’s lack of mechanisms for imposing financial discipline on the member states or for managing the debt crisis sparked a loss of confidence and sent risk premiums higher, particularly along the periphery. In 2009, it was discovered that the Greek government had manipulated its public finances to hide its real levels of public debt, revealing that the public deficit was actually 15.4% of GDP (rather than the 6.7% published until then). That sent its 10-year sovereign bond yields soaring from 5.7% in 2009 to 12.3% in 2010 and a peak of 31.8% in 2011. The wave of contagion affected Portugal, Ireland, Spain and Italy, whose borrowing costs also rose sharply.
In response to the risk of EMU fragmentation, the European Stability Mechanism (ESM) was set up in 2012 as a permanent rescue fund. That same year the ECB also launched its first Outright Monetary Transactions (OMTs), allowing it to buy sovereign bonds in the eurozone’s secondary bond markets in a bid to rein in risk premiums.
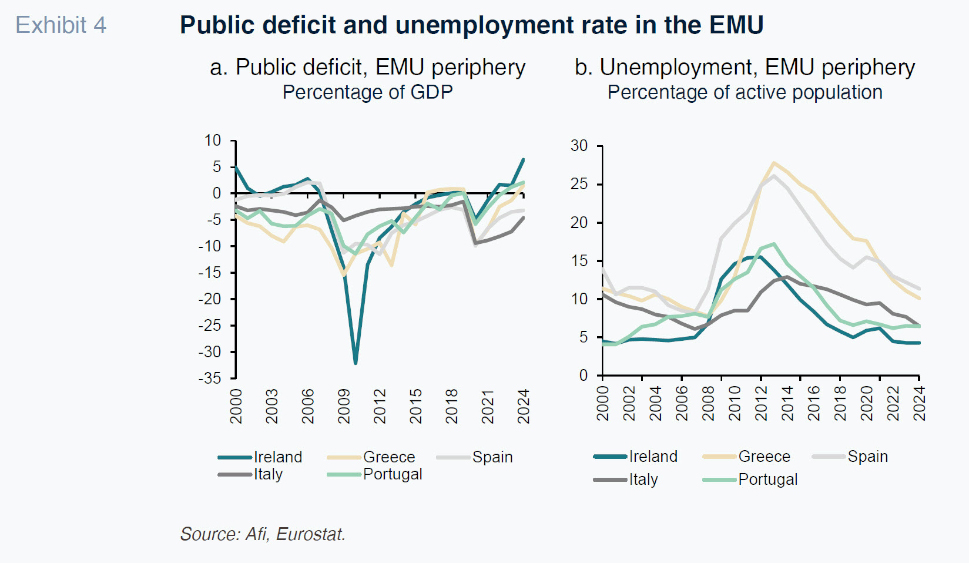
In an attempt to contain the economic impact of the crisis and restore confidence in the sustainability of the EMU, the Troika (European Commission, ECB and IMF) decided to bail out Greece (2010, 2012 and 2015), Ireland (2010) and Portugal (2011), imposing strict austerity measures in exchange. Those measures, designed to impose tighter financial discipline, ultimately aggravated the social and economic crises in the countries most affected by the crisis, like Greece, generating political tensions and calling the EMU’s strategy into question. Greece’s GDP contracted by over 25% between 2008 and 2013 and its unemployment rate peaked at 26.6% in 2013. In Spain, unemployment also peaked in 2013, with 26.1% of the active population out of work.
Meanwhile, the bank bailouts drove public debt levels significantly higher. The bailout of the banking sector in Ireland increased its deficit from 13.9% of GDP in 2009 to 32.1% in 2010. Spain, meanwhile, faced a solvency crisis in its savings bank segment and in 2012 received €100 billion of aid from the European Union to sort out its banking sector.
In December 2013, Ireland was the first bailed-out economy to exit the Troika programme, thanks to a rapid recovery fuelled by strong exports and sharp fiscal adjustments. Portugal, an economy marked by low growth and high foreign borrowings, managed to exit the programme in May 2014. Greece, which was the hardest hit, underwent a debt restructuring in 2012 and officially exited the programme in August 2018, albeit remaining under financial supervision. Spain and Italy, while not officially bailed out, finalised their aid programmes in 2013 and 2014, respectively.
Structural reforms and competitiveness gains
After the EMU crisis of 2010-2012, the peripheral European economies implemented a series of structural reforms with a view to lifting their competitiveness and economic stability. Those policies focused on several key areas, including the labour market, financial, taxation and pension systems and the structure of the public sector.
On the labour front, Spain undertook far-reaching reforms in 2012 that left its job market more flexible, making it easier to hire and fire and fostering collective bargaining at the firm level. Portugal also introduced measures to reduce the costs of dismissals and make labour contracts more flexible, allowing its companies to better adapt to prevailing market conditions. Greece made its labour laws more flexible and reduced the minimum wage in a bid to lift competitiveness and attract foreign investment. Italy introduced its Jobs Act in 2015 to make job contracts more flexible and reduce unemployment benefits, so shaking up the labour market and reducing youth unemployment.
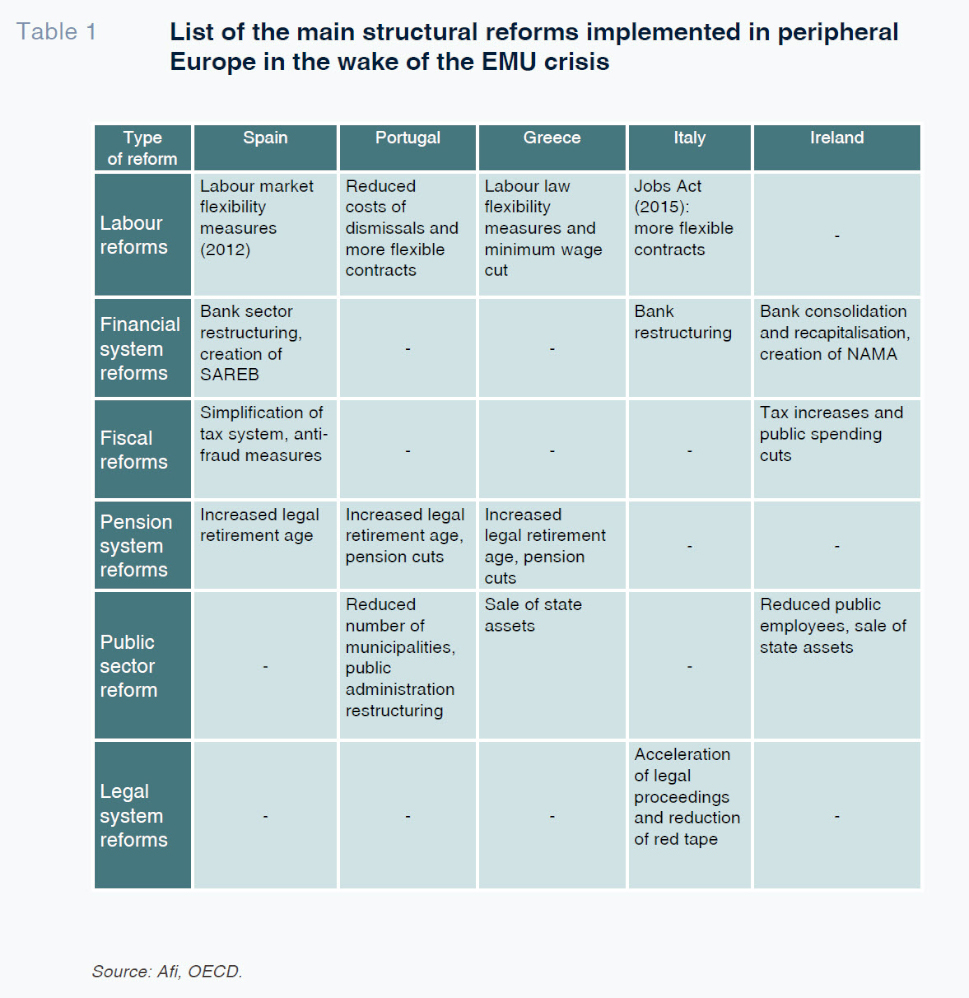
As for the financial system, Spain restructured its banking sector, creating a bad bank (SAREB) to manage non-performing assets. Italy also restructured its banks and took steps to recapitalise them. Ireland had already created a bad bank called NAMA. It also reduced the number of banks and recapitalised the remaining financial institutions to fortify its banking system, so restoring financial stability and fostering the economic recovery.
On the fiscal front, Spain simplified its tax system and took steps to combat tax fraud, boosting tax efficiency and collection. Ireland raised taxes and cut public spending to balance its finances and reduce its deficit, measures that were essential to restoring market confidence and ensuring its long-term fiscal sustainability.
In the public sector, Portugal restructured its public administration, reducing the number of municipalities and increasing government efficiency. Ireland cut the number of public sector employees and sold off state assets to boost public sector efficiency and contribute to the fiscal consolidation effort. Greece also implemented a state asset disposal programme to reduce public debt and attract investment, thereby delivering on the commitments assumed in the course of its bailout programmes.
Each country tackled its specific challenges with a pool of measures adapted to their unique needs, boosting economic stability and growth in the region. These structural reforms have been essential to improving their competitiveness.
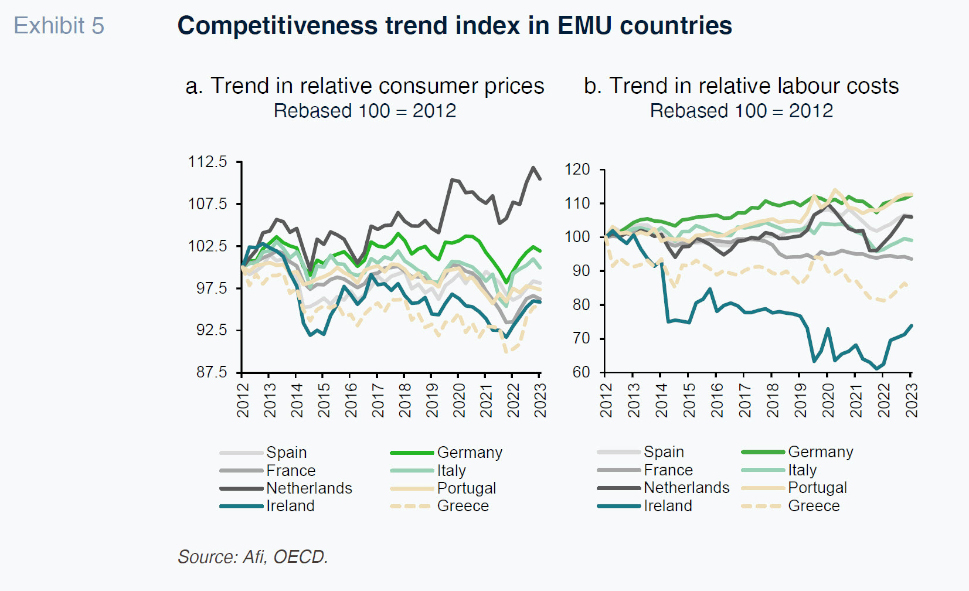
The competitiveness indicators compiled by the OECD yield mixed conclusions for the peripheral economies. In terms of price competitiveness, while Ireland has registered strong gains thanks to sharp economic growth and foreign direct investment, other peripheral economies, including Italy and Spain, have seen their competitiveness suffer as a result of increases in the relative prices of the goods and services they export. Nevertheless, the trend in prices has been substantially better than that observed in core economies, like the Netherlands, the country to have sustained the biggest loss of competitiveness in relative price terms since 2012.
In terms of labour cost competitiveness, the periphery economies have implemented major reforms, as detailed above, and devised strategies to attract foreign investments that have helped improve their international competitiveness. However, structural challenges and productivity issues have hurt their ability to sustain the momentum. In particular, Spain and Portugal have suffered difficulties on account of increased labour costs and the need to boost productivity that are very similar to those suffered in other core economies, such as the Netherlands and Germany. Greece and Ireland, on the other hand, have gained competitiveness in terms of labour costs when analysing the data from 2012 to 2023 (the most recent figures available for this indicator of the trend in international competitiveness compiled by the OECD).
These competitiveness gains have, together with other factors, driven economic growth in these peripheral economies and made inroads into the GDP gap with the core economies.
Economic convergence and tailwinds: Structural and cyclical factors
In recent years, growth dynamics in peripheral Europe have been stronger than those encountered in core European countries, particular in the post-COVID period, 2021-2024. Whereas the former have registered average annual growth of around 5%, the latter have recorded only half as much. While the convergence process was initially driven by the recovery of ground lost as a result of COVID-19 (when these economies also contracted by relatively more), since 2022, their growth is being driven more by other factors.
The improvement in the periphery economies is not only attributable to the structural reforms undertaken in the past, but also cyclical factors, including: (i) the global economic recovery that began to take hold in 2021; (ii) expansionary monetary and fiscal policies (and their coordination throughout the pandemic, in contrast to what happened during the previous Great Financial Crisis); and (iii) the measures taken to combat the adverse effects of the war in Ukraine (on top of the fact that the periphery economies are less exposed and vulnerable than the core European economies, whose productive structure uses energy more intensively and which were relatively more dependent on Russian oil and gas imports).
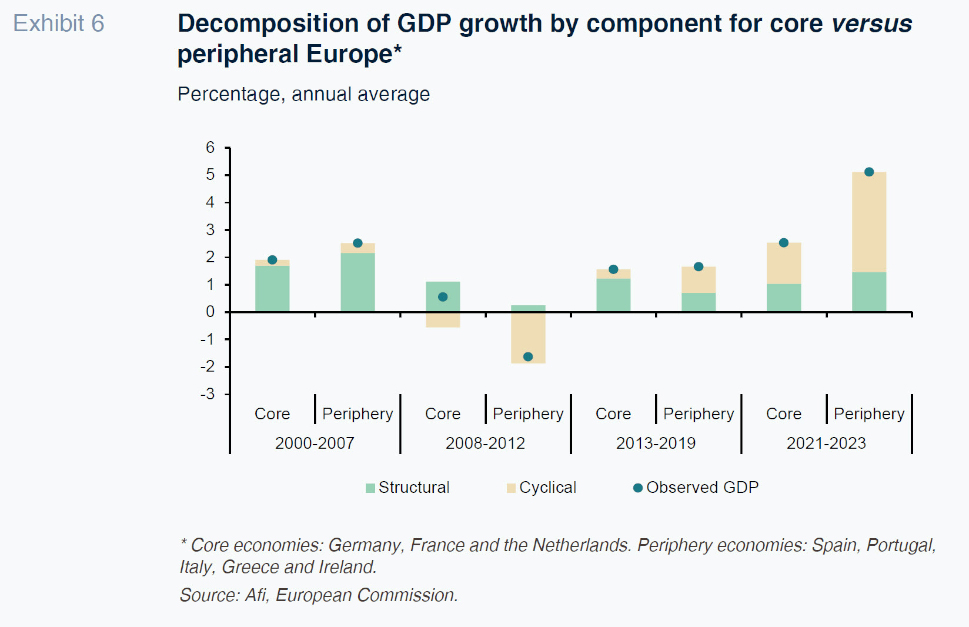
In fact, an analysis of the decomposition of GDP growth between the structural [2] and cyclical [3] components highlight this reality. The periphery economies have not only increased the contribution by the structural component to GDP growth, especially in the last two years (when this contribution has deteriorated slightly in the core economies), they have also benefitted more from the cyclical drivers than the core European economies. The European Commission’s forecasts for potential output and total GDP for 2025-2027 suggest that this convergence is set to continue. In all likelihood, the relatively better performance by the periphery economies and stagnation across the core European economies will help reinforce the perception the former are improving relative to the core economies.
Echoes in financial flows and sovereign risk premiums
The relatively stronger macroeconomic performance of the periphery member states since the Great Financial Crisis and subsequent EMU sovereign debt crisis (2008-2012) is also echoed in the relative trend in key financial variables, including investment flows and sovereign debt risk premiums relative to the core countries, particularly Germany.
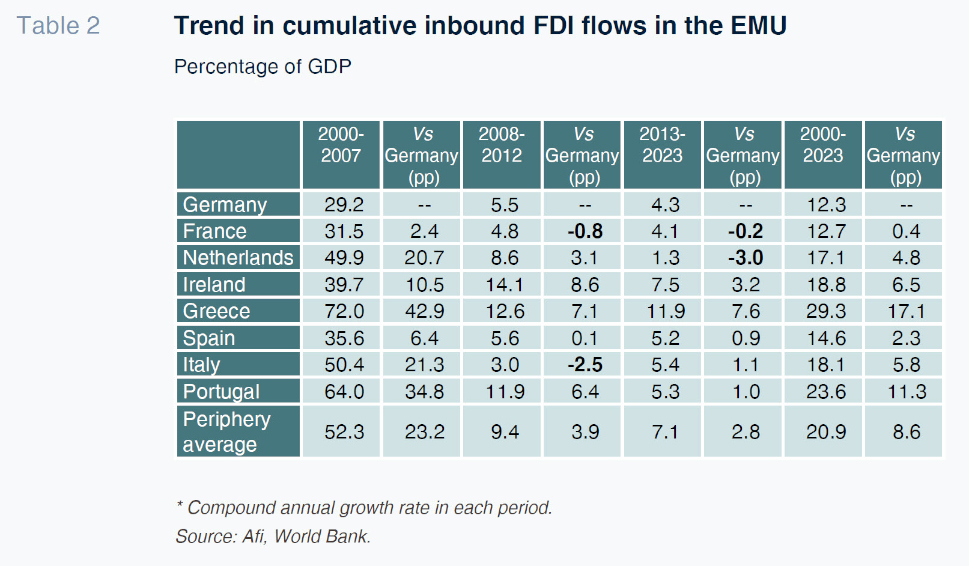
Here we analyse two variables for investment flows: cumulative foreign direct investment (FDI) flows and the composition of sovereign debt holdings. The following table shows the compound average growth rates in FDI over different time intervals and the growth differential in this variable, in percentage points, for each country relative to Germany. It tells that in the years of crisis, growth in inbound FDI flows to the five peripheral economies relative to Germany declined sharply by comparison with the early years of the EMU. FDI in Spain and Italy sustained a sharp relative contraction. In the ten years since 2013, however, these economies have consistently recorded faster growth in FDI flows than Germany (albeit well below the differentials observed in 2000-2007).
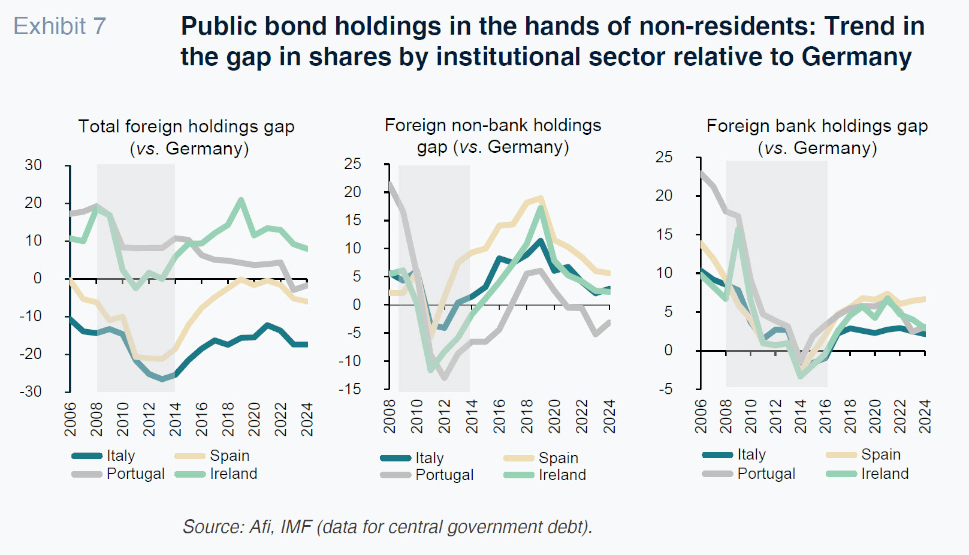
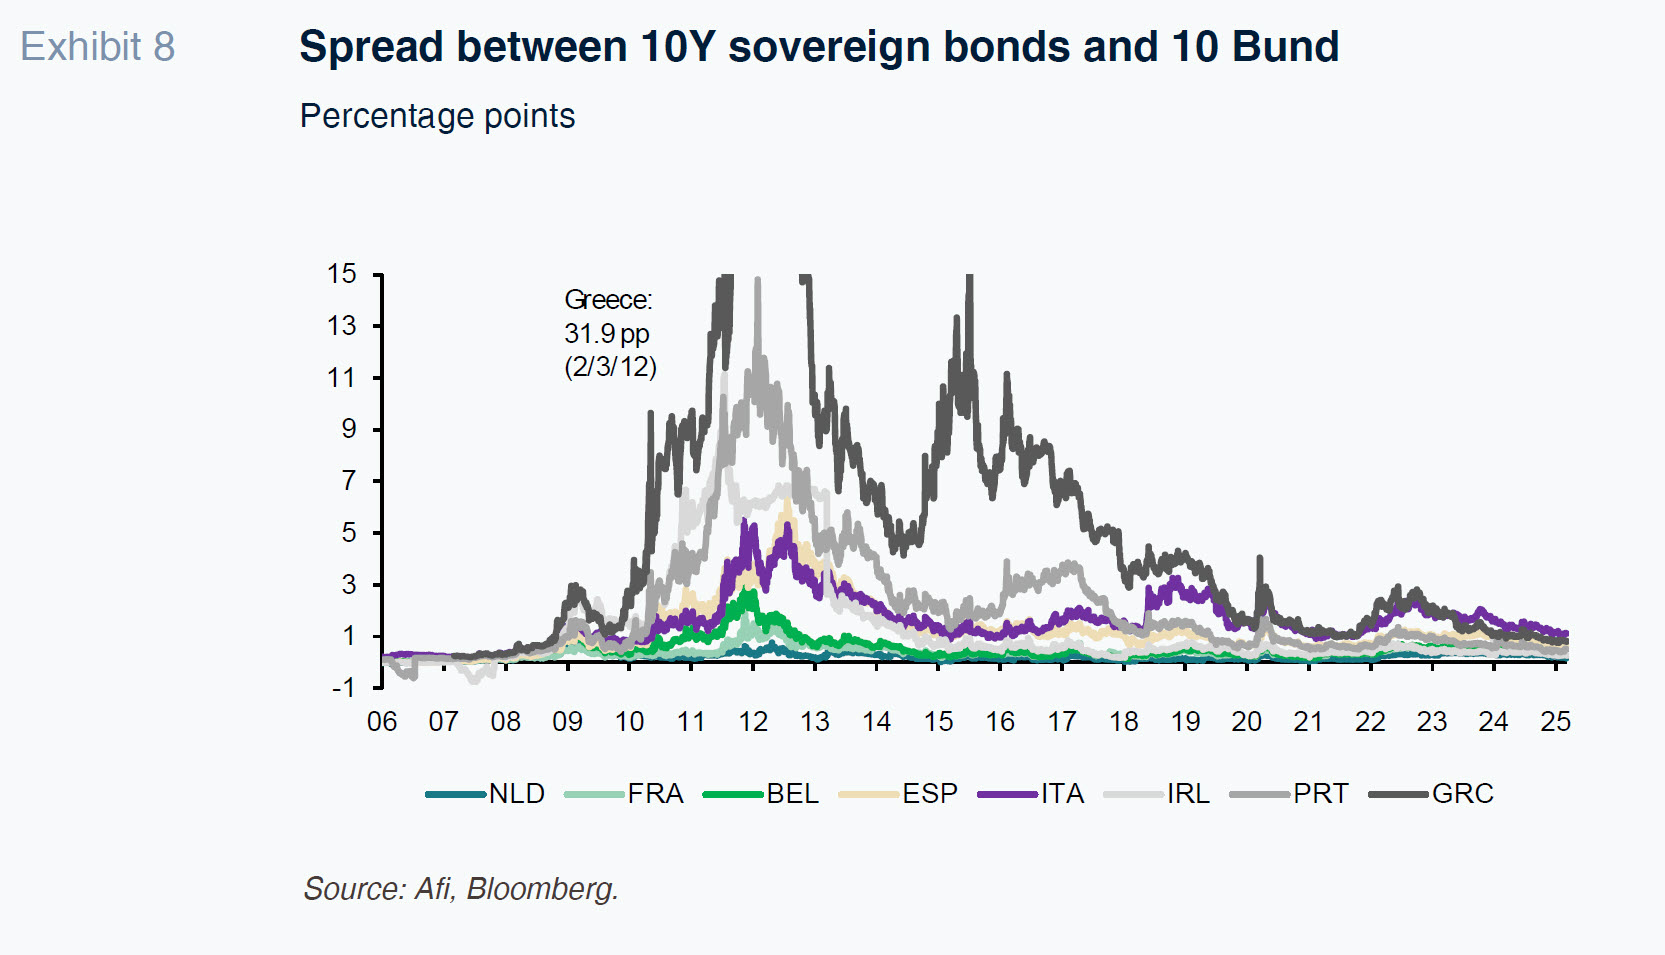
The second variable that reflects the relative recovery in investment flows towards the periphery (the four peripheral economies plus Ireland) is the trend in the stock of sovereign debt held by non-resident investors. To illustrate this phenomenon we map the gap between the shares of non-resident holdings for the periphery versus Germany. This shows that following a sharp relative reduction in the presence of non-resident investors (banks and non-bank investors) in 2008-2013, these holdings rebounded intensely until 2020, in parallel with recovering confidence in these economies, also borne out in the gradual normalisation in their sovereign debt yields relative to German yields (sovereign risk premiums). The stabilisation and even slight widening in the gap observed from 2020 should not be interpreted in a negative light as it is the direct consequence of the massive debt purchase programmes rolled out by the ECB in the wake of the pandemic. Moreover, despite a narrowing in the relative gap in the non-bank, non-resident investor segment, the consistent recovery in relative appetite for periphery debt among non-resident bank investors is proof of the solidity of the recovery in investor flows into this group of economies’ sovereign bonds.
Conclusions
The sovereign debt crisis in the EMU (2010-2012) took a particularly heavy toll on peripheral Europe where the combination of high deficits, high debt and macroeconomic imbalances had heightened their exposure to the effects of the Great Financial Crisis of 2008. The financial bailouts and strict austerity measures imposed by the EMU paved the way for restoration of economic stability and greater financial discipline in the eurozone, while the structural reforms implemented by the peripheral economies lifted their competitiveness and helped reduce the growth gap with the core European economies.
In recent years, the periphery states have posted more dynamic growth than their core European peers, fuelled by both structural and cyclical drivers. The recovery in investor appetite has reduced risk premiums and bolstered confidence in the peripheral economies’ fiscal sustainability. Going forward, economic convergence within the eurozone will depend on these countries’ ability to consolidate their structural advances, lift their productivity and their exposure to the trend in the global economy.
Notes
The OECD’s competitiveness indicator based on relative prices and relative labour costs is used to assess the competitiveness of countries relative to others:
The price competitiveness indicator is calculated based on relative changes in CPI. This component compares the prices of the goods and services of one country with those of other countries. It is used to measure how changes in domestic prices affect international competitiveness. An increase in relative prices may indicate a loss of competitiveness by making a country’s products more expensive relative to those of other countries.
The relative unit labour costs (ULC) indicator compares the labour costs of one country with those of other countries. ULCs are calculated by dividing total labour costs by total output. An increase in relative labour costs may indicate a loss of competitiveness by making a country’s products more expensive to produce relative to those of other countries.
To derive this component, we use the potential output estimates compiled by the European Commission for all of the countries analysed. Potential output is the maximum growth in output an economy can sustain in the long term without generating inflationary pressures. It is calculated using economic models that consider the supply of labour and capital and total factor productivity, among other inputs.
The output gap. This is the difference between real and potential output. A positive output gap indicates that the economy is growing faster than it can grow sustainably (a growth cycle), while a negative output gap indicates the opposite (recession). It therefore captures the effect of the cycle on an economy’s GDP growth.
José Manuel Amor, Camila Figueroa and María Romero. Afi