
Spanish economic activity by institutional sector: Divergent growth since the creation of the euro
The evolution of Spain’s institutional sectors since the creation of the euro reveals significant disparities in output and capital investment. The non-financial corporate sector has driven most of the economic activity, while the current output of households barely reaches maximum 2005 levels and the fall in real corporate fixed capital since the pandemic raises concerns about long-term growth potential.
Abstract: Spain’s institutional sectors have shown divergent growth patterns over the last 25 years, coinciding with the euro’s introduction. Non-financial corporations (NFCs) have remained the largest contributors to gross value added (GVA), employment, and investment, despite setbacks from the 2008 financial crisis and the COVID-19 pandemic. By contrast, the household sector has experienced persistent underperformance, with output in 2024 still 20% below its potential had it consistently grown at a rate of 2% per year. Meanwhile, public sector investment has frequently trailed capital consumption, particularly during austerity periods. While recent improvements in gross fixed capital formation (GFCF) have occurred in the public sector, current net capital investment in the NFC sector is less than one-third of its 2000 value. The lagging recovery in the capital formation of NFCs in the post-pandemic era raises concerns about the dynamics of growth in productive capacity of the Spanish corporate sector.
Foreword
2024 marked the end of the first quarter of the twenty-first century. This paper graphically illustrates the trend in activity in the institutional sectors of the Spanish economy – non-financial corporations, financial corporations, households and NPISH (a sector which includes the self-employed and individuals who produce goods and non-financial services for their own final use) and government – for the first twenty-five years of this century. The institutional sectors provide insight into the economy’s performance by looking at the behaviour of the main private sector agents, government, investors and financiers, individuals and corporations. Although it is less common to disaggregate economic activity into its institutional sectors than its productive sectors (agriculture, manufacturing and services), we think it is just as important as it places the focus on the results of the decisions of economic agents with different interests.
Economic activity is analysed using four variables – output (measured by gross value added or GVA), employment and gross and net fixed capital formation (indexing all of the monetary variables to 2000). The non-financial corporation (NFC) sector is the biggest contributor to the Spanish economy across all four variables (accounting for around 60% of GVA and FCF and two-thirds of salaried employment). The smallest contribution is made by the financial corporations (FC), which made their highest contribution to GVA in 2007, at 6%. The household and NPISH sector (hereinafter, abbreviated to household), which includes the contribution made by the self-employed, is the second biggest contributor, representing approximately one quarter of GVA and investment. Government rounds out the analysis, ranking second, ahead of the household sector (8.5%) in terms of its contribution to salaried employment, at 23%. The percentages vary over time, with the contribution by the household sector yielding share to the NFC sector.
The rest of the paper details the trend over in time for each activity variable in comparison with the other sectors and for the overall economy.
Output
Exhibit 1 shows the trend in estimated output for each institutional sector between 2000 and 2024 (third quarter), using GVA for each sector, deflated by the corresponding price index, to measure output.
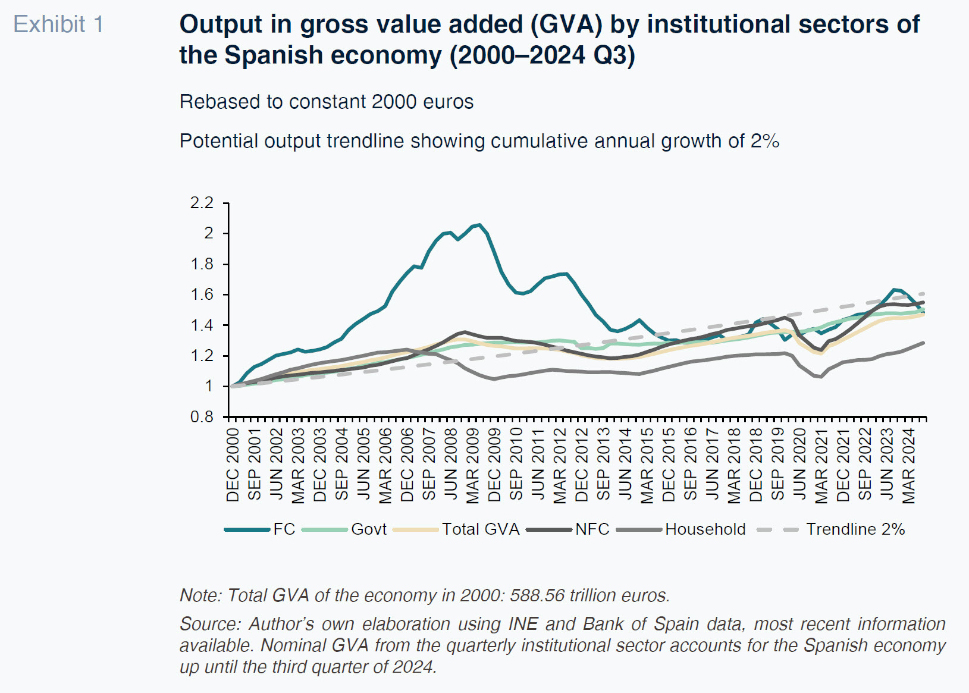
In the first few years of the twenty-first century, and of the euro, annual growth in each institutional sector easily topped 2%. The disproportionate increase in financial corporation output stands out, doubling in seven years in which economic output for the whole economy increased by 20%. The household sector registered the second highest growth rate in the early years of the century but was the first to see that growth truncated two years before the financial crisis of 2008. The impact of the financial and debt crises and the scars left in their aftermath differed from one sector to the next. Output contracted sharply in the FC sector, a circumstance that continued until 2015; government output was remarkably stable, remaining at 2009 levels for the next 10 years (dropping in 2012 and 2013); and household output contracted quickly but recovered slowly (not revisiting 2006 levels until 13 years later, in 2019).
The financial crisis interrupted years of accelerated growth in NFC output, causing the sector’s activity to contract to 2005 levels between 2008 and 2014. Recovery began in 2015, and by 2019, output had surpassed the pre-crisis peak by more than 10%. However, the COVID-19 pandemic triggered a new, sharp contraction in NFC and household output, while output in the FC and government sectors remained stable and even increased during the health crisis. By the end of 2024, output from all the institutional investors was well above 2019 levels.
Exhibit 1 also depicts the trend in total normalised GVA of the economy in constant euros, alongside the output growth trendline at a constant cumulative annual rate of 2%. Until 2012, output in all sectors except for the household sector trended above the trendline; from 2012 on, only the FC sector, coinciding with the last period of rate increases, peaked, occasionally, above the trendline. NFC output almost hit the trendline in 2019 but the pandemic ushered in a new correction. With the exception of the FC sector, in 2024, the other institutional sectors grew in line with the 2% trendline but their output was lower than it would have been had it kept up with potential output throughout: 4% lower in the case of the NFCs, 20% in the case of the household sector and 7.5% for the overall economy.
Salaried employment
The labour used in production is measured using the compensation of employees for each institutional sector in constant 2000 euros, factoring in the trend in unit labour costs; Exhibit 2.
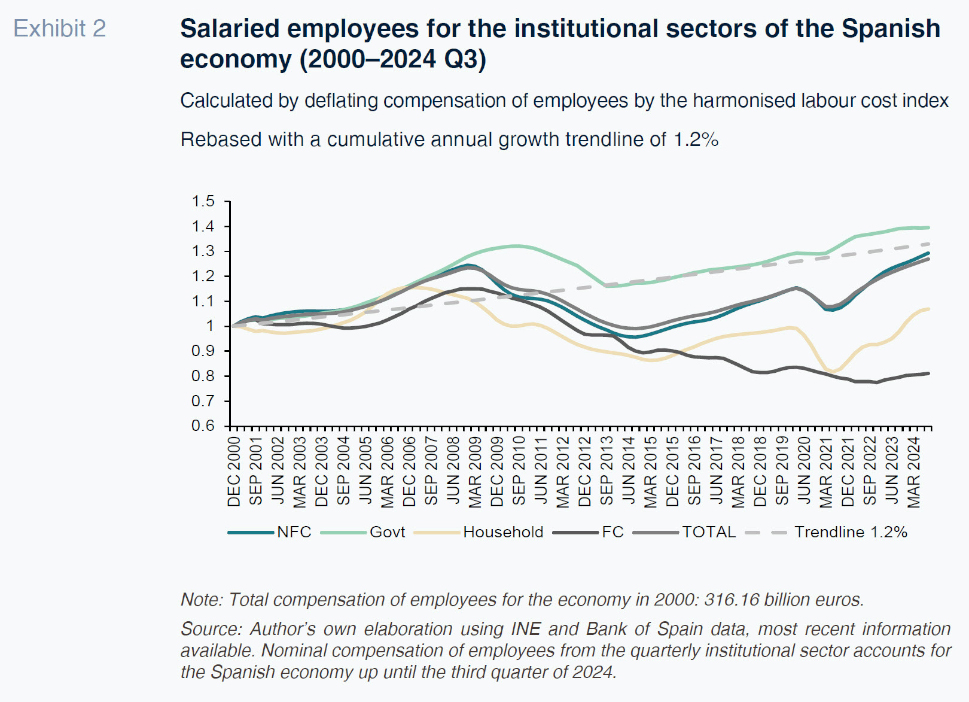
The patterns depicted by the trend over time in salaried work in the different sectors are similar to those observed in Exhibit 1 tracing out the trend in output, except for the financial corporations, for which output (deflated GVA) and salaried employment etch out diverging paths. Until the financial crisis of 2008, all of the sectors managed to find themselves at some point above the cumulative annual growth of 1.2% trendline. After the crisis, only government stayed above or close to the trendline. Salaried employment in the public sector registered the strongest growth prior to the financial crisis, peaking at 32% above 2000 levels in September 2010, compared to the peak in total salaried employees by comparison with 2000 of 23.3% in 2008. The loss of salaried employment between 2009 and 2014 affected all sectors, albeit hurting the government sector less (-16 percentage points between 2010 and 2013), whereas the NFC sector went from an index reading of 1.23 in December 2008 to 0.95 in December 2014. Between 2008 and 2024, the FC sector lost one-third of its salaried employment.
All the institutional sectors except the FC sector increased salaried employment during the recovery embarked on from 2015, albeit punctuated by the loss of work induced by the COVID-19 pandemic. In September 2024, salaried employment in the NFC sector hit a high for the entire period, 30% above 2000 levels and closing in on the level it would have reached according to the cumulative annual growth trendline of 1.2%. [1] In 2024, the government sector also reached record employment levels, 40% above the 2000 benchmark, while salaried employment in the household and NPISH sector, at just 7% above 2000 levels, remains below the peak marked in 2006. Comparing the output levels in Exhibit 1 with the salaried employment figures in Exhibit 2 tells us that by September 2024, the growth in output between 2000 and 2024 exceeded the growth in salaried employment, with that difference most pronounced in the FC sector. For the economy as a whole, in 2024, output was 47% above 2000 levels, compared to cumulative growth in salaried employment of 27%. [2]
Fixed capital formation
The proxies used to measure investment by the institutional sectors of the Spanish economy are gross fixed capital formation (GFCF), in constant euros, and net fixed capital formation (NFCF), which is GFCF less capital consumption, similarly indexed to 2000. The FCs are excluded from the investment analysis due to the volatility displayed during the period analysed, which is hard to rationalise economically. The values, indexed as with the output and employment readings, are provided in Exhibits 3 and 4.
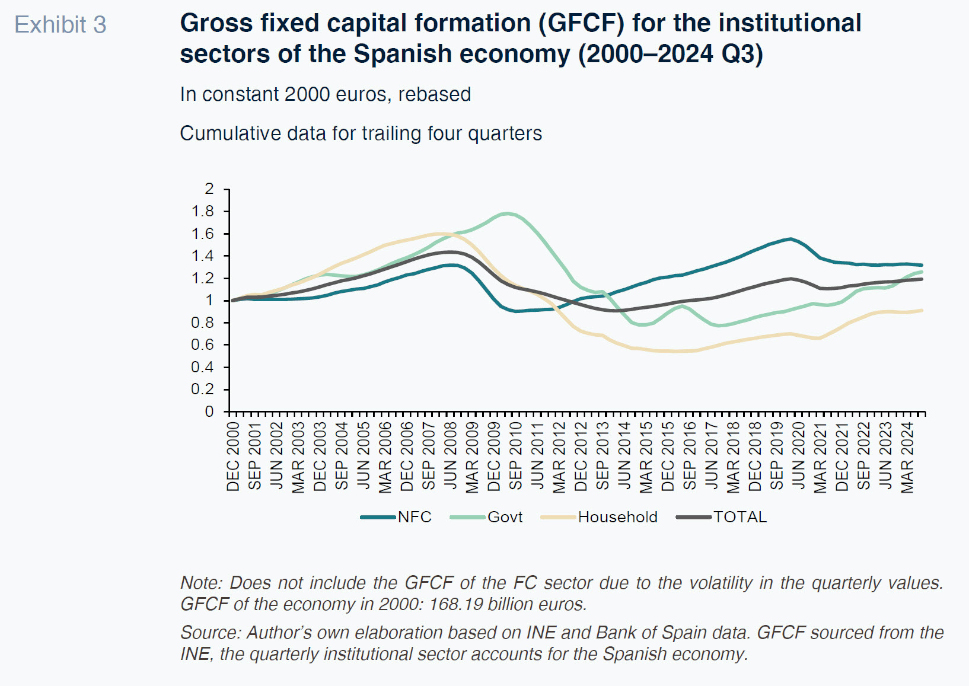
The dynamics in fixed capital investment flows during the period analysed reveal patterns that are consistent with the economic activity dynamics gleaned from the output and salaried employment trends: expansion until 2008, a severe contraction of varying duration and uneven impact depending on the sector and subsequent recovery, similarly truncated, again unevenly, by the pandemic. In terms of GFCF, the highest volatility in flows is observed in the government and household sectors. For example, GFCF in the government (household) sector increased as much as 80% (60%) above 2000 levels during the years of expansion and fell as much as 22% (45%) below 2000 levels during the recessionary years. In the NFC sector, GFCF in 2007 stood 31% above 2000 levels and by 2009 was 9.5% below that yardstick.
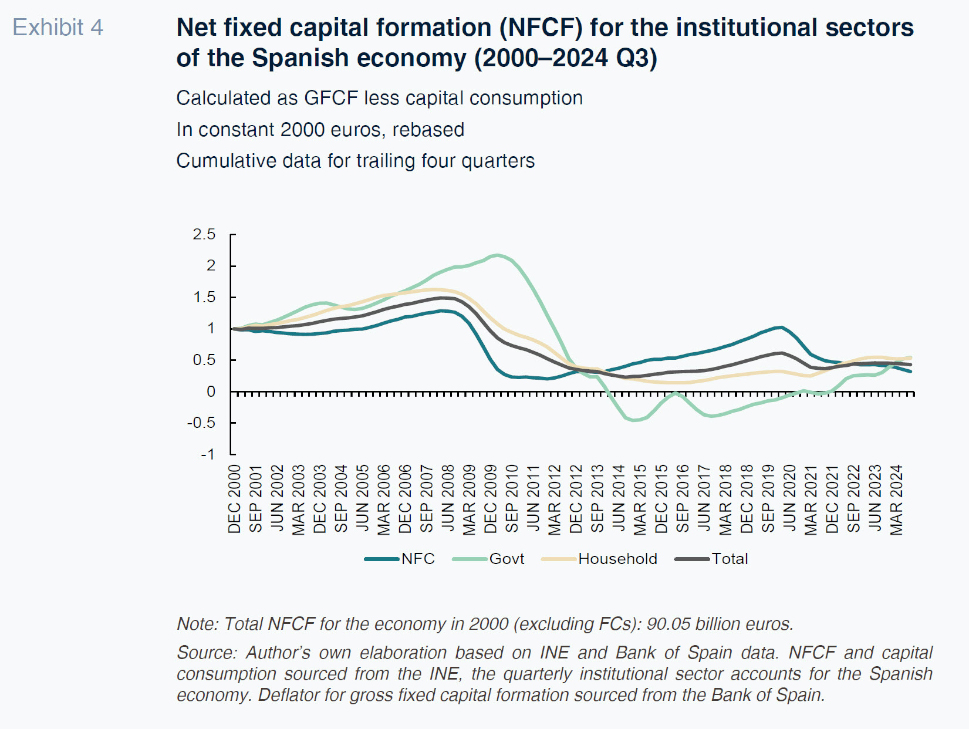
GFCF recovered faster and more intensely in the NFC sector. When the pandemic came along to interrupt that growth, the NFC sector’s GFCF was 55% above 2000 levels, well above the cumulative growth of 31% recorded during the previous growth cycle. In the household and government sectors, GFCF in 2019 was, respectively, 30% and 10% below 2000 levels and well below the highs of 2008. After the pandemic the situation changed. GFCF in the NFC sector contracted, albeit by less than in the household sector, whereas GFCF in the government sector barely suffered. During the subsequent general economic recovery, between 2021 and 2024, NFC’s GFCF has been decreasing at constant values and in 2024 was 15% lower than in 2019. For households and especially government, gross investment has recovered and by September 2024, GFCF in the government sector was 26% above 2000 levels. Net fixed capital formation – gross capital less capital consumption – depicts similar trends but also reveals some noteworthy differences with respect to gross investment. As shown in Exhibit 4, in the run-up to the crisis of 2008, net investment flows increased year after year, indicating that the economy was adding net new productive capacity, albeit with somewhat of a lag in the NFC sector. Net investment contracted across all sectors during the recession years up to 2014, but the recovery that followed was uneven. The government sector presented negative net investment figures between 2014 and 2021, indicating that the stock of public capital shrank from existing levels during that period (new gross investment was insufficient to replenish the capital consumed or depreciated). During the pandemic, NFCF in the government sector was virtually nil; despite the recovery staged during the last three years, coinciding with the NGEU programmes, investment in 2024 was half that of 2000 and one-third of the peak of 2008. In the household sector the recovery got underway in 2016 from a low of 14% of 2000 levels, reaching half of that yardstick by 2024.
The comparison between gross and net investment in the NFC sector (Exhibits 3 and 4) shows that from the financial crisis of 2008 onwards, net investment increased by far less than gross investment. This is due to relatively higher growth in capital consumption than in gross investment during that period. The relatively higher growth in capital consumption recorded in the national accounts is attributable to a change in the composition of the stock of NFC assets, from assets with longer useful lives to assets with shorter useful lives, e.g., more equipment and R&D and less real estate and fewer productive structures from 2008 on. An important observation from the NFCF readings is the persistent decline in net investment since the pandemic. Indeed, using the most favourable estimate, in 2024, NFCF was at less than one-third of the sector’s 2000 NFCF value. [3]
Conclusions
One key takeaway from this analysis of economic activity in the twenty-five years since the creation of the euro is the volatility observed in all of the indicators selected and all of the institutional sectors of the economy. This volatility has had adverse consequences for the average trend in growth for the economy as a whole during the period analysed. According to our estimates, the GVA of the Spanish economy in 2024, in constant 2000 euros, was close to but lower than the level of GVA in constant euros the economy should have attained had it grown consistently at an annual rate of 2%. By sector, in 2024, the NFCs were close to the economy’s potential output, but the household sector was far below that threshold, so that it is dragging on overall growth. As for the level of labour used in production, the estimated cumulative annual growth rate is approximately 1.2% for the entire economy. Consequently, given the 2% cumulative output growth rate, the estimated cumulative annual growth of apparent labour productivity is 0.8%, although, once again, there is high volatility over time and significant differences between sectors. [4]
The accumulation of productive capital has also varied greatly in intensity in different subperiods for a given sector and among sectors for a given subperiod. The economy as a whole and the various institutional sectors invested significantly in capital until 2008. The financial crisis that year affected investing intensity, differently from one sector to the next. For example, in the government sector, gross investment trailed capital consumption for several years, eroding the economy’s stock of public fixed capital. Two additional points worth highlighting: (i) the increase in annual capital consumption in the NFC sector relative to gross investment from 2009 on (interpreted as a change in the composition of the stock of fixed assets, marked by a shift towards assets with shorter productive lives); and (ii) the significant reduction in the annual flow of gross capital investment in this same sector in the post-pandemic era.
Notes
The growth trendline of 1.2% was selected considering the annual growth trendline for labour productivity estimated for the Spanish economy for that period of 0.8% (Bock et al., 2024): output growth of 2% less growth of 0.8% in labour productivity.
We verified that the trend in salaried employment gleaned from Exhibit 2 is consistent with the salaried employment figures published in the Labour Force Survey adjusted for the change in the number of hours worked, which declined throughout the entire period. Elsewhere, according to the LFS, the number of self-employed workers in 2024, which are not included in the salaried employees calculated in Exhibit 2, is virtually unchanged by comparison with the beginning of the century.
Salas Fumás (2024a, 2024b and 2024c) provides more detailed analysis by way of explanation of the investment behaviour of the NFCs in the post-pandemic period.
It is important to stress the sizeable growth in labour productivity in the financial corporation sector this period, helped by bank sector consolidation and the substitution of bricks-and-mortar banking with online banking.
References
BOCK, S., ELEWA, A., GUILLOU, S., NAPOLETANO, M., NESTA, L., ALIES, E., TRREIBICH, T. (2024). Documenting the widening transatlantic gap.
OFCE. Policy Brief, 129, May.
https://www.ofce.sciences-po.fr/pdf/pbrief/2024/OFCEpbrief129.pdfSALAS FUMÁS, V. (2021).
La Empresa Española: Del euro a la COVID19 [The Spanish Corporate. From the euro to COVID-19] Zaragoza: Zaragoza University Press.
SALAS FUMÁS, V. (2024a).
Fixed capital formation in the non-financial corporate sector of the Spanish economy: Crisis, recovery and prospects. Technical Note 3/2024. Madrid: Funcas.
https://www.funcas.es/documentos_trabajo/fixedcapital-formation-in-the-non-financial-corporate-sector-of-the-spanish-economy-crisis-recovery-and-prospects/SALAS-FUMÁS, V. (2024b). Capitalisation of Spanish corporations since the financial crisis.
Spanish Economic and Financial Outlook, Vol. 13, No. 3.
https://www.funcas.es/articulos/la-capitalizacion-de-la-empresa-espanola-desde-la-crisis-financiera/SALAS FUMÁS, V. (2024c). Las condiciones financieras para la recuperación de la inversión empresarial en España en la pospandemia [Financial conditions for a recovery in corporate investment in Spain in the wake of the pandemic].
Economic Bulletin of the ICE, (3174-3175).
https://doi.org/10.32796/bice.2024.3174-3175.7843
Vicente Salas Fumás. Professor Emeritus at Zaragoza University and Funcas