
Estimating the impact of inflation on Spain’s tax burden: The hidden effects of fiscal drag
Inflation has increased Spain’s tax burden by eroding the real value of tax allowances and pushing taxpayers into higher brackets. The lack of systematic indexation has disproportionately impacted middle-income earners, raising questions about the fairness and sustainability of current fiscal policy.
Abstract: Spain’s tax system has been heavily impacted by inflation, which has increased the tax burden by pushing taxpayers into higher brackets and eroding the real value of allowances and deductions. Indeed, the increase in tax bills was an estimated 311 euros for low-income taxpayers, 458 euros for middle-income taxpayers, and 622 euros for high-income taxpayers, with bracket creep alone increasing middle-income taxpayer bills by a further 225 to 450 euros. While targeted relief measures have been introduced, such as higher deductions for low-income earners, these adjustments are insufficient to address the broader issue. The persistence of fiscal drag poses risks to economic growth and equity, highlighting the need for a transparent and consistent policy approach to prevent unfair increases in the tax burden.
The issue
The impact of inflation on personal income tax revenue is a recurring topic of debate. Interest in this issue has increased in the wake of the pandemic due to steep consumer price inflation (CPI), which between 2021 and 2024 amounted to 3.1%, 8.4%, 3.5% and 2.8%. In sum, a cumulative increase in consumer prices of 17.8% which has fuelled growth in income tax receipts via three interconnected routes. Firstly, via application to taxpayers’ income in monetary terms rather than real terms. This happens even when all of their income falls into the same income tax rate bracket. Secondly, by pushing some taxpayers to pay personal income tax at higher marginal rates on a portion of their earnings (bracket creep). Thirdly, by eroding the nominal value of tax exemptions or minimum thresholds expressed in euros. The fiscal drag problem is not only relevant during periods of sharp inflation such as the recent episode. During periods of low inflation, it is also an issue on account of its cumulative effect. For example, annual inflation averaged just 1.1% between 2009 and 2019 but the cumulative impact was 12%.
Failing to index personal income tax is equivalent to a hidden tax increase that does not have to go through parliament. In this scenario, inflation acts as a silent tax whose effect is uneven and not fully observable for tax payers. That may be behind the fact that tax increases are not among Spanish households’ chief concerns (CIS, 2025). As a result, their political costs are, generally, lower than overt tax reforms that lead to explicit increases in taxation. In general, the same can be said of tax “dabbling”, where governments tinker with small changes in taxation. Non-indexation has positive impacts on tax receipts. Indeed, in the absence of any targeted tax reforms, Spain’s convergence with the EU average for public revenue-to-GDP in the wake of the pandemic has been helped by rampant inflation. That in turn has allowed Spain to raise its ratio of public expenditure-to-GDP to above the EU average (Romero-Jordán, 2024).
[1] However, the effects of fiscal drag go beyond revenue considerations. In fact, it has pernicious effects on the incentive to work or income distribution that get a lot less attention in the public debate than they deserve (Kis
et al., 2024).
The impact of fiscal drag on tax revenue is proving particularly intense in Spain. Balladares and García-Miralles (2024) estimate that half of the increase in personal income tax receipts in Spain between 2019 and 2023 is attributable to inflation,
[2] in other words, 16.7 billion euros of the growth of 33.4 billion euros in personal income tax revenue during that period (AEAT, 2024). By their analysis, 58% of this impact is the result of not indexing the various tax benefits to inflation (9.7 billion euros), with the remaining 42% derived from bracket creep (7 billion euros). This translates into an average increase in tax bills of 725 euros on the basis of the approximately 23 million tax returns filed in 2023. Separately, AIReF (2024) has estimated that non-indexation will lift tax revenue for the next seven years of the current tax plan for 2025-2031 by 12.6 billion euros.
The most effective and transparent way to address fiscal drag is to regularly and automatically index tax. Indexing both tax bands and personal income tax allowances. However, this is not common practice in the EU. Just a few countries – Austria, Belgium, France, Lithuania, Netherlands and Sweden– index their tax bands systematically (Bukowski et al., 2023). Around half of the OECD member states (2023) make discretionary adjustments to the various personal income tax parameters. Spain has no standardised adjustment procedure, only a partial and discretionary one. For example, the individual and household minimum thresholds have not been adjusted since 2015. Since 2025, however, cumulative inflation stands at 21.2%. To illustrate, the value of the general allowance per taxpayer set at 5,550 euros since 2015 would be 6,715.50 euros in 2024 if it had been adjusted for inflation.
In recent years, the government has ruled out indexing personal income tax arguing that it would also benefit higher earners. It has focused its strategy on increasing income tax relief for earners with pre-tax annual salaries of between 15,000 and 21,000 euros. It also increased the threshold for becoming liable to pay personal income tax from 14,000 to 15,000 euros (Romero-Jordán, 2022). In contrast, most of the regional governments, including the Basque and Navarre governments which have their own taxation systems, made different discretionary adjustments between 2022 and 2024 (General Council of Economists, 2022, 2023 and 2024).
By how much should personal income tax have been indexed?
Inflation does not affect all taxpayers equally. The consumer price index estimated by Spain’s statistics office, the INE, is an aggregate index that provides information about the average level of inflation in the economy. However, households face different levels of inflation depending on the composition of their spending and the trend in the market prices of the products they buy. In other words, each household has its own CPI, which for simplicity we term the HCPI. Using the methodology devised by Romero-Jordán (2023a), Table 1 provides the inflation borne by households between 2021 and 2024 for different levels of expenditure. The calculations use the microdata provided in the Household Budget Survey (HBS) published by the INE.
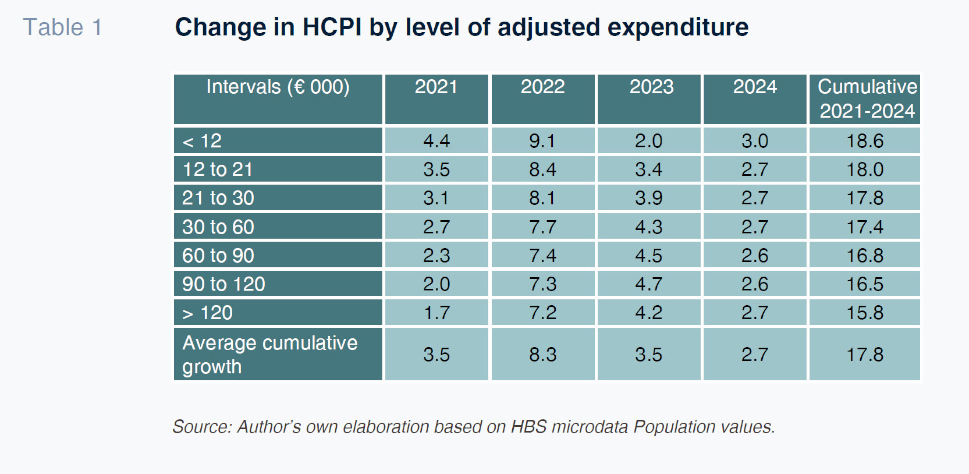
As shown in Table 1, the average cumulative growth in inflation for all households was 17.8%. However, that growth is not even but rather decreases as spending levels increase. Lower income households, which spend less than 12,000 euros per annum, bore cumulative inflation of 18.6%. At the other end of the spectrum, inflation was 15.8% for households spending more than 120,000 euros per annum. The reason for these differences lies with the fact that the lower income households spend relatively more on food and energy products, the most inflationary categories in 2021 and 2022. Energy prices also rebounded in 2024 when the various tax breaks were removed. As a result, the timing and rate of indexation affect who stands to benefit more or less from the adjustments. For example, in relative terms, the first two income brackets would lose out if the adjustment were made in 2024 on the basis of the CPI accumulated until that year (17.8%). In both of those income bands, HCPI is higher than CPI. [3]
What the results tell us
This section provides a comparative static simulation of the impact on tax revenue of not indexing the main personal income tax allowances: minimum individual and household thresholds and the joint return deduction. To do that, we use the personal income tax taxpayer statistics for 2022 published by the tax authority, which are the most recent figures available (AEAT, 2023). The results by year and income bracket are presented in Table 2. In cumulative terms, the impact on tax revenue sums to 9.75 billion for the four years analysed (around 10.3 billion euros compounded to 2024). This figure is in line with that estimated by Balladares and García-Miralles (2024) for 2019-2023. AIReF (2024) has estimated the increase in total revenue attributable to inflation in 2024 at 3.4 billion euros. As shown in Table 2, that figure is compatible with the 1.61 billion euros estimated for 2024 in our simulation.
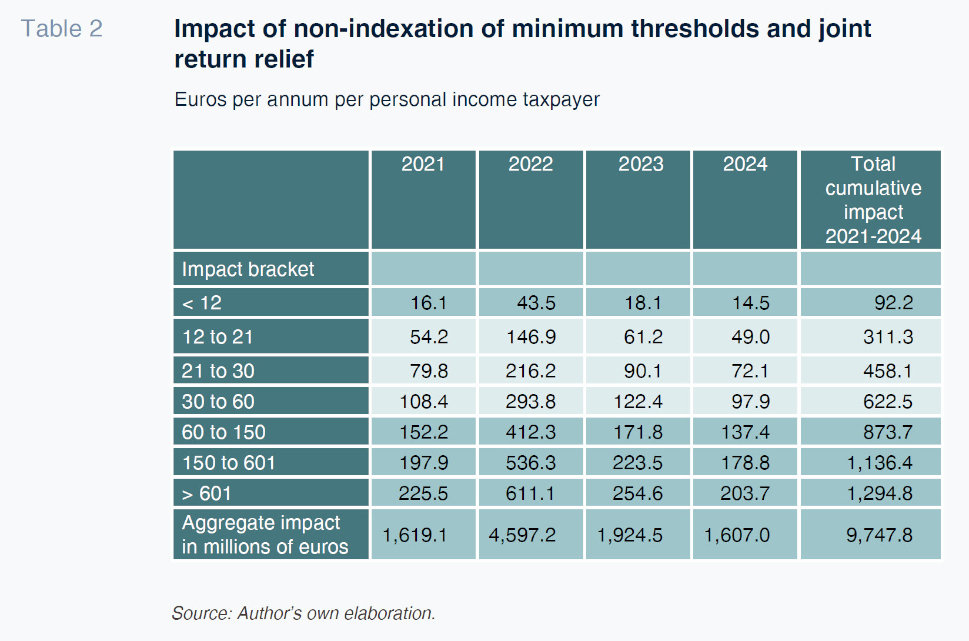
Of the four years analysed, the biggest impact on tax receipts occurred in 2022 (4.6 billion euros), which is when post-pandemic inflation peaked. That figure is 47% of the cumulative inflation-induced increase in tax revenue in the period analysed. By income bracket, the cumulative impact increases in tandem with the income bands. It ranges from 92 euros for taxpayers with annual taxable income of under 12,000 euros to 1,294 euros for those earning more than 600,000 euros. Average taxable income in 2022 was 23,600 euros, so falling into the 21,000 – 30,000 euro bracket. Taxpayers in this income bracket bore an extra 458 euros in their tax bills.
The range of annual taxable income for middle-income households (defined by the OECD as households earning between 75% and 200% of the median national income) goes from 17,700 to 47,200 euros. In this broader interval, the 12,000 – 21,000 euros income bracket corresponds to low-middle income earners and the 30,000 to 60,000 euros bracket to middle-high earners. As shown in Table 2, the average impact per taxpayer during the period analysed was 311 euros in the low-income bracket, 458 euros in the middle-income bracket and 622 euros in the middle-high income bracket. Following Balladares and García Miralles (2024), it is possible to infer that the failure to adjust tax rates for inflation adds a further 225 to 450 euros to the tax bills of middle-income earners.
Middle-income taxpayers account for 59.7% of the returns presented and 57.8% of the income tax collected. And they bore 61.3% of the increase in tax revenue attributable to inflation. It is fair to say, therefore, that the middle class were the big losers in this scenario of non-indexation. The scale of the problem increases when we layer in the impact of VAT. Based on the calculations of Romero-Jordán (2025), the cumulative increase in the VAT tax bill plus the impact of non-indexation of personal income tax for middle-income households was approximately 1,100 euros during the period analysed.
Notes
Due to sharp growth in public consumption, which by Funcas’ estimates explains around two-thirds of the cumulative growth in GDP since 2019.
Depending on the indexation methodology applied.
Assuming annual indexation, the same groups would have lost out or benefitted in 2021, 2022 and 2024. In 2023, indexation at 2.7% would have benefitted the lowest income households in particular.
References
AEAT. (2023). Personal income taxpayer statistics. Statistics for 2022.
https://sede.agenciatributaria.gob.es/Sede/en_gb/datosabiertos/catalogo/hacienda/
Estadistica_de_los_declarantes_del_IRPF.shtmlAEAT. (2024). Monthly tax collection reports.
https://sede.agenciatributaria.gob.es/Sede/en_gb/datosabiertos/catalogo/hacienda/
Informe_mensual_de_Recaudacion_Tributaria.shtmlAIREF. (2024). Report on the Medium-Term Fiscal-Structural Plan 2025 – 2028. Report 51/24.
BALLADARES, S. & GARCÍA-MIRALLES, E. (2024). Fiscal Drag: The Heterogeneous Impact of Inflation on Personal Income Tax Revenue.
Occasional Papers, No. 2422. Bank of Spain.
BAŃKOWSKI, K., CHECHERITA-WESTPHAL, C. D., JESIONEK, J., AND MUGGENTHALER, P. (2023). The effects of high inflation on public finances in the euro area. Based on the analysis by the Eurosystem members of the Working Group on Public Finance.
Occasional Papers, 332. European Central Bank.
CIS. (2025). Barometer, January 2025 Study No. 3492.
CONSEJO GENERAL DE ECONOMISTAS. (2022).
Panorámica de la fiscalidad autonómica y foral 2022 [Regional taxation panorama, 2022].
CONSEJO GENERAL DE ECONOMISTAS. (2023).
Panorámica de la fiscalidad autonómica y foral 2023 [Regional taxation panorama, 2022].
CONSEJO GENERAL DE ECONOMISTAS. (2024).
Panorámica de la fiscalidad autonómica y foral 2024 [Regional taxation panorama, 2022].
EUROPEAN COMMISSION. (2024). Growth-Friendly Taxation in a High-Inflation Environment. Economic Brief, 079, March.
IGAE. (2024).
Impuestos y cotizaciones sociales de las Administraciones Públicas [Tax and social security statistics].
KISS, Á., LEODOLTER, A., TURRINI, A., & VÁNYOLÓS, I. (2024).
Growth-Friendly Taxation in a High-Inflation Environment (No. 079). Directorate General Economic and Financial Affairs (DG ECFIN), European Commission.
OECD. (2023). Indexation of labour taxation and benefits in OECD countries. In
Taxing Wages 2023: Indexation of Labour Taxation and Benefits in OECD Countries. OECD Publishing.
ROMERO-JORDÁN, D. (2022). An assessment of the main revenue and expenditure figures in the 2023 general state budget.
Spanish and International Economic and Financial Outlook, Vol. 11, No. 6.
https://www.funcas.es/wp-content/uploads/2022/11/Romero-11-6-1.pdf ROMERO-JORDÁN, D. (2024).
España acorta diferencias con el promedio de gastos e ingresos públicos (sobre PIB) de la UE-27 [Spain closes the gap with the EU-27 on public expenditure and income (over GDP)]. Funcas blog.
https://blog.funcas.es/espana-acorta-diferencias-con-el-promedio-de-gastos-e-ingresos-publicos-sobre-pib-de-la-ue-27/ ROMERO-JORDÁN, D. (2025).
Impacto de la inflación sobre la factura de IVA de los hogares españoles en el período 2021-2024 [Impact of inflation on Spanish households’ VAT bills 2021 - 2024]. Investigaciones de Funcas.
https://www.funcas.es/documentos_trabajo/impacto-de-la-inflacion-sobre-la-factura-de-iva-de-los-hogares-espanoles-en-el-periodo-2021-2024/
Desiderio Romero-Jordán. Rey Juan Carlos University and Funcas