Spain’s tourism sector: Exceeding expectations
The strong recovery of Spain’s tourism sector since 2014 has helped it to become a key driver of economic recovery and growth of the Spanish economy. Pursuing goals to attract the optimal type of tourism will help to ensure the sector’s profitability and sustainability into the future.
Abstract: Tourist arrivals into Spain exceeded 75 million (specifically, 75,579,522) in 2016, placing Spain in third position in the global ranking of tourist destinations, behind France and the United States. This is an exceptional outturn, consolidating the country’s position against its immediate rivals, but also representing robust growth in what is a well-established tourism destination. Tourism inflows have enabled the tourism sector to increase its weight in the Spanish economy, becoming a key element of the recovery since 2014 and regaining an impetus that had appeared to be dissipating. Nonetheless, tourism needs to be profitable and compatible with the sustainability of the destination and the living conditions of its residents. In this regard, the sector should aim to avoid going down the path of mass tourism and attracting tourists with very low average daily expenditures.
Tourist arrivals into Spain exceeded 75 million (specifically 75,579,522) in 2016, placing Spain in third position in the global ranking of tourist destinations, behind France and the United States (see Exhibit 1). This is an exceptional performance, consolidating Spain’s position in relation to its immediate rivals, but also representing robust growth for what is a well-established tourist destination. Tourism inflows have enabled the sector to increase its weight in the Spanish economy, becoming a key element of the recovery since 2014 and regaining an impetus that had appeared to be dissipating.
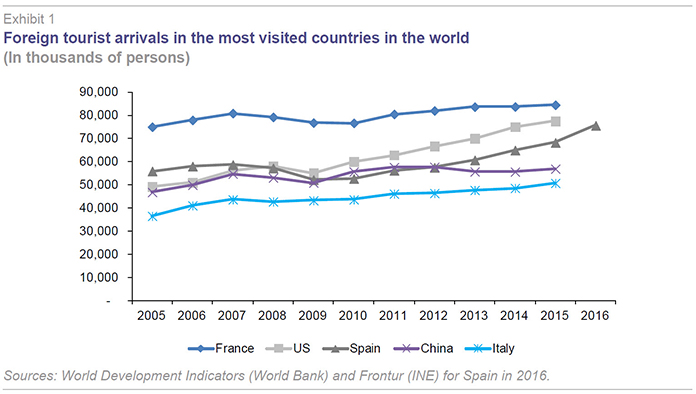
A few years ago, Spanish tourism had not been expected to reach such heights. For example, the World Tourism Organisation’s long-term forecasts to 2020, estimated that Spain would receive 73.9 million international tourist visits by 2020
[1]. In fact, Spain is the only country of the leading tourist destinations to have already surpassed its 2020 projections. France and the United States might be on track to reach their forecasts, but they still have to increase tourism inflows by 21.6 and 24.9 million, respectively, in five years. Meanwhile, China is a long way short of its projected 130 million visits in 2020, having received only 56.9 million tourists in 2015.
This article analyses developments in the Spanish tourism sector starting with the economic and political factors influencing the arrival of international tourists. The subsequent sections discuss data on source countries and tourist spending. The article then assesses the impact of tourism on the Spanish economy through GDP, balance of payments, employment and investment.
Finally, the last section summarises the main ideas and outstanding challenges to ensure the sector is both profitable and sustainable.
International positioning
The Spanish economy received 60 million tourist visits in 2007. At the time, it was considered to be an exceptional result given the country itself had 44.8 million inhabitants. However, the economic recession affected Spain’s major source markets (United Kingdom, Germany and France), curtailing this momentum, and 8 million fewer tourists visited in the following two years. But in 2010, the slowdown came to a halt as European source countries began to show signs of recovery. This performance is in line with widely documented evidence of tourism being a luxury good, in other words, it has an income elasticity of over one (Lim, 1997). In macroeconomic terms, this can be demonstrated using real income per capita in each country, making a disaggregation of tourists by their country of origin particularly interesting.
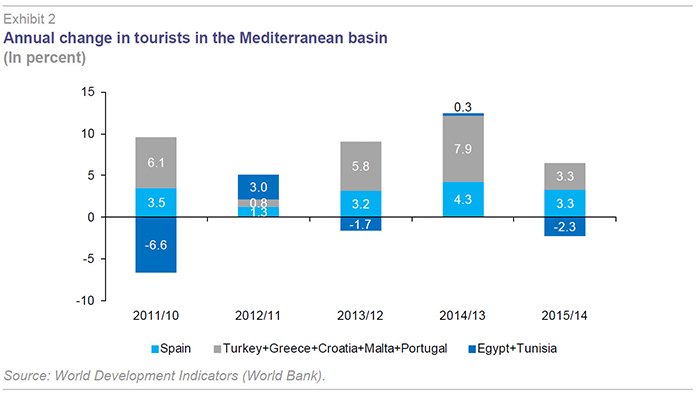
Furthermore, 2011 saw the emergence of a positive external factor. The “Arab Spring” and political instability in Mediterranean African countries, especially Tunisia and Egypt, led to large European tour operators relocating their tourists to more secure destinations, such as Croatia, Greece, Malta, Portugal, Turkey and Spain. The change in the number of tourists arriving in each of these areas since 2011 is show in Exhibit 2 and illustrates several points. Tourism fell sharply in Egypt and Tunisia in 2011, with both countries shedding 6.6 million tourists. The bulk of these tourists shifted to competing European markets. However, growth in recent years in these European countries is not exclusively explained by the Arab Spring effect, although it certainly helped to strengthen the recovery started in 2010. This idea is supported by the fact that these countries (Spain included) continued to see increases in international tourist arrivals, despite a stabilisation of inflows into Egypt and Tunisia. However, in 2015, tourist visits to North Africa declined once again following new terrorist attacks in Tunisia, leading to a renewal of substitution effects towards European sun and beach destinations.
The idea that the Arab Spring led to strong tourism growth in Spain in 2011, which then experienced a step change (“knock-on effect”), is also backed up by the fact that 2011 saw an increase in the proportion of tourists using a package trip in Spain for the first time on record. Package holidaymakers accounted for 47.4% of total tourists in 2002, falling to 29.7% in 2010. However, this figure rose to 30.7% in 2011 and 31% in 2012. The proportion fell back the following year and has since stabilised at around 29%.
Overall, the realignment of geopolitical conditions in the Mediterranean has led to the re-routing of some 7 million tourists each year, mainly distributed between Spain, Turkey and Croatia. The key questions are: What will happen to these “loaned” tourists when the political situation stabilises in North Africa and security becomes less of a concern? Will tourists return to those countries who offer a similar sun and beach product at lower prices? Clearly, Spain will be able to retain these tourists if it can differentiate itself in terms of quality, which goes beyond security. In this sense, the fact that – according to the 2015 World Economic Forum – Spain is a world leader for tourism and travel competitiveness is a clear sign of the strength of the Spanish tourism sector (Garín-Muñoz and Moral, 2016).
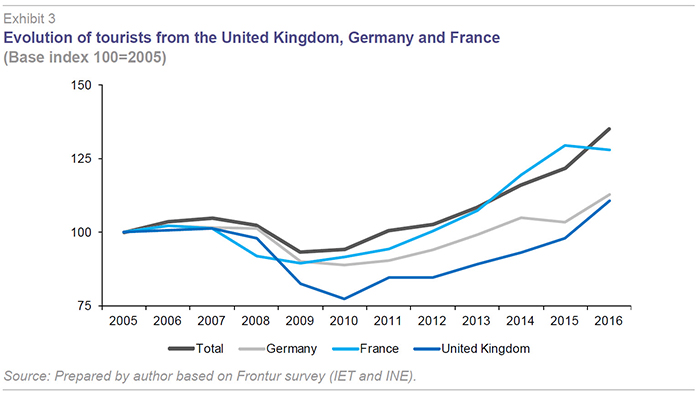
Tourism source countries: Established and new[2]The main source countries for tourists visiting Spain are, by order of magnitude, the United Kingdom, France and Germany, which together accounted for 53.5% of the total in 2016. Traditionally, German tourists have outnumbered French tourists, but this has reversed since 2014. While these three source markets remain highly important, growth from these countries has been more subdued than in other source markets for some time now (Exhibit 3 and Table 1), leading to a systematic decline in their overall share. For example, in 2000, these three countries accounted for 63.4% of foreign tourism into Spain.
Given the importance of these countries, it is interesting to take a closer look at possible explanations for such a weak performance.
Eurostat data provides information on the number of tourists in each country making foreign trips for personal reasons (leisure) lasting four or more nights. This could help determine whether this slow growth is due to a preference for other destinations or because they are travelling abroad less. Although it is not possible to identify the impact of the increase in short-trips, the analysis is useful for orientating policy measures to promote Spain as a “sun and beach” destination, given that this type of tourism accounts for the bulk of visits (in 2016, 79.1% of international tourists were in Spain for four or more nights).
Analysis of the data on trips made by residents in the United Kingdom (2005-2012), France (2005-2014) and Germany (2005-2015) shows that tourists from France did not alter their frequency of foreign trips despite the crisis, increasing such trips from 2013 onwards; meanwhile tourists from the UK and especially from Germany have reduced the number of trips they make abroad for four or more nights. This, therefore, partly explains the increased prominence of French tourists in the rankings of visitors to Spain, as well as slow growth in German and British tourists. Indeed, seen from this perspective, the arrival of British and German tourists can be interpreted in a more positive light given that numbers have held steady between 2005 and 2016.
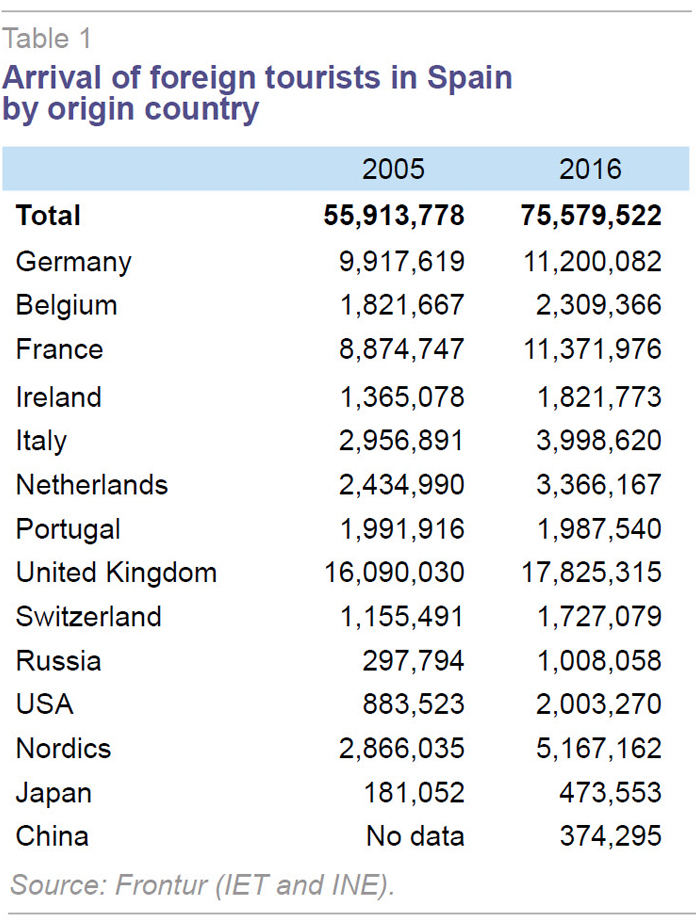
On the other extreme, some source countries have significantly increased their visits to Spain (see Table 1). Various groups of countries can be identified according to their weight in Spanish tourism a decade ago. Firstly, visitors from the Nordics and the United States already accounted for a substantial number of visits in 2005, and they have doubled their presence in 2016. Secondly, visits to Spain by tourists from Russia and Japan have tripled. Finally, it is worth highlighting China. In 2005, Spain was not among the permitted destinations for Chinese tourists, while in 2016 there were 374,295 Chinese tourist arrivals.
Tourist spending: The search for more profitable tourism
The other key variable for explaining tourist sector results is spending by tourist within Spain. In aggregate terms, spending has moved in line with growth in arrivals. However, the key for sustainability of tourism is the quality of tourism and not the quantity. Therefore, average daily spending and foreign tourists’ length of stay should be given greater emphasis than total spending.
Average daily tourism spending in Spain has also increased significantly from 88 euros in 2005 to 129 euros in 2016. However, it remains below spending by tourists in France and Italy and is very unevenly distributed depending on the country of origin, reason for travel or the destination within Spain. At the same time, there has been a reduction in the average duration of tourist trips from 9.7 days to 7.9 days. In fact, this trend towards more short duration trips is taking place across international travel due to the emergence of low cost airlines (who now bring in half of the tourists that enter Spain). Therefore, marketing and tourism policies should focus on increasing the average stay and daily spending, or identifying tourist segments and products that generate a higher daily spending. Therefore, analysing the segmentation of tourists according to their average spending offers relevant information, as noted below, for the situation in 2016
[3].
Japanese tourists lead the ranking
[4] with an average daily spend of 362 euros, followed by tourists from China who spend 275 euros, Americans who spend 231 euros and the Russians at 150 euros. However, it is also true that Japanese tourists stay less time in Spain (average of 6.8 days), while tourists from Russia, China and the United States stay 10.6, 9.4 and 8.3 days, respectively. These tourists favour urban tourism and shopping over the typical sun and beach-style holidays. Therefore, it seems clear that an effort should be made to attract these types of tourists and strengthen urban and shopping tourism. Barcelona
[5] and Madrid have been successful in exploiting their potential in this area and have attracted these types of tourists. The challenge is for other cities to jump on the bandwagon, boosting this profitable and high quality type of tourism.
By contrast, French tourists have a very low daily spending of 84 euros; in many cases, they stay on campsites, significantly reducing their profitability compared to the average. An effort should therefore be made to attract French tourists who prefer hotels and spend more, given they are now more numerous than German tourists and the latter have a relatively higher average daily spending (118 euros) and stay longer in Spain (8.4 days compared to 7.2 days for French tourists). Finally, it is worth highlighting the underwhelming performance of Portuguese tourists who due to their proximity stay only 4.4 days in Spain on average, although their average daily spending is 99 euros.
Impact of the tourism sector on the Spanish economy
Tourism is the sub-sector of the economy that contributes most to wealth and employment creation. The excellent results described above are crucial for the recovery and growth of the Spanish economy. This section describes
the direct and indirect effects of tourism on Spanish economic growth.
Contribution to GDP[6]Firstly, it is important to bear in mind that tourism in Spain is sustained not only by foreign tourists but also by domestic tourists. In fact, the latter makes a larger contribution to GDP than foreign tourism (see Exhibit 4a).
In 2015, the tourism sector in Spain accounted for 11.1% of GDP, broken down between 5.3% generated by incoming tourism and 5.7% by
“other tourism components”, which include domestic tourism. However, incoming tourism is marking the difference in terms of the overall result, given that the economic recession in Spain hampered domestic tourism up to 2013 and growth rates remain more subdued (see Exhibit 4b).
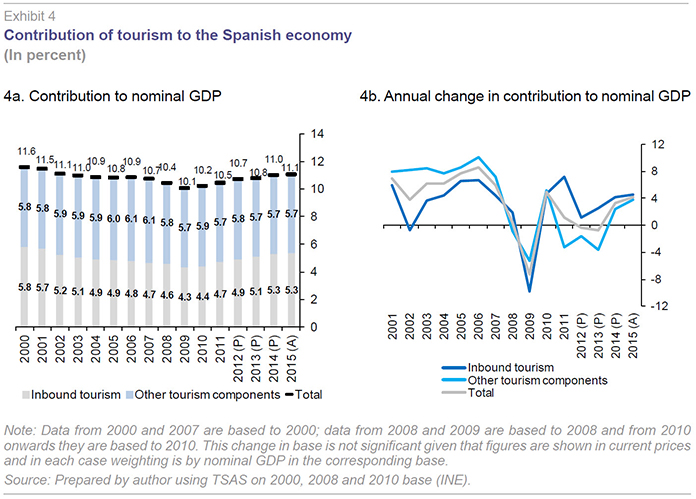
Prior to the economic recession, tourism was performing less strongly than other activities, reducing its share in GDP from 11.6% in 2000 to 10.1% in 2009. This led some commentators to warn that the sun and beach model was running out of steam, highlighting the need to transition to a sustainable model to align growth in overall tourism and its contribution to GDP. It is worth noting that during this period, wealth generated by incoming tourism grew even more slowly than other tourism components.
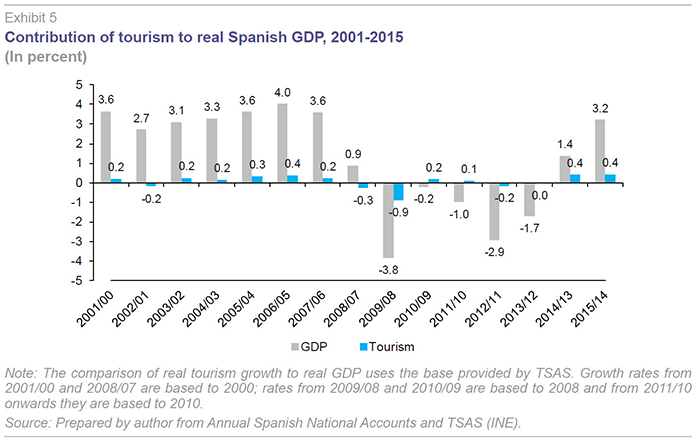
Negative impacts on tourism began to filter through with the start of the crisis in 2008, but above all in 2009. The number of international tourists fell, accompanying a decline in domestic tourism, resulting in a trough in tourism’s contribution to the Spanish economy (10.1%). However, since 2010, the recovery in foreign tourist arrivals has helped to reverse the trend, offsetting negative growth in domestic tourism (see Exhibit 4b). Furthermore, real growth in tourism in 2010 and 2011 helped to soften the fall in real GDP in those years (Exhibit 5).
The key element of the economic recovery from 2014 is not so much that tourism registered positive real growth, given that this tends to be the case during periods of expansion (Exhibit 5). But rather the strength of growth in tourism in comparison to other economic activities. Such that, for example in 2014, tourism contributed 0.4% to growth, accounting for 30% of the 1.4% growth in Spanish real GDP
[7]. Overall, this underlines how tourism is acting as the engine of the economic recovery.
Balance of payments
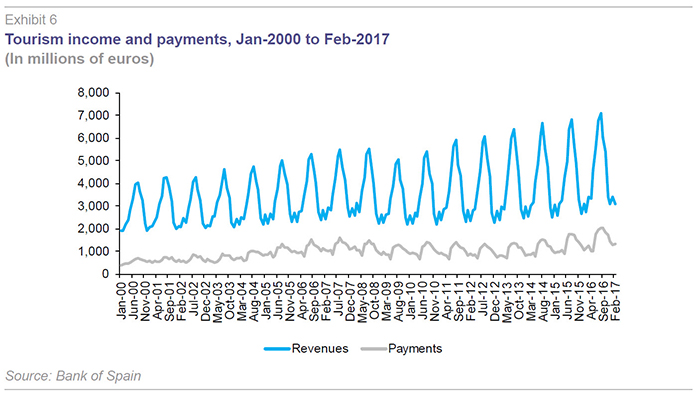
Furthermore, tourism provides a positive externality which should not be overlooked, in terms of its ability to finance the deficit on the trade balance. Tourism revenues in Spain have the largest weight in GDP among developed countries (4.9% in 2016).
Exhibit 6 shows tourism income and payments from January 2000 to February 2017 and clearly illustrates various aspects of already mentioned developments in incoming tourism. Firstly, the very large tourism income in relation to payments. This explains why Spain has a significant tourism surplus (36.3 billion euros in 2016), which traditionally has offset part of the trade balance deficit. Currently, it completely offsets it, given that the strong performance of exports has also helped to rein in the trade balance (Fernández, 2013). Overall, since 2012, the Spanish economy has posted a net lending position versus the rest of the world. Secondly, the exhibit underlines the well-known seasonable aspect of incoming tourism (also true for outgoing tourism, but to a lesser degree) which has not diminished with the trend towards shorter trips. Indeed, it is worth bearing in mind that the increase in low cost travel is primarily programmed for July and August. Thirdly, the exhibit shows the clear effects of the crisis on incoming and outgoing tourism in 2009 and the subsequent recovery. This rebound is very quick for incoming tourism, starting in 2010, while outgoing tourism only began to turnaround in 2014.
Contribution to employment
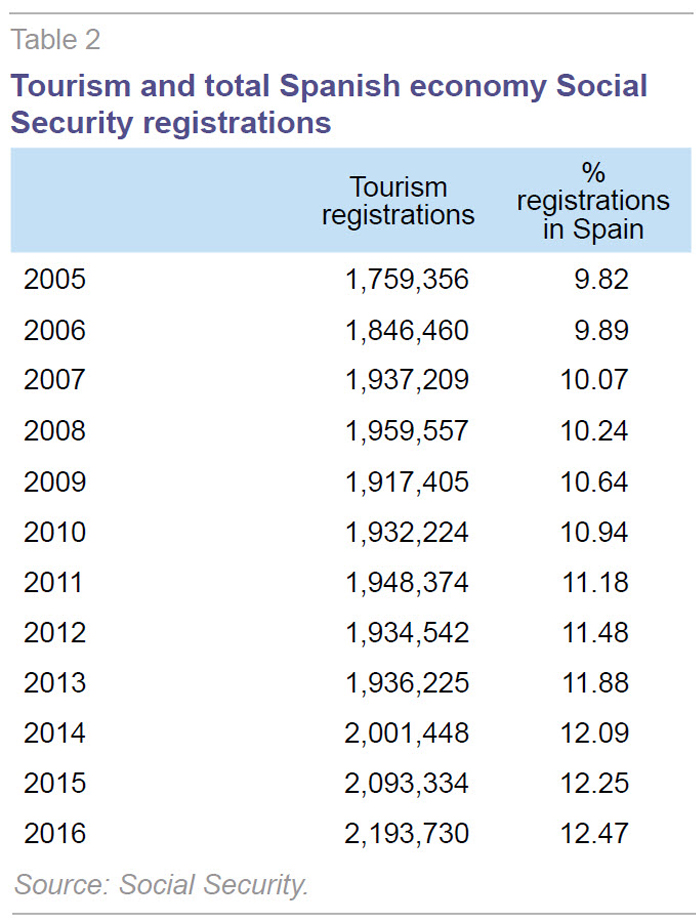
Tourism is labour intensive, meaning it makes a very significant contribution to employment. Social security registrations for tourism and the economy as whole, shown in Table 2, underline tourism’s relative importance. Growth has been particularly strong since 2014. In 2016, the sector employed 2.2 million workers, representing 12.5% of employment in the Spanish economy.
However, the excessive use of temporary contracts and low salaries still needs addressing. The first issue is challenging to resolve insofar as the star product is sun and beach tourism and, aside from the Canary Islands, all the sun and beach destinations are subject to significant seasonal variations. Furthermore, incoming tourism revenues continue to be very seasonal.
In terms of the second issue, a change in the management of human resources is required in the hospitality sector, as well as in the overall mentality – recognising that even the least well qualified jobs are crucial to maintaining the high overall quality of the destination. Regardless of the underlying qualifications needed for the job, improving the conditions of all workers should be regarded as favourable to companies’ results.
Contribution to gross fixed capital formation (GFCF)A less well known impact of tourism is its contribution to investment. The latest available data for 2010 and 2011 indicate that this contribution was, if possible, even more elevated due to the overall reduction in GFCF during the crisis. Thus, in 2011 the tourism sector accounted for 30% of the country’s GFCF. This is largely explained by investment undertaken for “Real estate renting” purposes in the “Dwellings” section of the national accounts, which represented 21.3% of Spanish GFCF in 2011. This is coherent with the strong momentum in the supply of individual tourism rentals, particularly following the emergence of Airbnb
[8].
By contrast, one of the concerns and weaknesses of the sector is the low investment in intangible assets. It is vital to strengthen innovation and incorporate ITC in tourism activity.10 This is the only way to offer better services and, at the same time, establish closer relations with potential tourists who are increasingly connected, both to make reservations but also to gauge the opinion of other tourists who have visited the destination.
Conclusion
This article has underlined the enthusiasm for tourism in Spain. This phenomenon has sometimes been accused of being growth obsessed, which is why this article has also highlighted the importance of profitability and the sustainability of destinations and the living conditions of its residents. In this regard, the sector should aim to avoid going down the path of mass tourism and appealing to tourists with very low average daily expenditures.
The goal should be to attract tourism from income segments which stay in hotels and engage in urban tourism (shopping, business and/or cultural). The quality, profitability and sustainability challenge is intimately linked to developing a more diversified tourism model over time and across the country. There are still opportunities to expand and improve business. Potential opportunities include: (i) increasing the use of the internet for direct marketing of regulated accommodation; and, (ii) taking account of increasing ageing among European tourists and the need to adapt supply to their necessities given that they can help play a role in smoothing seasonal variations. Clearly, the opportunities to regenerate and improve the sector go further than this, but this exceeds the ambitions of this article, which has a narrow objective of providing a clear and concise diagnostic of the current state of play of Spanish tourism.
Notes
Garín-Muñoz (2008) discusses the international trends in WTO forecasts in 2008 based on 1995 data and published in their WTO report (2002).
Statistical information on tourism arrivals into Spain comes from the Frontur survey. This survey was carried out by the Institute of Tourism Studies (IET) up to September 2015, thereafter it was taken over by INE. 2015 data are INE estimates in order to standardise all the months.
The distribution is relatively stable over time.
Among the source countries representing the top ten position in tourism arrivals.
See analysis of tourists visiting Barcelona and the relationship between reason for trip, origin and spending in Garín-Muñoz and Moral (2017).
Tourism’s contribution to GDP is measured through the Tourist Satellite Account (TSAS). In contrast to national accounts there is no homogeneous data available prior to 2010. Thus, for the analysis from 2000, GDP is used in the same base as the tourism data.
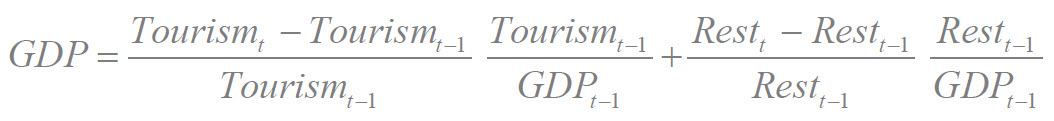
The contribution by tourism and other activities to real GDP growth is calculated as:
Some Spanish cities are already taking measures to control such growth. For example, the town hall in Palma in Mallorca is restricting tourism rentals (it looks set to allow 60 days per year in primary residence, but this is still under discussion).
10 See Rodríguez et al., (2014) assessment of the effects on innovation of the “Spanish Tourism Plan. Horizon 2020”.
References
Fernández, M. J. (2013), Exports as a driver of Spain’s economy recovery?,” Spanish Economic and Financial Outlook, 2, nº.3 (May): 43-49.
Garín-Muñoz, T. (2008), “Cambios en las tendencias del turismo internacional y sus implicaciones para la economía española,” Papeles de Economía Española, 116: 79-93.
Garín-Muñoz, T., and M. J. Moral (2016), “Competitividad del sector turístico español,” Papeles de Economía Española, 150: 194-209.
— (2017), “Enhancing financial impact of tourism while preserving sustainability in the city of Barcelona,” Handbook of Tourism Finances, McAleer y Chai (Ed.), en prensa.
Lim, C. (1997), “Review of international tourism demand models,” Annals of Tourism Research, 24 (4), 835-849.
Rodríguez, I.; Allan, M. W., and M. Hall (2014), “Tourism innovation policy: Implementation and outcomes,” Annals of Tourism Research, 49: 76-93.
World Tourism Organization (2002), Tourism 2020. Volume 7 Vision Global Forecasts and Profiles of Market Segments, Madrid.
María José Moral. UNED and Funcas