House prices and income: Trending in the same direction for now
In the initial stages of post-crisis recovery, housing price growth has been matched by income growth. However, the lack of granular data and concerns over the maintenance of supportive factors, such as income levels and low interest rates, make it difficult to gauge the future outlook for the real estate sector.
Abstract: After a sharp adjustment during the crisis, house prices started to grow in 2015 and are now accelerating. On average, at the national and provincial level, the increase in prices is being matched by an improvement in household income, reflecting their payment capacity. However, the lack of up-to-date data on income makes it difficult to confirm whether this also applies at a more micro level, such as districts of neighbourhoods within large cities. These are precisely the areas which have registered a larger increase in prices. In any event, future house price growth may be limited by subdued income growth and interest rate hikes, but the sector’s ability to generate noteworthy returns on investment should help support house prices going forward.
House prices have started to grow again after the sharp adjustment during the real estate boom. The latest data even point to a slight acceleration in price growth, leading to potential concerns about the formation of a new housing “bubble”.
Although house price growth is still modest and current levels remain far from pre-crisis peaks (still some 30% below), it is worth analysing the factors underpinning house price growth. Particularly, the extent to which current price increases in recent months are being matched by increases in the payment capacity of house buyers.
The fragmentation of the real estate market means that housing market developments need to be analysed at the highest level of granularity possible, given that the recovery in the sector seems to be focusing on specific regions (Taltavull, 2017). As a result, this article will aim to analyse house price behaviour and household income at the highest level of geographical disaggregation possible, which in turn will depend on the availability of statistical data.
It is also important to review the outlook for house prices over the coming months given that not only could this affect housing affordability for future buyers or returns for investors in these assets but also the country’s overall financial stability.
Recent developments in house prices and drivers
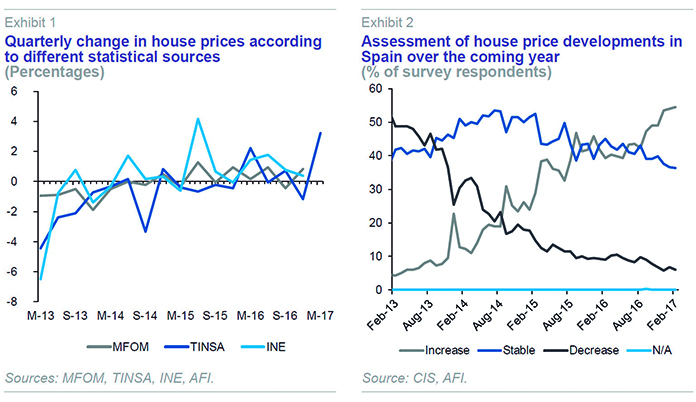
Following the significant adjustment in house prices as result of the real estate crisis, housing is once again regaining value. In general, and across statistical sources, house prices began to grow in 2015, registering positive quarterly growth rates since then of between 0% and 2%. However, in year-on-year terms, price growth only exceeded the 1% threshold in 2016.
House prices registered a slight acceleration at the beginning of this year. The Tinsa IMIE Index, the first to be published, points to nearly 3% growth in the first quarter of 2017 (Exhibit 1). Likewise, the Centre for Sociological Research’s (CIS) monthly barometer shows that an increasing proportion of citizens are expecting house prices to rise over the year based on their observations of the market. In February 2017 (latest available data), more than half of the survey respondents held this view, compared to 39% a year ago (Exhibit 2).
Even so, current house price levels remain a long way from pre-crisis peaks and even the most optimistic projections fail to see these being reached in the coming months. Either way, it is worth taking the time to analyse the factors that have driven house price growth so far.
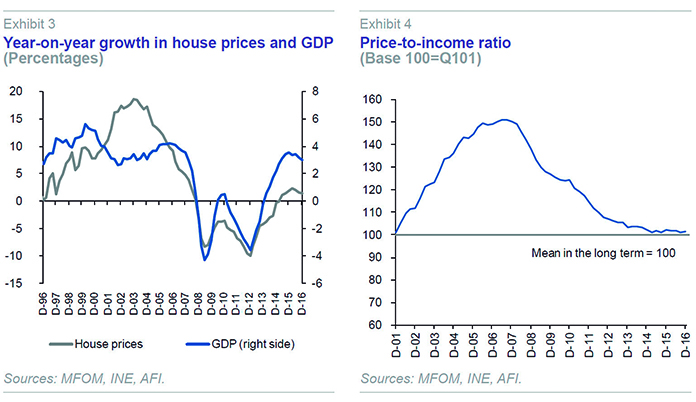
House prices are explained by: (i) GDP, as an approximation of household income, which in turn reflects the payment capacity of the ultimate house buyers; and, (ii) the interest rate on mortgage loans, which reflects access to external financing (predominantly bank lending).
In terms of GDP growth, house prices have moved in line with the increase in household income. This is underlined by the price-to-income ratio, which has been at its long-term equilibrium since the start of 2015 (Exhibit 4). Therefore, to date at the national level, house price growth has been matched by income growth.
However, the fragmentation of the real estate market means it is important to replicate this analysis at the highest level of granularity possible, given that the national average could be masking disparities between house prices and household income.
The different territorial reality
The first major breakdown available from official statistics after regional level data is at the provincial level. An analysis of provincial data suggests that house price growth has also been matched by income growth. The provinces which have seen the largest growth in house prices over the last three years are also those which have seen the biggest increases in employment (Exhibit 5) and, therefore, income or final house buyer payment capacity, which is also illustrated by the pick-up in housing transactions in these provinces. The Balearic Islands and Barcelona stand out particularly in this regard.
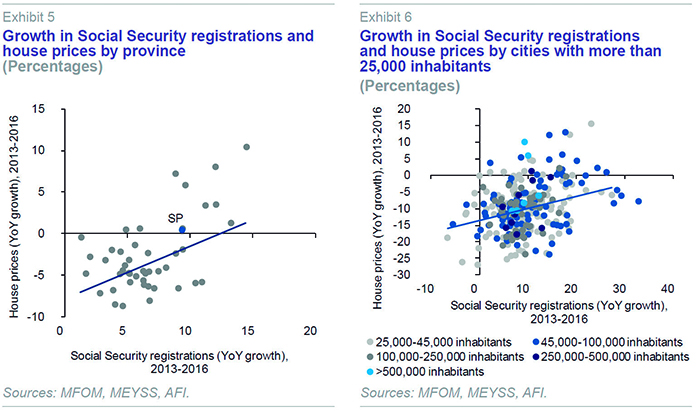
Municipal data offers another perspective, although statistics are limited to large cities, i.e. municipalities with more than 25,000 inhabitants. The cities where growth has been most dynamic and employment creation capacity the strongest are also those which have been the most successful in attracting inward migration, with higher demand for housing and upward pressure on house prices. However, it is also true that there are some signs of increased pressure on house prices in specific coastal regions where demand for second homes, especially from foreigners, is stronger ‒ with demand focused on above average value housing.
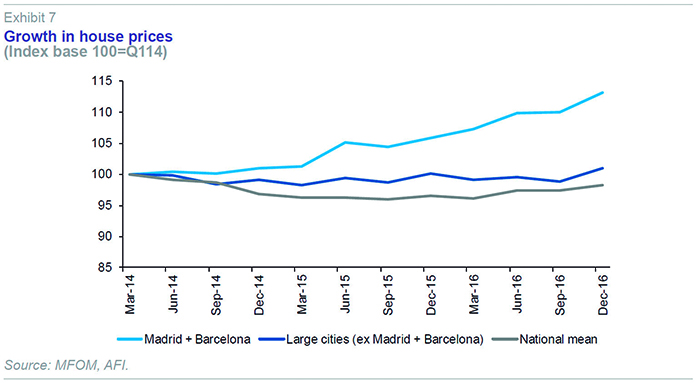
But without a doubt, the most significant increases in house prices have taken place in Spain’s largest cities, Madrid and Barcelona and their respective metropolitan areas. Since the start of the economic recovery (2014) up to the end of 2016, both cities have registered cumulative increases in house price values in excess of 13%, while the average for cities with populations of over 25,000 has remained practically unchanged since then (Exhibit 7). It is worth bearing in mind two factors that could have affected price developments in these two large cities. The first is related to the increase in the proportion of transactions and therefore used-house price valuations. These types of dwellings are generally located in city centres, where prices have risen more strongly, in addition to the fact the price level is generally above new housing. In fact, the most central districts, which have the highest price levels, are exactly those which have registered the largest increases in house prices in recent years. The second factor is related to the renewal of city centres, the significant provision of infrastructures and services on offer and the increase in demand for rentals, all of which have created greater investor appetite in these areas.
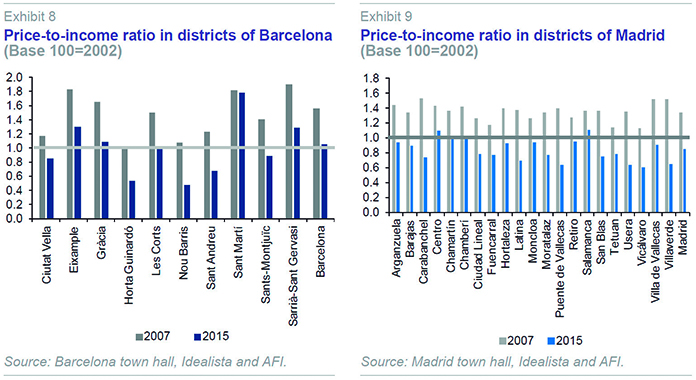
The key question is therefore up to what point the increase in house prices is also related to an improvement in ultimate house buyers’ payment capacity. Analysing house price developments in 2015 (latest data available) and household income in each of the districts in these two large cities, suggests that the ratio between the two is generally at its long-term equilibrium (Exhibits 8 and 9). However, there are some districts where there is a degree of disconnect between house prices and household income developments. In particular, there are signs of an over valuation of central districts and undervaluation of outlying areas. Furthermore, in the absence of statistical data on household income in each district in 2016, which is when prices grew most strongly, it is impossible to know whether growth in house prices has been matched by income or not. Therefore, it is not possible to say whether prices are growing at the same rate as the payment capacity of ultimate house buyers.
Outlook
The outlook for prices is particularly relevant insofar as it not only affects housing affordability for final purchasers or returns for investors in these assets, but also the country’s financial stability.
Consensus forecasts a slowdown in household income growth together with an expected increase in interest rates on mortgage loans, both of which will limit house buyer’s external financing capacity and will contain house price growth.
Either way, and despite the expected slowdown in house price growth, housing will continue to offer returns well in excess of other financial assets (currently over 4.4% according to the Bank of Spain), which could strengthen investment in the residential sector and put upward pressure on prices over the coming months.
Conclusions
Following the significant adjustment during the crisis, house prices started to grow in 2015, registering growth of over 1% in 2016. The pick-up in growth at the start of 2017 could foreshadow the emergence of a new real estate “bubble”, if it is not accompanied by concurrent increases in household income. The fragmentation of the real estate market means detailed micro-level analysis at the territorial level is required. Thus, while growth in house prices has been matched by income at the national and provincial level, the absence of statistical information at the most granular territorial level, such as districts within largest cities (Madrid and Barcelona), makes it difficult to confirm whether the same is true for these areas.
References
TALTAVULL, P. (2017), “Spain’s real estate sector: Slow path to recovery and future outlook,” Spanish Economic and Financial Outlook, February 2017.
María Romero and Noelia Fernández. A.F.I. - Analistas Financieros Internacionales, S.A.