Characteristics of Spanish employment creation during the 2014-2016 recovery
While latest available data confirm the recovery of Spanish employment, some of the undesirable aspects of the pre-crisis labour market remain in place. Active labour market policies and a reform of Spain’s education model will be key to helping reduce some of the outstanding structural imbalances.
Abstract: After experiencing severe job destruction as a result of the crisis, Spain’s economy began to show signs of recovery and, from 2014-2016, has recuperated a little over one-third of the employment lost during the crisis years. This article provides a descriptive analysis of the employment created during the recovery, helping to contradict some common misconceptions, reveal key features and highlight existing challenges facing Spain’s labour market. Firstly, employment created during the recovery was not largely unqualified work in the hospitability sector. This sector has seen the strongest growth in absolute terms, but accounts for less than a quarter of total employment created in these years. Occupations requiring higher levels of skill have experienced the strongest growth. Moreover, individuals with medium or high levels of education have had greater relative ease in finding work than the less skilled. Consequently, there is an important imbalance between the supply and demand for unskilled labour, underlining the need to reform Spain’s education model and give greater emphasis to active labour market policies. Finally, it is worth highlighting that even in the wake of the 2012 labour market reform, temporary employment continues to prevail. By contrast, part-time employment has been significantly reduced compared to the key role it played during the crisis years.
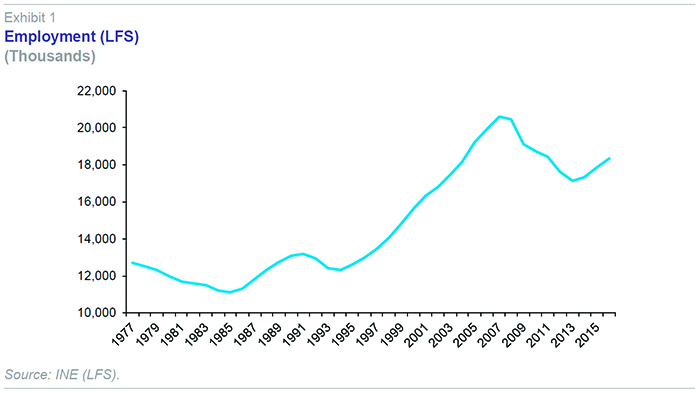
Between 2008 and 2013, the Spanish economy witnessed the largest destruction in employment in its recent history, both in absolute and relative terms. 16.7% of the jobs that existed in 2007 were wiped out over the following six years, some 3.4 million jobs. This compares to job losses of 855,000 (6.5%) during the 1992-94 crisis or 1.6 million (12.6%) between 1978 and 1985 (Exhibit 1).
Nearly all the job losses were in the private sector, while public sector employment fell by just 32,300 over the same period. However, while public sector employment grew by slightly more than 300,000 from 2007 to 2011, it fell by 351,000 in the subsequent three years to 2014.
Job losses were particularly pronounced in the construction sector, where more than half of total employment was destroyed (1.7 million), followed by industry which registered job losses of 921,000. 621,000 jobs were eliminated in market services. At the same time, the bulk of the wage-earning employment that was lost during the crisis took place among temporary contracts. Young people in particular bore the brunt of the adjustment with 62% losing their job, compared to 12% of adults over the age of 24.
The economy began to show signs of recovery in 2013 and employment started to grow again in 2014. Since then, 1.2 million jobs have been created to the end of 2016, recovering a little over one-third of the employment lost during the previous six years. The aim of this article is to provide a descriptive analysis of the employment created during the economic recovery, as well as other aspects of labour market performance during this period. The basis for the analysis is the information provided by the Labour Force Survey (LFS).
Working-age population and the labour force
The active population has declined by 367,400 between 2013 and 2016, explained entirely by demographic factors: The return of immigrants to their home countries and the negative evolution of the Spanish population. During this period, cohorts born during the mid-90s – when Spain’s fertility rate fell to levels that were among the lowest in the world – have reached working age. The retirement age population leaving the labour market has outweighed the number of new entrants.
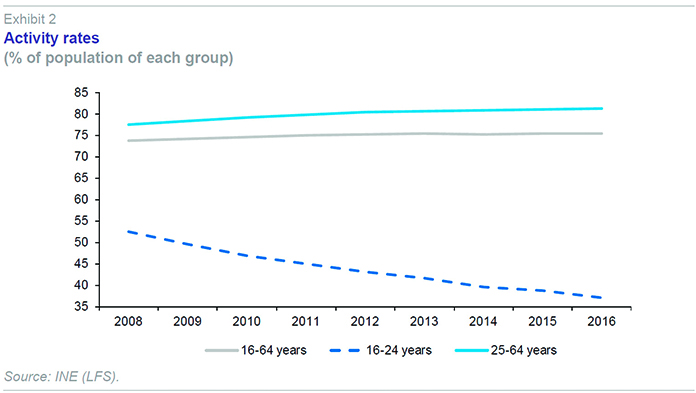
On aggregate, the labour participation rate of the 16-64 year-old population has not declined over the period, nor during the crisis years (Exhibit 2).
Thus, for the overall working age population, there have been no signs of labour market abandonment due to discouragement. However, the same is not true for the 16-24 year-old age group. The labour participation rate among this group, which had already been in decline since the start of the crisis, has continued to fall sharply during the recovery, currently standing slightly below the European average.
Insofar as this reduction in the activity rate is related to reduced abandonment of education studies and more years spent in education, this discouragement effect among the young population should be welcomed. Particularly when considering that the proportion of Spain’s active population with low levels of education is much higher than in other counties, as will be illustrated later.
Sectors and branches of activity
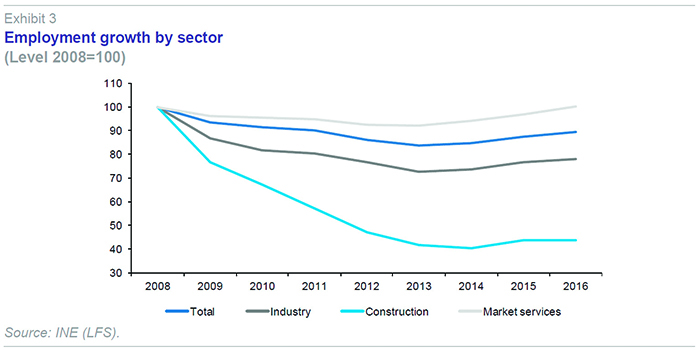
Employment has grown in all sectors of the economy during the recovery, especially in market services, which account for 75% of total employment creation, followed by industry. Notably, service sector employment surpassed pre-crisis peaks in 2016, while only a tiny part of the employment lost in industry, and especially construction, has come back so far (Exhibit 3). Despite strong growth registered in recent years, only 18% of employment has been recovered in the industrial sector. However, in GVA terms, more than half of lost output has been recovered, highlighting the increase in productivity in this sector.
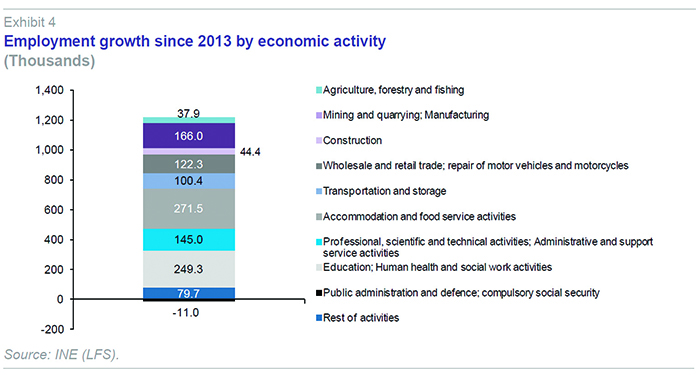
The hospitality sector has created the most employment in absolute terms, with 271,500 new jobs (Exhibit 4). Employment in education, health and social services has risen by nearly 250,000 (including both the public and private sector), while employment in industry has increased by 166,000.
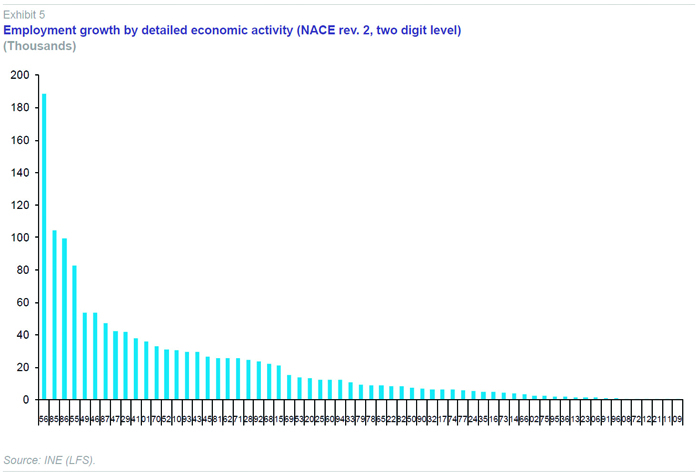
On a two digit NACE-Rev.2 classification basis, food and beverages is the branch of activity that has created most employment in absolute terms (branch 56, see Table 1 and Exhibit 5), followed by education (branch 85) and health care activities (branch 86). Among manufacturing activities, which account for nearly 14% of employment created since 2013, the contribution from the automotive sector (branch 29) is particularly notable, followed by food (branch 10), and manufacturing of machines and equipment (branch 28). Branches which are not included in the Exhibit registered reductions in employment over the period. Among the latter, the largest decline took place in domestic services, civil engineering, public administration, telecommunications and financial services.
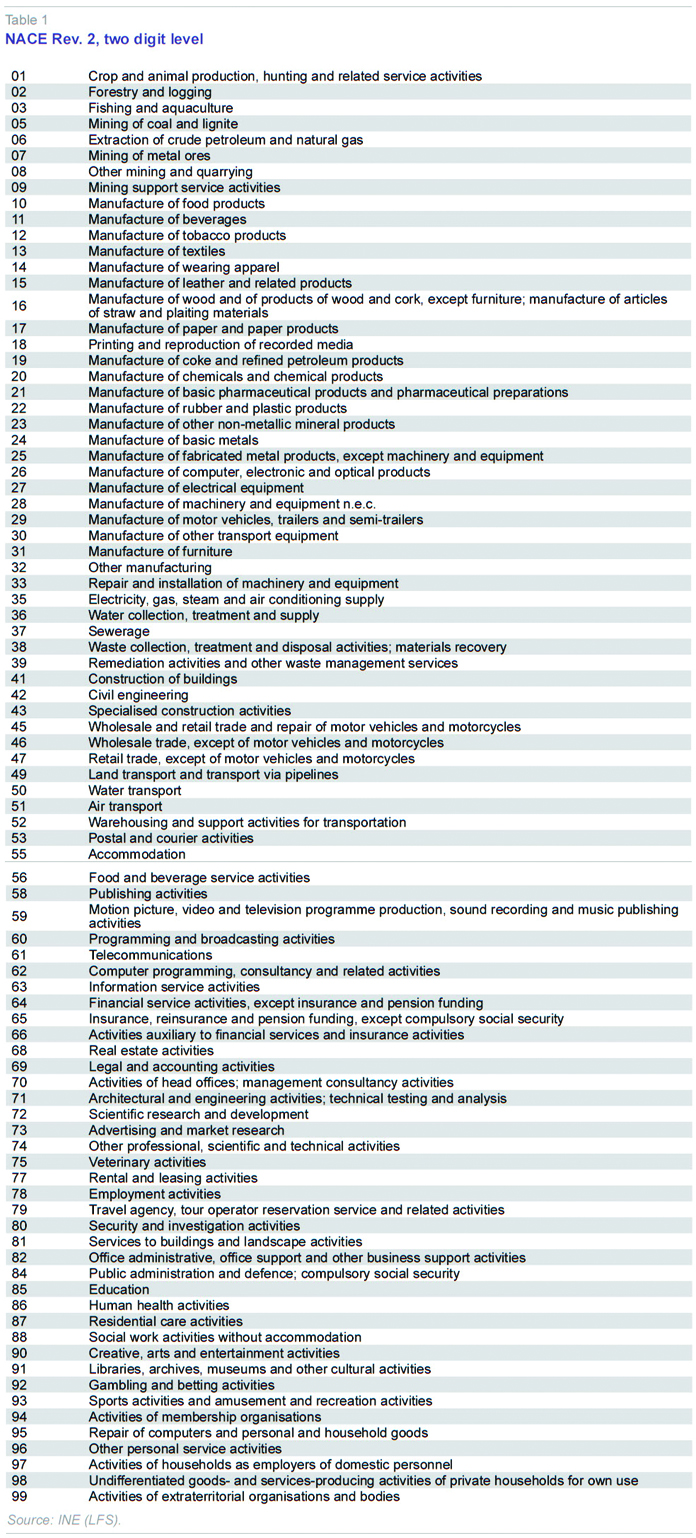
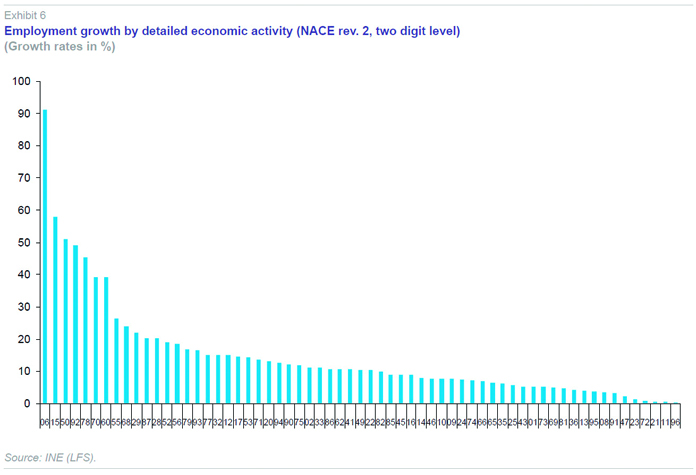
In percentage terms, the sectors which created the most employment (after oil and gas extraction – branch 6, see Exhibit 6 – which has very little weight in overall employment) were the leather and footwear industry (branch 15), maritime transport (branch 50), gambling (branch 92) and employment related activities (branch 78), followed by headquarters activities (branch 70) and radio and television (branch 60). Automotive manufacturing stands at tenth place in this ranking, manufacturing of machinery and equipment in twelfth and food and beverage services in fourteenth.
Education levels and type of employment
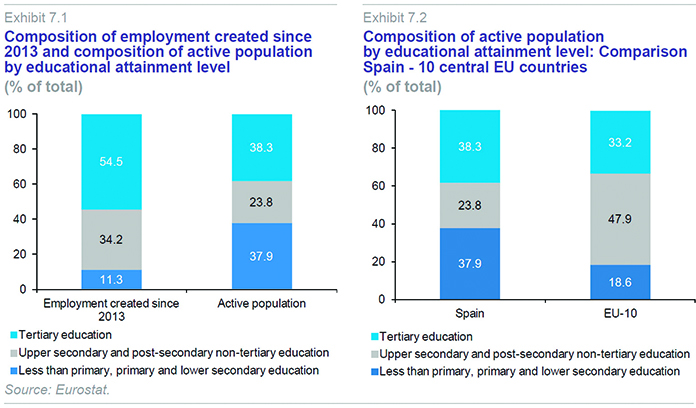
54.5% of the new workers who have found employment since the start of the crisis have tertiary education levels, while 34.2% have secondary or upper secondary, non-tertiary education. Only 11.3% of new employment has gone to individuals with no formal educational qualifications, i.e. below full secondary level. This is a notably different profile to the labour force with nearly 38% lacking a complete secondary education, highlighting one of the most negative aspects of the Spanish labour market, which is the oversupply of unskilled labour in relation to demand for these types of workers by the production system (Exhibit 7.1). The structure of the active population is very different from central EU countries (Exhibit 7.2), which have a much lower proportion of unskilled workers than in Spain, while medium education levels have twice the weight.
While one possible explanation for the high level of unskilled labour could be the weight of older generations with limited education, this is not the case. Among 25 to 29 year-olds – young people reaching an age where they may have completed their studies – the rate is nearly 36%. Nor is it excessively biased by the presence of unskilled immigration, given that the percentage among Spaniards in the active labour market is 37.2%, compared to 43.6% among immigrants.
The consequence of this oversupply of unskilled labour is that individuals in this group face significant difficulties in finding employment and there is strong downward pressure on their wages. Accordingly, 54% of the unemployed have below secondary level education. The unemployment rate among this group is 28%, compared to 19.2% among the active population with a medium level of education and 11.7% among those with tertiary education. This is undoubtedly one of the main factors explaining the high rate of structural unemployment in the Spanish economy.
The previous data underline the relatively greater ease with which medium and highly educated individuals are able to find employment. However, this does not necessarily mean that the structure of employment created matches their level of education, given the possibility to be overqualified for a job, i.e. workers occupying positions which require less skills than their education.
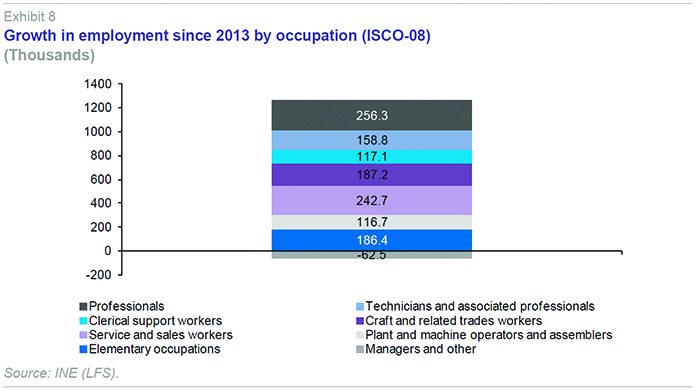
In order to have a more accurate idea of the structure of the jobs that have been created in recent years from a skills level perspective, the LFS provides data on employment according to the international classification of occupations ISCO-08 (Exhibit 8). Scientific and intellectual technicians and professionals have seen the largest increase in employment with 256,300 new workers. This is followed by hospitality, personal services and retail workers with 242,700 new jobs. Adding elementary occupation and machinery and installation operators to the latter, employment in the lowest skilled jobs has increased by nearly 550,000 since the start of the recovery. Meanwhile, jobs in categories associated with higher education levels (scientific and intellectual technicians and professionals, technicians and support professionals, accountants, administrative and clerical staff, craftsmen and qualified industrial and construction workers) have increased by 720,000. Separately, employment in the directors and managers category has fallen by 52,000.
Gender, age and education level
Employment growth has been relatively strong among both men and women – growing by 7.4% for the former – representing 57% of employment created during the recovery– and 6.6% for the latter.
The 50-64 year age group has seen the strongest growth in employment since the start of the recovery, with an increase of 17.4% (760,000 new jobs, i.e. 63% of total new employment), followed by young people up to the age of 24, recording a 7.5% increase (57,000 new jobs). Employment among middle-age groups, between 25 and 49 years, grew by 3.1% (365,000 more jobs).
Significantly, all new jobs for young people have been created for individuals with secondary or tertiary education, while employment among low skilled young people, i.e. below full secondary education, has fallen sharply over the period. The unemployment rate of unskilled young people stands at 53.8%, compared to 41% for those with secondary education and 31.6% among university graduates. These figures are for the under-25s, and given that the age of completion of university studies ranges from 22 to 23 years, the latter figure relates to unemployment among recent graduates. The unemployment rate for 25-29 year-old university graduates falls to 19.5%.
The same profile applies to cohorts from 25 to 49 years (falling employment among the unskilled and growth among secondary and tertiary education levels). Employment among low skilled individuals has only increased in the 50 to 64 year-old category. Even in this group, the increase has been much stronger for more highly educated individuals.
Contract type
While temporary contracts bore the brunt of the employment adjustment during the crisis, the bulk of jobs created since the crisis, 61.5%, have also been temporary. As a result, the temporary employment rate which fell during the crisis from a peak of 34% to 23% in 2013, rose to 26.1% in 2016.
Construction has seen the largest increases in temporary employment with permanent contracts even falling. Against expectations, growth in temporary employment has also been above average in the manufacturing industry (76% of total employment created), while it has been below average in the hospitality sector (43%).
Meanwhile, full time contracts have accounted for 93% of new employment created in the last three years. Part time employment in 2016 – accounting for 15.2% of total employment – was only 83,000 above 2013 levels. Furthermore, over the last year, there has been a decline in this type of employment, which appears to suggest that contracts are being converted from part time to full time. Nonetheless, in 2016, there were 400,000 more part time jobs than in 2007, given that this type of contract grew strongly during the crisis, especially from 2010 to 2014, which suggests that there was an opposite adjustment from full time to part time employment over that period.
Conclusion
The data set out in this article, which are entirely descriptive and provided by the LFS, in some cases confirm and in other cases contradict some of the most widely-held assumptions about the nature of employment created during the recovery.
It is not true that the employment created during the recovery is all unqualified work in the hospitality sector. This branch of activity has seen the strongest growth in absolute terms, but accounts for 22% of total employment created in these years. Similarly, occupations requiring higher levels of skill have experienced the strongest growth.
Closely related to this, individuals with medium or high levels of education have had greater relative ease in finding work than the less skilled. Consequently, there is an important imbalance between the supply and demand for unskilled labour: Only 11.3% of new jobs have been filled by people with low education levels (below full secondary), though this type of labour accounts for 38% of the labour force. This underlines the need to reform Spain’s education model and give greater emphasis to active labour market policies.
Finally, it is worth highlighting that temporary employment, one of the most undesirable aspects of the Spanish labour market, continues to prevail. Use of these types of contracts accounts for 61.5% of new employment created in recent years. High rates of temporary employment are a logical consequence of Spain’s approach to regulating the labour market, which the 2012 labour market reform did not resolve. By contrast, part-time employment has barely featured among new jobs created over the last three years, compared to the key role it played during the crisis years.
María Jesús Fernández. Senior Economist, Funcas