
Income inequality
in year one of the pandemic
Social protection measures rolled out by the government during the COVID-19 crisis strongly mitigated the negative effect of the pandemic on lower income households. However, public transfers were not enough to fully neutralize the increase in inequality in Spain, which must be attributed to more structural factors.
Abstract: Were it not for the mitigating social protection measures rolled out, the effects of COVID-19 on Spanish households’ primary income would have been felt more keenly in the lower income brackets and would have translated into a sharp increase in inequality. Public transfers offset a significant portion of the income lost by the households most affected by unemployment or disability. However, they were not capable of fully neutralising the increase in inequality. The adverse effect on disposable income was concentrated in the first decile of the income distribution. Moreover, the persistence of pockets of poverty in Spain cannot be blamed on the crisis induced by the pandemic but rather must be attributed to more structural factors related with low levels of education and job qualifications in some segments of the population, the insufficiency of the minimum income scheme, the scarcity of help for families and the limited size of non-contributory pensions.
Introduction
Recent publication of the Living Conditions Survey 2021 (INE, 2022 and Eurostat, 2022), which contains household income figures for 2020, enables analysis of the impact of the economic crisis on distribution of personal income during that first year of the pandemic. The goal of this paper is to provide a preliminary assessment of the main indicators of inequality, comparing 2019 and 2020, in particular. Works such as those of Aspachs et al. (2021), Cantó (2021) and Martínez-Bravo and Sanz (2022) have yielded early analysis of the effects of the crisis induced by COVID-19 on inequality during the initial months of the pandemic: the first, using real-time information about salaries and public transfers gleaned from over 2 million bank accounts; the second by simulating flows between employment and unemployment and the public policies rolled out; and, the third, using the data derived from two surveys conducted in 2020.
The impact of social transfers on income inequality
The benchmark metric used to measure income inequality is the Gini coefficient which for the purposes of this paper ranges from 0 to 100. In 2019, the Gini index of equivalised (net annual) disposable income was 32.1; it increased by 0.9 points to 33.0 in 2020 – implying an increase in inequality. As shown in Exhibit 1, 2020 marked the end of the downward trend initiated in 2014. It is reasonable to assume that the effect of the lockdowns and business restrictions on employment and the number of hours worked had an uneven effect on income across the various occupancies with the attendant impact on the main inequality indicators (refer to Ocaña et al., 2020).
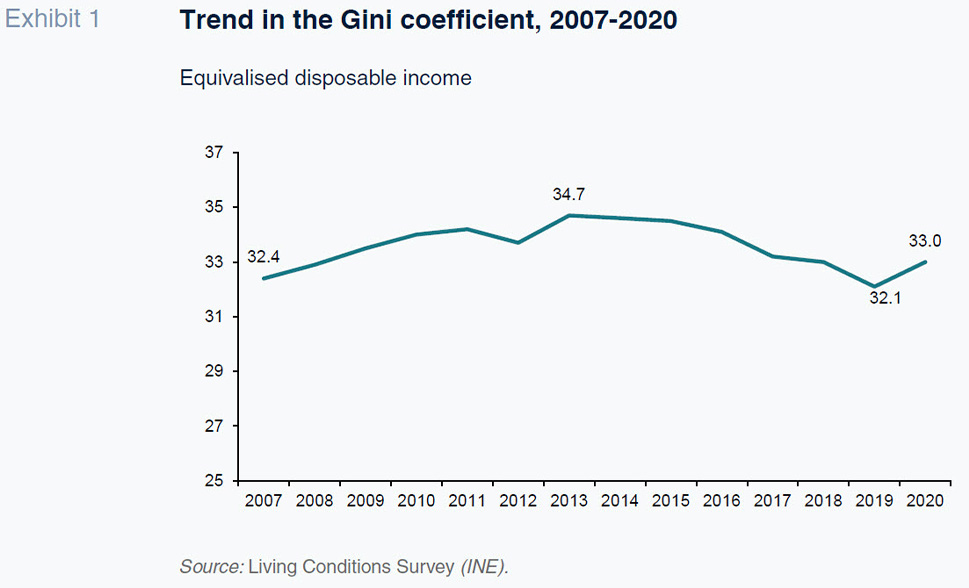
Note, however, that despite the fact that GDP contracted by 11.3% in 2020, the social protection policies rolled out by the government, which took the form of social benefits, went a long way to offsetting the loss of primary income. In fact, the Living Conditions Survey (LCS) figures reveal that average income per person in Spain dipped by just 0.18% in 2020 by comparison with 2019.
To isolate the impact of the social benefits on inequality, we use the Gini coefficient readings in three different scenarios: (i) equivalised disposable income (EDI), as mentioned previously; (ii) equivalised disposable income before all forms of social transfers; and, (iii) equivalised disposable income including pensions but excluding all other transfers. Recall that by using disposable income, we are referring to income after all the direct taxes and social security contributions borne by Spanish households. As shown in Exhibit 2, the Gini coefficient of EDI before transfers increased from 46.9 in 2019 to 50.1 in 2020, an increase of 3.2 points, which is a significant jump for just one year. In fact, during the years of the Global Financial Crisis and Great Recession, the biggest increase in the Gini coefficient of EDI before transfers in two successive years took place in 2009, when it increased by 2.3 percentage points with respect to 2008.
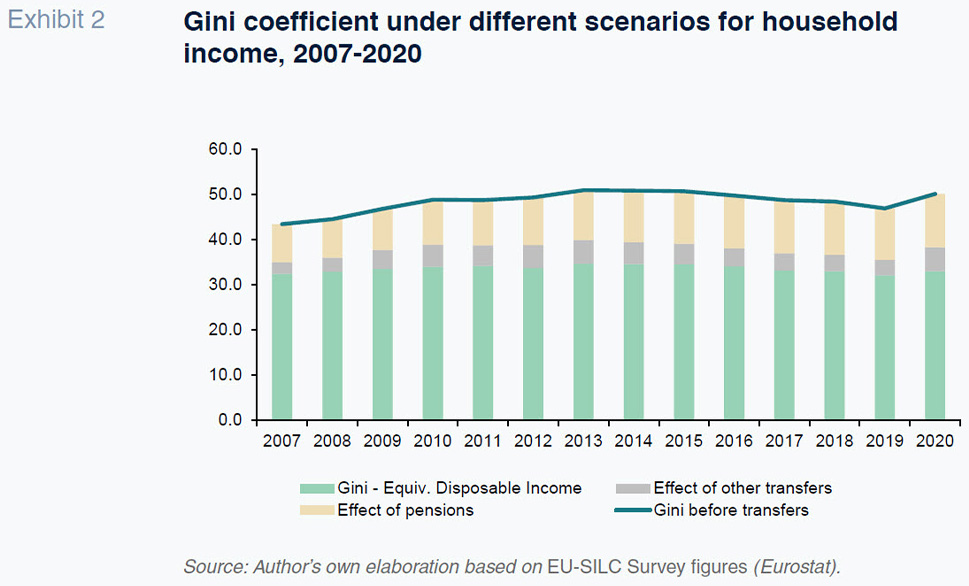
The impact of pensions on income inequality reduction has been increasing from 8.4 points of the Gini coefficient in 2007 to 11.8 points in 2020.
[1] In turn, the effect of all other transfers (unemployment benefits, sick pay, family support, the minimum income scheme,
etc.) on inequality reduction peaked at 5.2 points in 2013 and has since been coming down slowly, in tandem with the downtrend in unemployment, to 3.4 points in 2019. That said, it increased once again to 5.3 points in 2020. The comparison of the inequality coefficients for the three definitions of disposable income suggests that it was thanks to the mechanisms for redistributing pensions and, above all, other social benefits that inequality in Spain only increased by 0.9 points in 2020 by comparison with 2019, despite the massive impact of the pandemic crisis on GDP and employment. In 2020, public spending on social benefits in cash increased by 31.47 billion euros, or 16.1%, from 2019, to 228.63 billion euros (IGAE, 2022). More specifically, expenditure on unemployment benefits, fuelled largely by the furlough scheme, increased by 22.18 billion euros, more than doubling the 2019 figure, and payments for sick and disability leave – again closely related with the health ramifications of COVID-19 – increased by 3.07 billion euros.
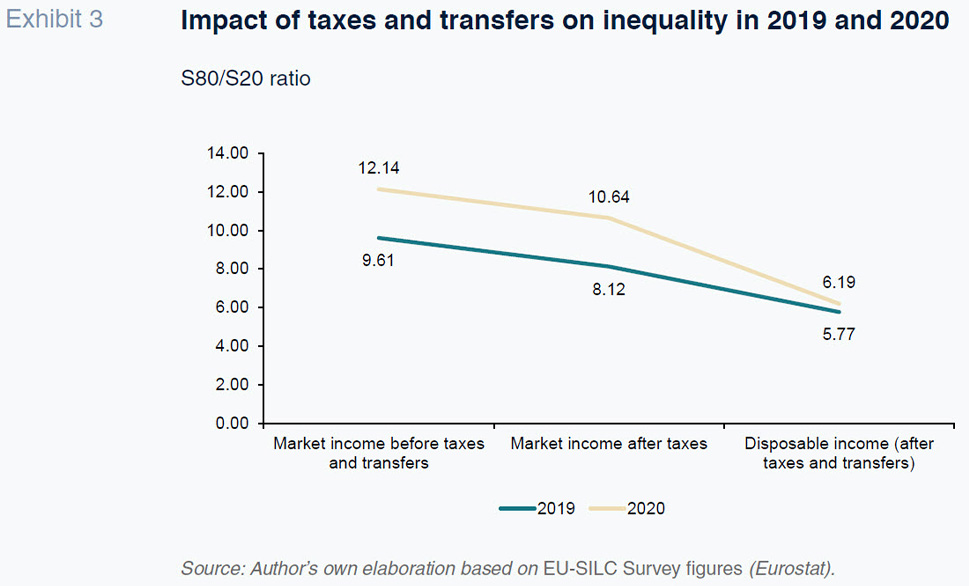
The greater redistributive effect of the social benefits awarded in 2020 is likewise tangible if we compare the trend in the relationship between the average income of the 20% of the population with the highest income and the 20% with the lowest income (the income quintile share ratio, or S80/S20 ratio), as depicted in Exhibit 3. Whereas the impact of taxes and social security contributions on income inequality is very similar in 2019 as in 2020, the impact attributable to social benefits is nearly twice as high in 2020 judging by the reduction in the S80/S20 ratio.
Focusing on the lowest earners
Use of the Gini coefficient does not provide sufficiently accurate insight into inequality between the extremes of the disposable income distribution. We therefore round out that information with statistics around income deciles and other ratios that correlate income between the higher and lower deciles and percentiles. Specifically, despite the restorative effect of the public transfers, average disposable income per person in the first decile decreased by 9%, compared to 2% in the second and third deciles. At the other end of the distribution, average income per person in the ninth and tenth deciles increased by 2%, also increasing, by 1%, in the eighth decile (Exhibit 4).
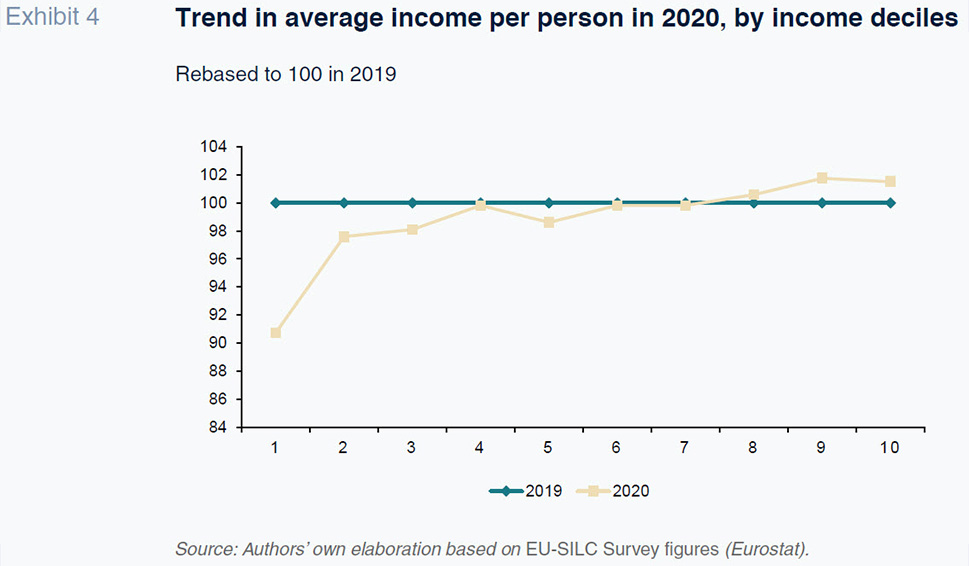
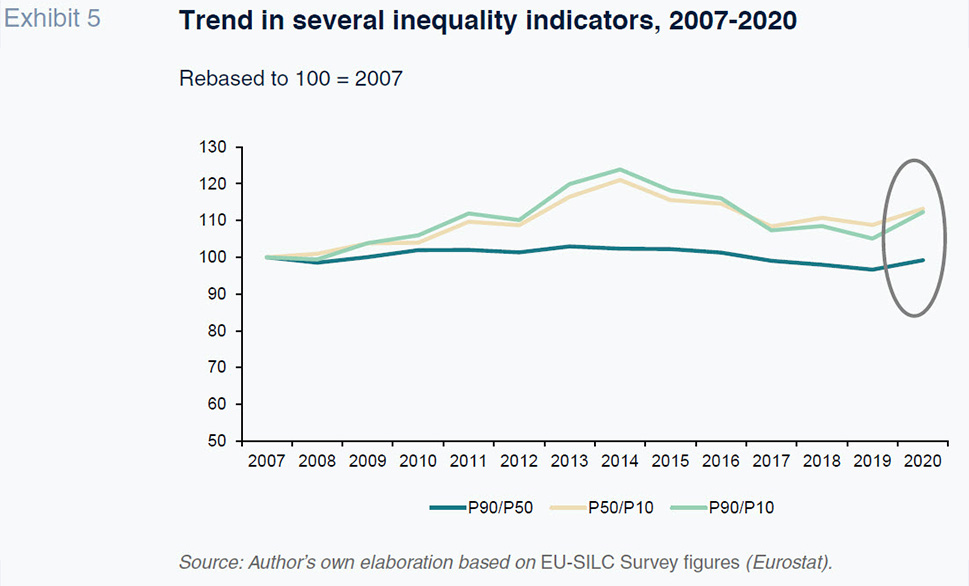
In other words, whereas the Gini coefficient increased by 2.8% between 2019 and 2020, the S90/S10 ratio, which measures the relationship between the equivalised disposable income of the 10% of the population with the highest income and the 10% with the lowest income, increased by 11.7%, indicating that the increase in inequality in 2020, essentially took the form of a widening in the distance between the two extremes of the distribution. That divergence is also evident if we look at the relationship between the income of the 90th and 10th percentiles (P90/P10), which can in turn be broken out into two ratios, P90/P50 and P50/P10, using the distribution median as an interim reference point (P50). As shown in Exhibit 5, the increase in inequality during the Great Recession, captured using P90/P10, was over 90% attributable to the increase in the distance between the median income level and the lower income levels (P50/P10), and only 10% attributable to the growth in high incomes with respect to the median (P90/P50). However, in 2020, the P90/P50 ratio also increases and explains over 35% of the increase in the distance between the 90th and 10th percentiles. A comparison of the 95th and 5th percentiles yields a similar conclusion. Once again, that analysis shows that although the distance between the median and the lowest income percentiles (P50/P05) explains two-thirds of the increase in inequality between the highest and lowest earners in 2020 (P95/P05), over 30% is explained by the increase in the P95/P50 ratio.
It is highly feasible, moreover, that, as the labour market normalised over the course of 2021, with employment rising and unemployment coming down, the income inequality indicators will have come down, largely offsetting the increase observed during year one of the pandemic.
Regardless, from the perspective of affording social shelter to the lowest earners, it is worth shining the spotlight on the first decile of the income band, which, by definition, includes around 4.7 million people. In 2020, the upper income limit per person for that poorest 10% of the population stood at around 4,200 euros per annum, i.e., 350 euros per month. Drilling down further into the 5th percentile (2.35 million people) those figures were 2,800 euros per annum and 230 euros per month; and in the 1st percentile (470,000 people), less than 40 euros a month.
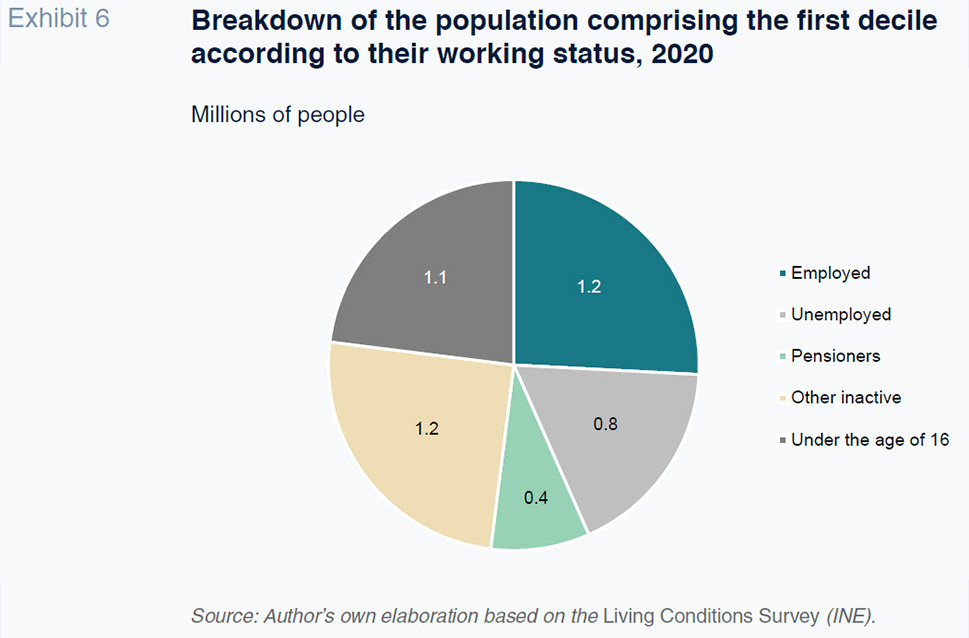
The constituents of the first decile (Exhibit 6) include minors under the age of 16 (around 1.1 million), job-seekers (820,000), wage earners (1.2 million), retirees and pensioners (some 400,000) and other inactive individuals (1.2 million). Those figures are not too different from those of 2019, so that the persistence of such situations of poverty cannot be entirely blamed on the crisis induced by the pandemic but rather must be attributed to more structural factors related with low levels of education and job qualifications in some segments of the population, the insufficiency of the minimum income scheme, the scarcity of help for families and the limited size of non-contributory pensions. The bulk of this category is, therefore, made up of people of working age and children living in those same households (single-parent families headed up by women, young people with and without children) whose income prospects are derived from a mix of factors related with the job market – participation, employment, hours worked, wages – and others related with taxation and social policy.
Notes
Measurement of the impact of pensions on inequality for this analysis is done taking a strictly annual approach, i.e., without factoring in the impact of annuities, which would require us to compare the capitalised value of the contributions made throughout ones entire working life with the present value of all pensions received during entitlement to those benefits.
References
ASPACHS, O., DURANTE, R., GRAZIANO, A., MESTRES, J., MONTALVO, J. G. and REYNAL-QUEROL, M. (2021). Seguimiento de la desigualdad en tiempo real en España durante la crisis de la COVID-19 [Monitoring inequality in Spain in real time during the COVID-19 crisis].
Información Comercial Española, 923, pp. 163-179.
CANTÓ SÁNCHEZ, O. (2021). Los efectos de la pandemia de la COVID-19 en la distribución de la renta y el papel de las políticas públicas [The effects of the COVID-19 pandemic on income distribution and the role of public policy].
Información Comercial Española, 923, pp. 145-161.
IGAE (2022).
National accounts. Annual series. Government expenditure by function – COFOG. Ministry of Finance and Civil Service.
MARTÍNEZ-BRAVO, M. and SANZ, C. (2022). Inequality and psychological well-being in times of COVID-19: Evidence from Spain.
Working Papers, No. 2204. Bank of Spain.
OCAÑA, C. (dir.), BANDRÉS, E., CHULIÁ, E., FERNÁNDEZ, M. J., MALO, M. A., RODRÍGUEZ, J. C. and TORRES, R. (2020).
Impacto social de la pandemia en España. Una evaluación preliminar [Social impact of the pandemic in Spain. A preliminary assessment] Funcas. Disponible en:
https://www.funcas.es/wp-content/uploads/2020/11/Impacto-social-de-la-pandemia-en-Espa%C3%B1a.pdf
Eduardo Bandrés. Funcas and University of Zaragoza