Wage moderation in Spain’s economic recovery
Following a period of severe job destruction throughout the crisis years, since 2014, the Spanish economy has maintained a consistent pace of job creation. Nevertheless, the Spanish job market remains characterized by a high level of unemployment and substantial wage moderation, particularly in the case of young, first time workers.
Abstract: The Spanish labour market is gradually emerging from the crisis, with over half of the jobs destroyed having been recovered. The new jobs created since 2014, however, are substantially different from those of the pre-crisis period. This paper provides an empirical analysis of data on the evolution of the employment trajectory of male workers, aged 18-55, employed between 2008 and 2015, to shed some light on the characteristics of new employment contracts in Spain’s post-crisis period. In general, results show that the Spanish labour market is paying less than it used to for the same kind of work. This reduction in wages evidences the new labour market conditions, where most of the burden is being shouldered by those workers who had to change jobs and young people just joining the labour market.
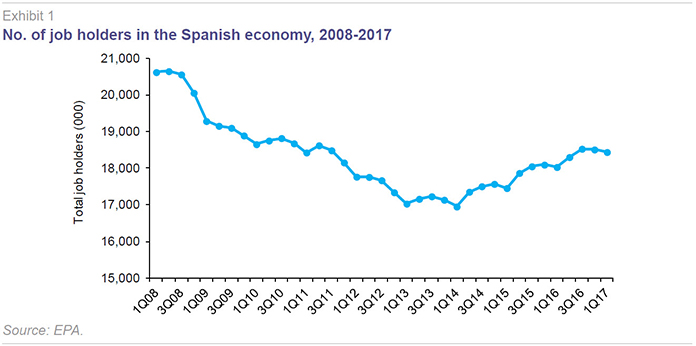
During the five year duration of the Great Recession, from 2008 to 2013, the Spanish economy destroyed 3.6 million jobs, 18% of the total. It began to create jobs again from 2014, at a net annual pace of about 500k. In 2014, it generated 504k jobs, in 2015, 574k jobs, and in 2016, 408k jobs (Exhibit 1). These are undeniably excellent figures that go a long way to combat one of the Spanish labour market’s main problems: the high unemployment rate. However, and despite this healthy job creation, the unemployment rate remains high, at 18.7% of the active population, and the total number of people employed remains well below (by 2.2 million) the peak of 2008, with the generalised sense of crisis lingering. This sentiment is linked to one of the aspects that characterised the Spanish labour market during the Great Recession, particularly in the wake of the labour reforms of 2012: Wage moderation. Many believe that this wage moderation stemmed the reduction in employment and laid the foundations for the ensuing recovery; however, new low-wage job contracts have proliferated and, in parallel, a new form of relative poverty, in which those affected have work but on very precarious terms, has spread.
The goal of this paper is to describe the characteristics of the new job contracts created since 2014. Certain prior papers have analysed the trend in wages in the Spanish economy during the recovery (see Bentolila and González, 2017), finding overall growing inequality across the various classes of workers. Unlike those papers, this study uses longitudinal data from the
Continuous Work History Sample (CWHS) (2015).
[1] The main benefit of these data is the ability to paint a picture of trends in employment and wages for a broad group of workers over a long period of time. In that way, it is possible to describe the changes in the wage distribution for a stable group of workers as distinct from changes caused by the entry of new cohorts with potentially different characteristics and expectations. In addition, given the existence of detailed information about when a given contract is signed, it is possible to identify new contracts (the new formulae), describe their characteristics and compare them with the terms offered in new contracts in prior years.
This paper centres on the workers (male) who were employed in 2015 and aged between 18 and 55.
[2] For the sample, information is provided regarding the terms of employment (type of contract, type of working day), wages
[3], type of company and sector for a total of 213,673 individuals from the start of their working lives. The focus is on describing the employment trajectory of this universe of workers between 2008 and 2015 (the last year in the series) and the characteristics of the new employment contracts executed during the years of recovery.
Exposure to wage trends dependent on starting position
By way of background, Exhibit 2 shows the trend in annual income
[4] between 2008 and 2015 for two different groups of workers: those who have enjoyed a steady relationship with the same company since 2008 (“stayers”) and those who switched jobs at some point between 2008 and 2015 (“movers”). The exhibit clearly shows how the recession triggered an increase in income inequality between these two groups. Whereas the stayers took home 4.5% more a year in 2015 than in 2008, the movers’ income had eroded by 4.1%. As a result, the difference in annual income between these groups widened by 14 percentage points, rising from 58% in 2008 to 72% in 2013. The years of economic recovery – 2014-2015 – have brought a slight increase in real income for both groups, albeit leaving the wage gap virtually intact, at 73%.
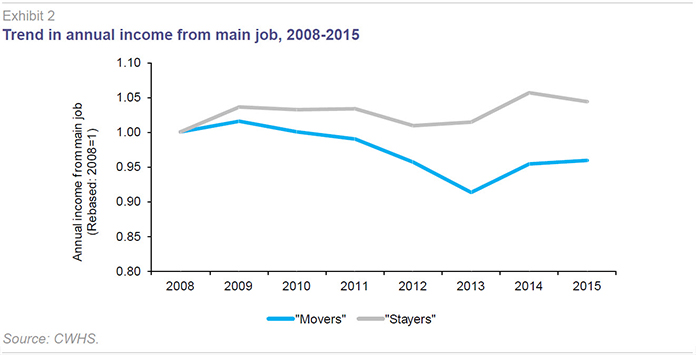
One of the factors most closely correlated with membership of one or other group is the type of contract held. Thus, 82% of the stayers had a permanent contract in 2008, whereas nearly half of the movers (46%) were on temporary contracts. As a result, it is possible to conclude that the increase in wage inequality during the recession was shaped by each worker’s starting position and principally the type of contract held at the start of the crisis. Thus, the permanent-temporary binomial so characteristic of Spain’s job market remains a source of growing inequalities, a phenomenon which would appear to have changed little in the wake of the recovery or the labour market reforms undertaken in February 2012.
Characteristics of the newly-created jobs: Movers who were working in 2008
Given that the burden of the wage cuts has fallen on those who had to change jobs (the movers), the next step is to outline the characteristics of the new jobs in which these individuals were employed during the years of economic recovery.
Exhibit 3 breaks down jobs in 2008 and 2015 by three characteristics (sector of employment, type of work day and company size). The exhibit clearly shows a shift in composition with the weight of jobs in industry, above all in construction, falling, and the percentage of jobs in the services and hospitality/catering sectors increasing. The hospitality sector is very closely related with the tourism sector, although the tourism sector cannot be identified as such in the database. As for the services sector, the weight of jobs requiring either very unskilled or very skilled workers increased, leaving those with mid-level skills more vulnerable. The drop in the number of jobs in industry is surprising given the fact that the export boom in this sector has frequently been named as one of the main drivers of the economic recovery and recent job creation. Note that the downtrend in the relative weight commanded by industry jobs records a drop in absolute terms as the number of individuals in the sample remains constant between 2008 and 2015. Specifically, 8.3% of the individuals in the sample who were working in industry in 2008 had ceased to do so by 2015.
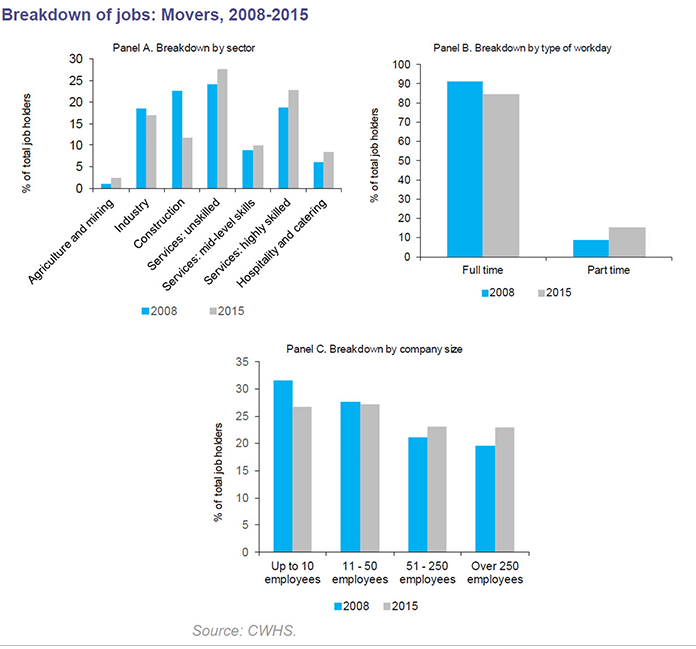
As a result of the massive job destruction in the construction sector, nearly one half of the movers (48%) who were employed in this sector in 2008 were working in another sector in 2015. The exhibit also shows how a growing number of movers (7.4%) went from working full time to working part time and in companies with larger headcounts. Accordingly, nearly 9% of the workers who were employed in companies with 50 or fewer employees in 2008 belonged to companies with over 50 employees in 2015. This percentage climbs to 15% if we focus on the universe of smaller companies, those with 10 or fewer employees.
In short, the economic crisis and ensuing job creation have triggered a change in the economy’s productive structure in which industry and the construction sector have lost sway, with the services sector, particularly services related with tourism, gaining ground, creating work for unskilled and highly skilled workers alike. All of which in jobs that are still mostly full-time with a relatively higher share of part-time arrangements and of jobs at larger companies.
Factors explaining the difference in wages between 2008 and 2015
The section above demonstrated how the burden of the income erosion fell on the workers who, between 2008 and 2015, had to change jobs (the movers) and who, as a result of those switches, are currently working in jobs that are different to those they had in 2008. This section focuses on an analysis of the factors explaining the difference in the movers’ wages in 2015 compared to 2008. The reduction in wages sustained by these workers in real terms can be attributable to changes in the characteristics of the jobs they hold today (e.g., greater weight of part-time work) or to lower remuneration for the same type of work. The analysis performed uses the Oaxaca-Blinder decomposition method to separate the component of the decline in income that is attributable to job characteristics from that attributable to remuneration, job characteristics being equal.
Exhibit 4 illustrates the result of this analysis using daily wages in the main job as the variable of interest.
[5] The movers saw their daily wages fall by 3.3% between 2008 and 2015. Considering the characteristics of both the employees and their jobs, the analysis suggests that these workers should have been earning 2.0% more in 2015. That is mainly because these workers have accumulated years of potential experience (age) during the seven years elapsing between 2008 and 2015 so that, in ordinary conditions, their income should have risen, precisely by 3.3%. Their wages should also be higher in light of the new sectors employing these workers, as on average they are working in sectors which pay higher wages than the sectors they left (
e.g., certain services vs. construction work). Specifically, this sectoral component means that the movers should have been earning 1.7% more in 2015 than in 2008. Combining their greater potential experience and the sector shift, the movers, in normal conditions, should have been taking home 5.0% more in 2015 than in 2008. However, rather than earning more, these workers are earning less. And that is due mainly to two factors. One, the fact that a large number of the movers are working part-time, a factor which entails a wage penalty of 3.2% on average. The other explanatory factor – the most important one – is the price component, which reduces daily wages by 5.4%. The price component tells us that a significant part of the drop in income sustained by the movers is attributable to the fact that the Spanish labour market is paying less than it used to for the same kind of work.
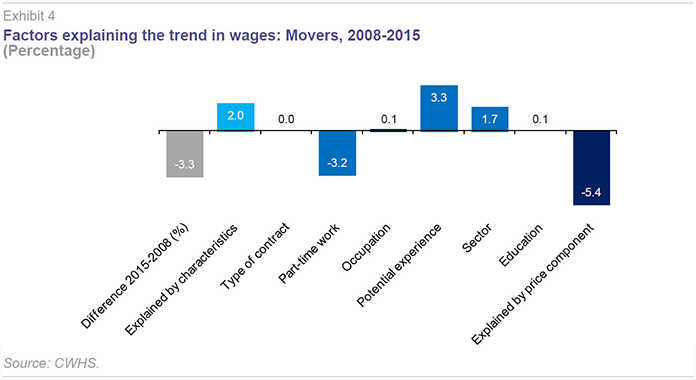
The analysis presented in Exhibit 4 debunks some of the myths about the recent trend in wages in Spain. For example, it tells us that the decline in income is not because of the creation of jobs in sectors that have traditionally paid badly. To the contrary. Recall that a significant number of the jobs destroyed were lost in the traditionally low-paying construction sector. Nor is it attributable to the temporary nature of the new contracts being signed. While it is true that most of the new contracts are temporary, that was already the case before the crisis; in fact, the breakdown of jobs by contract type looks very similar in 2015 as in 2008 (in Exhibit 4, ‘type of contract’ is scantly significant as an explanatory variable). The Spanish Labour Force Survey, conducted quarterly, shows that exactly 25% of jobs were temporary in the last quarters of both 2008 and 2015. In reality, the relative weight of temporary jobs declined during the worst years of the recessions as these jobs were the hardest hit. Their relative weight has since recovered to 2008 levels thanks to the economic rebound and the creation of new jobs in 2014 and 2015.
The analysis shown in Exhibit 4 does corroborate the importance of one of the main suspicions regarding the downtrend in wage income: the incidence of part-time work arrangements. It also highlights the importance of the price factor, which is difficult to measure using the traditional statistics. This price factor could change going forward if the general labour market conditions were to improve, a development that still looks a ways off considering the fact that the unemployment rate is still at 18.7%.
Exhibit 5 provides the same analysis but from a slightly different perspective, zooming in on the new contracts signed. It could be the case that the financial terms enjoyed by the movers deteriorated not so much because they had to change jobs but rather because of low bargaining power in their current positions (a reflection of job insecurity and involuntary mobility). Indeed, the analysis provided in Exhibit 4 suggested that the profile of the new jobs should have led to higher job remuneration rather than lower pay.
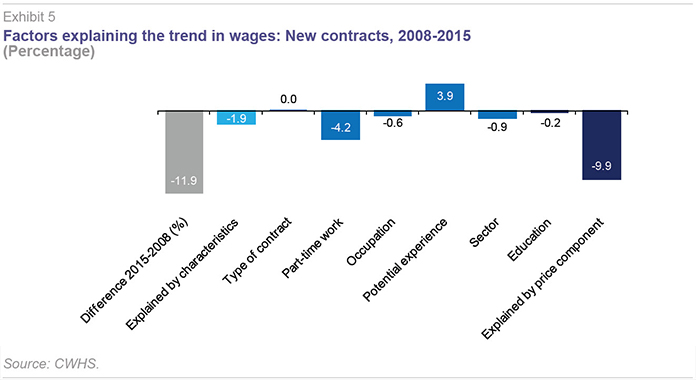
Exhibit 5 compares the characteristics of the new contracts signed in 2015 and the remuneration earned for those characteristics with those signed in 2008. The analysis confirms in broad terms the message provided by Exhibit 4, with the sole exception of the sector component. It is important to highlight the magnitude of the effects, which is much higher than in Exhibit 4. The new contracts entail a reduction in income (relative to the new contracts signed in 2008) of nearly 12%. This reduction is explained mostly by the price factor (-9.9%). The sector component is scantly significant, as is the type of contract, as the large majority of new contracts were and remain temporary. The weight of the price factor suggests that those who had to change jobs suffered heavy pay cuts not only because of the characteristics of their new jobs but above all because of the loss of vested rights in their old jobs and the fact of having to assume lower remuneration than other wage earners in similar work.
Exhibit 6 illustrates that this penalisation arises at the company level and is therefore not attributable to the fact that the new contracts are being signed at companies that pay less. Exhibit 6 shows the standard deviation (a measure of dispersion) of the unexplained part of wages at the company level. This measure of dispersion is obtained after estimating daily wages using regression analysis which controls for the characteristics of the employee (age, education level), job (type of contract, type of workday, employment level) and employer (sector). It also includes fixed company effects to control for all company aspects (
e.g., size, average productivity) which could have an impact on average wage levels. The standard error represents the unexplained part of the wage regression equation. Exhibit 6 shows the dispersion of this component for the subgroup of companies with over 1,000 observations in the database.
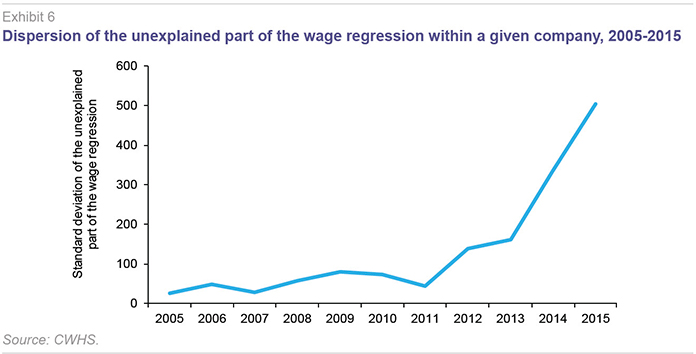
The exhibit clearly shows a very significant increase in the wage dispersion that is not explained by the characteristics of the firm or employee. This increase begins in 2012, perhaps as a result of the labour market reforms undertaken that year, and accelerates during the last two years in our sample, which is when job creation picks up against the backdrop of economic recovery.
First-time contracts
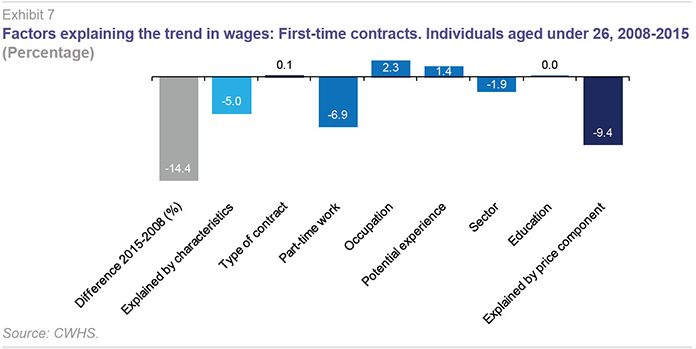
Exhibit 7 illustrates the specific case of the so-called first-time contracts. This analysis includes individuals aged under 26 as the sub-sample. These are the first employment contracts obtained by young individuals when joining the labour force at the start of their working lives. Because these individuals do not have prior experience or human capital specific to the company, they are more exposed to changes in general labour market conditions. The question then is how do these contracts differ from those signed before the crisis broke out in 2008. The snapshot provided by Exhibit 7 is similar to that depicted by the new contracts (Exhibit 5) but with adverse effects of greater magnitude. Thus, the first-time contracts signed in 2015 entail an average wage penalty of 14% relative to those signed in 2008. Once again, the vast majority of this penalisation is explained by the price component (-9.4%) and the type of workday (-6.9%). Neither the sector component nor the type of contract is statistically significant.
Factors explaining the difference in annual income between 2008 and 2015
The exhibits above outline the daily wage dynamics and the factors explaining the difference between 2008 and 2015. That analysis omits an aspect of potential importance in the case of the Spanish job market: the number of days worked during the year. Annual wage income can fall not only because of a drop in daily wages but also because of a drop in the number of days worked over the course of the year. The fact that the economic recovery has brought with it very unstable and short-lived contracts in which employees are forced into episodes of joblessness on a sporadic basis, sometimes having to juggle several jobs at once to make ends meet, has been much criticised.
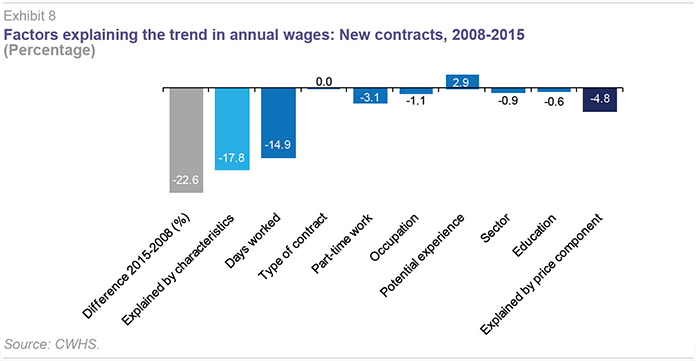
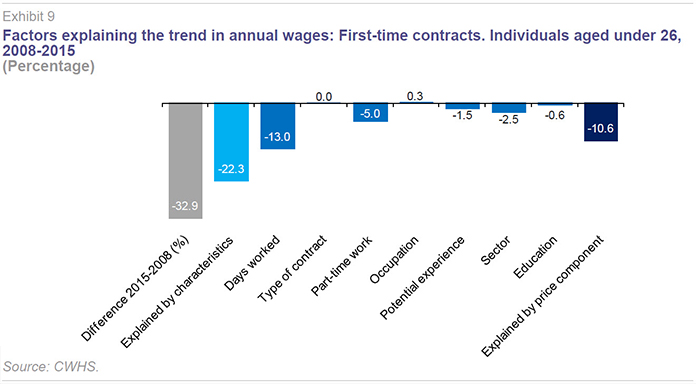
Exhibit 8 repeats the above analysis for new contracts (Exhibit 5), this time using annual income in the main job as the dependent variable. The contrast with Exhibit 5 is noteworthy. Whereas the daily wages associated with new contracts signed in 2015 were 11.9% below those of the contracts signed in 2008, the reduction doubles when measured in terms of annual earnings, to 22.6%. This is due, above all, to a smaller number of days worked in the year in those new jobs. This component explains over half of the total loss (-14.9%). The adverse price effect continues to play a role (-4.8%), as does the incidence of part-time arrangements (-3.1%). In the case of first-time contracts (Exhibit 9), the reduction in annual earnings rises to 33%. The lower number of days worked alone implies a reduction in annual income from the main job held of 13%, while the fact of working part time and in a given sector accounts for an aggregate drop of 5.0%. Virtually all of the rest of the loss of annual earnings is due to the price component (-10.6%).
Conclusions
The Spanish labour market appears to be gradually recovering from the deep crisis suffered between 2008 and 2013. Of the 3.6 million jobs destroyed during those years, a little over half have been recovered. However, these new jobs, created since 2014, are substantially different from those in existence before the start of the economic crisis. The analysis of the data corroborates some of the pre-existing ideas regarding the dynamics of
the job market in recent years: the significance of part-time arrangements and the precarious nature of the new contracts are resulting in fewer days worked a year. However, there are other aspects that contradict some of these beliefs. The new contracts are not more temporary than they used to be. Although most are temporary, this was also the case before the crisis. Nor would it appear that the sector distribution of the new contracts is significantly biased towards less productive, low-income sectors, particularly considering the sectors from which many of the workers signing these new contracts came from. The results do show that employees with new contracts are earning less in jobs with similar characteristics and within a given firm. This reduction in pay evidences the new labour market conditions and is mainly affecting the individual who are being forced into new jobs and the young people joining the labour market for the first time.
Notes
The CWHS-2015 is a random sample of approximately 4% of the entire adult population which was either in work in 2015 or was receiving some form of benefit from the Social Security that year. For that sample of workers, there is information for their entire work histories, including the characteristics of the companies and sectors in which they have worked.
The age limit of 55 reflects the advisability of removing individuals who could be affected by early retirement schemes from the analysis. For those individuals, the economic environment may have heavily influenced their decision as to whether or not to participate in the labour market, possibly creating bias.
The wage information comes from Social Security contribution databases which are delimited at the upper and lower limits. As a result, for most of the descriptive analysis, the median is shown and the upper and lower deciles omitted.
Annual income refers to job holders’ main job and is deflated for CPI and expressed in 2008 euros.
Although it would be optimal to be able to study hourly wages, the CWHS provides only approximate information for the number of hours worked, the daily wage calculations being more reliable.
References
BENTOLILA, S. (2017), “Los salarios en la recuperación: ¿polarización?,” [Wages during the recovery: polarisation?] nadaesgratis.es, May 25th 2017.
GONZÁLEZ, L. (2017), “Apuntes sobre la distribución salarial,” [Notes on wage distribution] nadaesgratis.es, May 15th 2017.
Daniel Fernández Kranz. IE Business School