
Spain’s VAT tax burden
in the wake of the recent economic crisis
Spain is among the EU-15 countries that has increased its standard VAT rate the most between 2002-2016. However, the high percentage of items still taxed at the reduced and super reduced VAT rates pose an obstacle to increasing VAT revenues as a percentage of GDP.
Abstract: As a result of the crisis, VAT revenues plummeted by 40% in Spain between 2007 and 2009. The reforms undertaken in 2010 and 2012 attempted to shore up VAT revenues by increasing the standard rate by five points and the reduced rate by three. These hikes, the most significant implemented across the EU-15 during the crisis, meant that by 2014, revenues from VAT receipts were once again above pre-2008 levels. In macroeconomic terms, the above-mentioned reforms pushed the VAT tax burden back up to the 2006 level (6.2%), albeit still well below that of other countries, such as France (6.9%), Germany (7.0%) and Portugal (8.5%). The cyclical effect is set to continue to drive VAT receipts higher although the high percentage of items taxed at the reduced and super-reduced rates of VAT pose a serious obstacle to increasing revenues from this tax relative to GDP.
In macroeconomic terms, a comparison between 2007 and 2015 suggests that the effective average rate borne by Spanish households has increased by 1.5 points. The results of the analysis also reveal that VAT is, in terms of permanent income, progressive, albeit becoming less progressive between 2007 and 2015.
Introduction
In 2016, Spain collected 62.85 billion euros of value-added tax (VAT) (AEAT, 2017), which was less than the 72.42 billion euros contributed by personal income tax (PIT), but very significantly more than the amount collected via corporate income tax and the various special duties, which generated revenues of 21.68 billion euros and 19.87 billion euros, respectively. It is fair to say that VAT is a pillar of the Spanish tax system even though the recent economic crisis shook its revenue-generation capacity to the core.
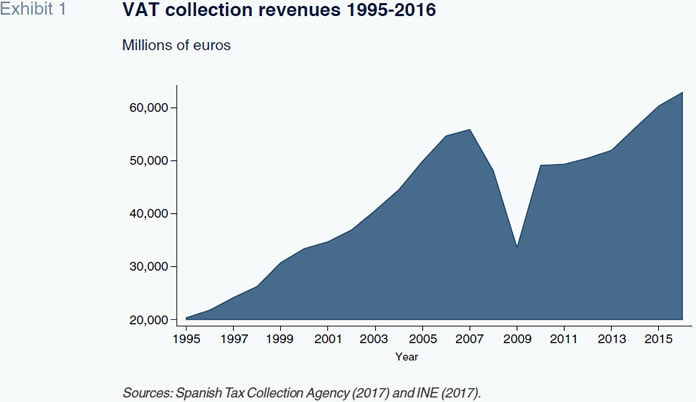
Prior to the crisis, VAT receipts had peaked in 2007 at 55.85 billion euros, which was equivalent to 28% of all tax collected by the state. The economic crisis had a dramatic effect on the collection of this tax, which dropped to 33.57 billion in 2009. In short, the first two years of crisis translated into a cumulative reduction in VAT revenues of 22.28 billion euros. In other words, VAT revenues dropped by 40% between 2007 and 2009. This collapse in tax revenues played an important part in the public deficit of 2009 which hit a record high in recent Spanish history of 10.9% of GDP.
The slump in VAT collection sparked intense debate about what measures were needed to structurally improve this tax’s revenue generation capacity. The OECD, the IMF and the European Commission presented alternatives for reconfiguring the rate structure (between 1995 and 2010, there were three VAT rates in Spain: the standard rate of 16%; a reduced rate of 7% and a super-reduced rate of 4%. Precisely, lower-income households consume a greater proportion of goods taxed at the reduced and super-reduced rates. As a result, as we show below, the VAT is a progressive tax.)
[1]. Firstly, those proposals consisted of raising the standard rate of 16%, which at the time was one of the lowest in the European Union (15% in Luxembourg). The second proposal was to restructure – and even eliminate – the reduced rate structure, given its cost in terms of foregone revenues
[2]. For illustrative purposes, the general state budget for 2017 estimated that the reduced and super-reduced rate of VAT would imply a tax cost of 11.09 billion euros, equivalent to 16.4% of budgeted VAT revenues (Spain’s Ministry of Finance and Civil Service, 2017)
[3] [4].
In the context of high public deficits, the governments of Zapatero and Rajoy proceeded to raise the standard and reduced rates twice in a row, while leaving the super-reduced VAT rate intact
[5]. The first of the above-listed reforms took effect in September 2010, whereas the second was implemented less than two years later, in July 2012. The reforms of 2010 had the effect of increasing the reduced rate from 7% to 8% and the standard rate from 16% to 18%. Those of 2012, meanwhile, hiked the reduced rate to 10% and the standard rate to 21%. In short, as a result of these changes, VAT rates in Spain rose sharply: by 3 points in the case of the reduced rate and by 5 in the case of the standard rate. In fact, between 2008 and 2013, Spain was the EU-15 state in which both reduced and standard rates were increased the most (for more details, refer to Romero and Sanz, 2013). Spain’s prevailing rate of 21% is very close to the EU-15 average, which is 21.6%; in 10 of these 15 countries, the standard VAT rate ranges between 20% and 23% (European Commission, 2016).
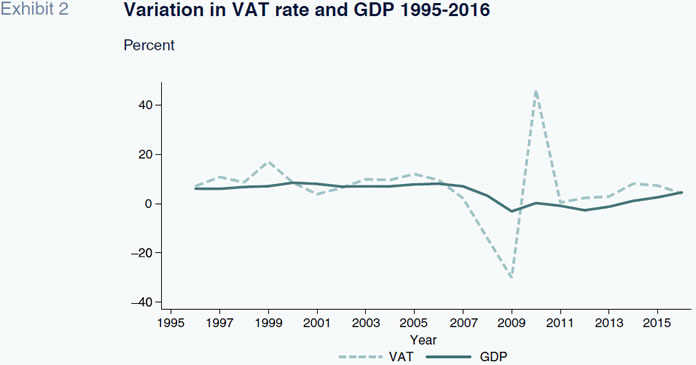
The reforms of 2010 and 2012 helped replenish the revenue level observed prior to the crisis. As shown in Exhibit 1, VAT receipts topped those of 2007 for the first time again in 2014, at 56.17 billion euros, having fallen by 14% and 30%, respectively, in 2008 and 2009 (Exhibit 2). By 2016, VAT revenues had risen to 62.85 billion euros, up 12.5% from the all time high of 2007
[6]. Against this backdrop, this paper focuses on two matters. Firstly, from a macroeconomic perspective, it analyses the VAT tax revenue-to-GDP in the wake of the reforms of 2010 and 2012. We attempt to show how much this tax’s incidence has increased in comparative terms. Secondly, taking a microeconomics approach, we analyse the way the effective VAT tax burden has been borne by Spanish households before and after the reforms. To this end, we compare how the situation has evolved between 2007 and 2015.
Trend in VAT tax revenue-to-GDP: A comparative analysisThe VAT tax incidence is estimated by relating the revenues effectively collected in respect of that tax to gross domestic product (GDP). The resulting ratio gives us an idea of the revenues the tax is capable of generating in terms of the country’s output during one year. The ratio itself, whether high or low, is not sufficient to tell us whether or not the tax is progressive; this task requires micro data to map the distribution of effective rates by income brackets. VAT revenues, the numerator in our formula, depend on the rates levied and the weight of the various products or services charged at the various rates with respect to the taxpayer’s total end consumption. The higher the weight of products carrying reduced rates (or exempted from VAT entirely), the higher the associated tax cost and the lower the corresponding tax receipts
[7].
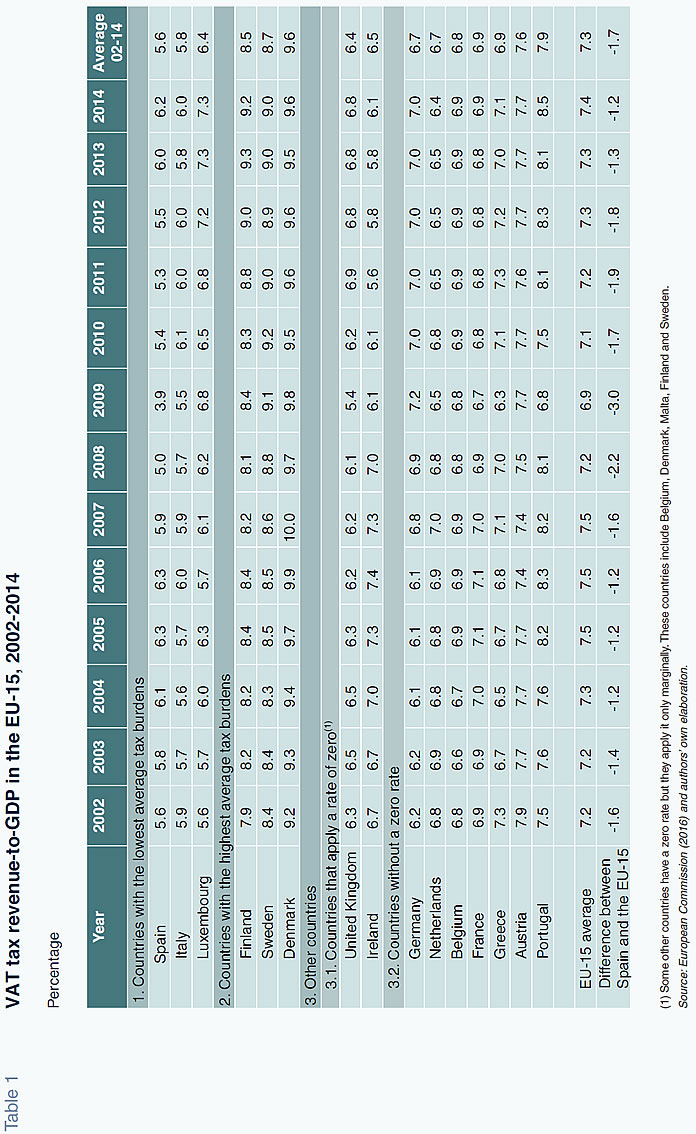
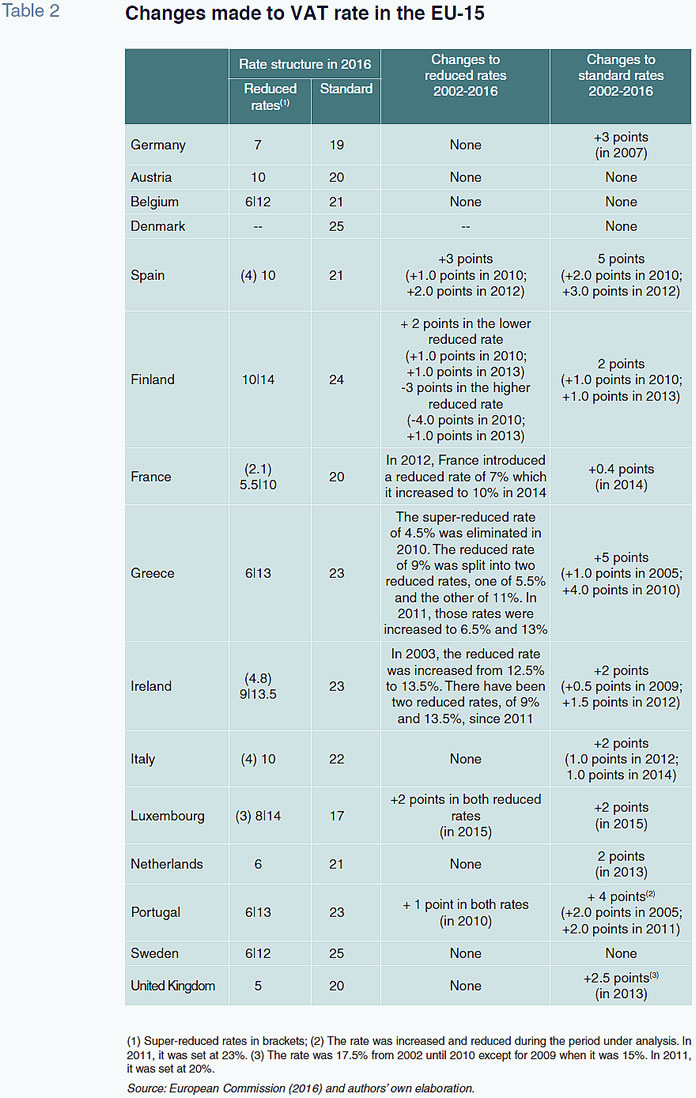
Table 1 compares the VAT revenue-to-GDP in Spain with the EU-15 average using the most recent statistic available (2002 - 2014). The countries included in that table have been classified into three groups: (i) those with lower tax burdens, including Spain; (ii) the Nordic countries which bear the highest tax burden; and, (iii) countries with intermediate tax burdens (separating the UK and Ireland from the rest as these countries unusually apply a rate of zero to a high number of goods and services). Table 2 provides additional insight by illustrating the changes in VAT rates in the EU-15 member states. Coinciding with the crisis of 2008, most of the EU-15 member states increased their VAT rates- standard and reduced – in order to maintain or replenish their revenue levels. Along with Greece, Spain was the EU-15 country that increased its standard rate the most between 2002 and 2016: by 5 points in total. Next came Portugal, which increased its standard rate by 4 points over the same timeframe. In the other countries, the standard rate was increased as follows: by 0.4 points in France; 2 points in Finland, Italy, Ireland, Luxembourg and the Netherlands; 2.5 points in the UK; and 3 in Germany.
The prevailing Spanish rate of 21% coincides exactly with that in effect in the Netherlands and Belgium, and is slightly higher than that of Germany (19%) and Austria (20%). In 2014, these last four countries presented higher tax revenue-to-GDP ratios than Spain (6.2%), particularly Belgium (6.9%), Germany (7.0%) and Austria (7.7%). As with the standard rate, Spain topped the increases in the reduced rate in the EU-15, raising it by 3 points.
As shown in Table 1, the average VAT revenue¬to-GDP ratio stood at 5.6% in Spain between 2002 and 2014. That ratio is 1.7 points below the EU-15 average of 7.3%. After the two VAT reforms, the difference in the tax burden with respect to the EU-15 average has diminished: from 3 points in 2009 to 1.2 points in 2014 (which coincides with the gap prevailing from 2004 until 2006). According to the Table, the group of countries presenting the lowest average tax burden between 2002 and 2014 was that comprising Spain (5.6%), Italy (5.8%) and Luxembourg (6.4%). At the other end of the spectrum are the Nordic countries, which present the highest tax burdens. This ranking is topped by Denmark, with an average of 9.6%, followed by Sweden and Finland, with ratios of 8.7% and 8.5%, respectively. The information presented in Table 1 shows that between 2002 and 2014, the VAT tax burden in the Nordic countries was an average of 3 points higher than that observed in the group comprising Spain, Italy and Luxembourg. The countries included in these two groups share certain characteristics with respect to how the tax is designed that are useful in understanding the sharp prevailing differences in their respective tax burdens.
As for the VAT characteristics of the EU-15 countries with the lowest tax burdens – Spain, Italy and Luxembourg – we would highlight three traits: Firstly, these countries present the lowest percentage of goods and services taxed at the standard rate: 46% in Spain compared to an EU-15 average of 69% (European Commission, 2004). Secondly, Spain and Luxembourg are the EU-15 member states with the lowest standard rate. In Spain, the standard rate was 16% until the reforms of 2010, just one point above the 15% minimum allowed in Community law. Luxembourg had a rate of 15% until 2015, when it increased it to 17%. Thirdly, Luxembourg, Italy and Spain have super-reduced rates of VAT. This rate is 3% in Luxembourg and 4% in Spain and Italy. In Luxembourg a very wide variety of goods are covered by the super-reduced rate, including food, non-alcoholic beverages, children’s clothing and footwear, water, certain pharmaceutical products, certain medical equipment for disabled persons, domestic passenger transport, books and newspapers, cultural events, hotels and restaurants (excluding alcoholic beverages), telephony services and cultural services. The list of goods that carry the super-reduced rate is much smaller in Spain and Italy and mainly includes certain foods, some medical equipment for disabled persons, books and newspapers.
As for the characteristic traits of the EU-15 states with the highest tax burdens – Denmark, Sweden and Finland – we highlight two: First, those states are among the EU-15 countries with the highest percentage of goods and services taxed at the standard rate: 100% in Denmark and very close to 80% in Sweden and Finland (European Commission, 2004). Secondly, these countries’ standard VAT rates are the highest in the EU-15. Since 2016, this rate is 25% in Denmark and Sweden and 24% in Finland. Denmark is an exception in the EU-15 as it applies a single standard rate of 25% to the purchase of all goods and services
[8]. Finland and Sweden, however, each have two reduced rates (10%|14% and 6%|12%, respectively). In those two countries, the reduced rates apply to cultural services, hotels, restaurants, passenger transportation, books, water, food
[9] and, in the case of Finland, medicines.
In short, the combination of a low standard rate coupled with the existence of one or more reduced rates applicable to a higher percentage of goods and services pose an insurmountable barrier to pushing VAT revenue-to-GDP towards the 7% mark
[10]. That level is indeed the 2002-2014 average for the group of countries denominated “Other countries without a zero rate” in Table 2. This group includes Central European countries such as Germany, Netherlands and Austria which present tax burdens ranging from 6.7% in Germany and Netherlands to 7.6% in Austria. Those three countries present standard rates ranging from 19% to 21% (close to the prevailing rate in Spain) but just one reduced rate of between 6% and 10%. One of the factors that explains the difference in tax burden in Spain compared to these Central European countries is that fact that the goods taxed at the super-reduced rate in Spain – food, medicine, books and newspapers – are taxed at reduced or standard rates in Germany, Austria and Netherlands (refer to Romero and Sanz, 2013).
Changes in the effective VAT rate borne by Spanish households
The VAT reforms of 2010 and 2012 were undertaken against the backdrop of a deep economic crisis. Suffice it to say that the unemployment rate went from 8.6% in 2007 to peak at 26.1% in 2013 (since which time it has been trailing lower, ending 2017 at 17.2%). The severest crisis in Spanish democracy has coincided with the highest VAT hikes since the tax was introduced into the Spanish tax system back in 1986. In this section, we use the micro-data from the Household Budget Survey (HBS) to analyse the change in the distribution of the effective VAT rates borne by Spanish households between 2007 and 2015. We will describe the changes in the effective tax burden borne by households during this period and estimate the effects on the progressivity of this tax by calculating the so-called Kakwani index.
The HBS is a representative sample of Spanish households containing disaggregated information about their shopping baskets – current expenditure on goods and services and the purchase of certain durable goods such as home appliances. The corresponding VAT rate (and excise duties) has been allocated to each of these goods in accordance with the legislation in effect in each year. We use this information to compute the effective rate per household by dividing the VAT tax burden by the total household expenditure gleaned from the HBSs. We use total expenditure as a proxy for permanent income (for a discussion, refer, for example, to Poterba, 1991). It is assumed that the VAT tax burden so calculated is that effectively paid by households in the absence of tax fraud or evasion – we assume the full passing on of the tax.
Table 3 presents the breakdown of the effective VAT rate by income interval.
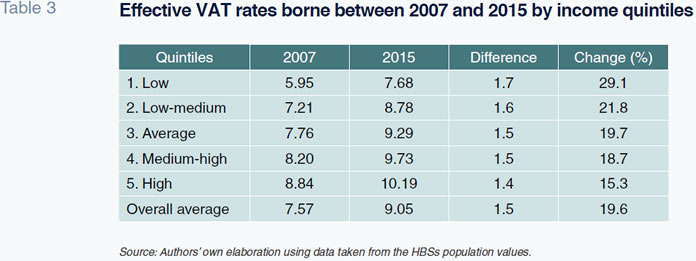
Table 4 complements this information by adding insight into the progressive nature and redistributive capacity of this tax using the so-called Kakwani and Reynolds-Smolensky indices. The effective VAT rate borne in 2007 was 7.57%; this had increased to 9.05% by 2015. This means that in eight years, the average VAT burden borne by Spanish households had increased by 1.5 points (19.6%). The rate structure reveals a higher burden the higher the income level in both 2007 and 2015. These results tell us that VAT was, in terms of permanent income, a progressive tax in both 2007 and 2015. In 2007, the average effective rate ranged from 5.95% for low-income households to 8.84% for high-income households. In 2015, the average went from 7.68% for low-income households to 10.19% for the wealthiest households. As a result, the average effective rate increased by 1.7 points for the households in the first quintile and by 1.4 points or the wealthiest households.
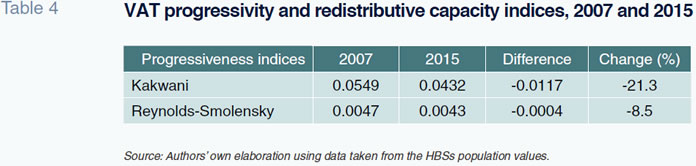
In relative terms, the effective rate increased by 29.1% in the first quintile, compared to an increase of 15.3% in the last quintile. In both absolute and relative terms, the lowest-income households were accordingly the hardest hit by the increased VAT tax burden. The results of the Kakwani index calculations show that VAT is progressive. However, it becomes less progressive between 2007 and 2015 (the index declines from 0.0549 to 0.0432). The results also show that the redistributive capacity of VAT is very limited, as shown in readings in the Reynolds-Smolensky index. Moreover, that redistributive capacity decreases between 2007 and 2015.
Conclusions
Following the reforms of 2010 and 2012, the reduced and standard VAT rates in Spain increased by 3 and 5 points, respectively. The reforms had the effect of increasing VAT revenue-to-GDP to 6.2% by 2014. In microeconomic terms, the tax reforms increased the effective rate of VAT borne by Spanish households by 1.5 points. The available empirical evidence shows that the elasticity of VAT revenues to household income is approximately one (Sanz et al., 2016). For this reason, it is likely that VAT revenues will increase relatively intensely in the coming years, assuming the Spanish economy continues to display the vigour anticipated for 2018 (2.6%); however, the VAT revenue-to-GDP ratio will not increase in tandem. To increase the ratio would require reducing the percentage of goods and services taxed at the super-reduced and reduced rates. Lastly, the results of this paper show that VAT is a progressive tax in permanent income terms.
Notes
The super-reduced rate is levied on bread, milk, eggs, fresh fruit and vegetables, medicines for human consumption, books and newspapers, among other items. The reduced rate is levied on meat, fish, processed goods, hospitality services, transportation and water, among other goods and services. Lastly, the standard rate is levied on all other goods, including energy goods, clothes, footwear, alcoholic beverages and tobacco products.
Offset, for example, by a reduction in Social Security contributions.
This figure should be grossed up by 7.85 billion euros of tax expense generated by the exemptions contemplated in tax legislation.
For example, the European Commission estimated that the elimination of the super-reduced rate in 2011 would allow Spain to reduce the standard rate from 18% to 12.7% (European Commission, 2011).
The reforms of 2012 also modified the taxes levied on certain services, which went from being taxed at the reduced rate to the standard rate; these services included tickets for cultural events (cinema, theatre, dance shows, concerts), veterinary services, funeral services, hairdressing services and the purchase of fresh flowers. In 2017, the rate levied on performing arts shows was once again switched back to the reduced rate.
From the budget standpoint, the growth in VAT collection is good news for a country such as Spain which has been going to lengths since 2008 to bring its deficit within the required 3% threshold. Note that there is consensus among the analyst community in Spain that the country’s public deficit will fall to 2.2% in 2018 (Funcas, 2018).
The size of the shadow economy and its incidence on the scale of tax fraud is a key factor in VAT collection. On average between 2002 and 2014, the EU-15 countries with the smallest shadow economies were Austria (8.9%), Luxembourg (8.9%), Netherlands (10.5%) and the UK (10.8%), while those with the biggest were Spain (19.8%), Portugal (19.9%), Italy (22.6%) and Greece (25.4%) (Schneider et al., 2015). It is also worth considering the impact on tax collection of tax evasion and corporate bankruptcies.
With the exception of newspapers, magazines and passenger transport, which are exempted.
Some foods in the case of Sweden.
The effect that a small-sized shadow economy has on the VAT tax burden is clear if we compare Spain with the UK: the weight of the black economy in these two countries is 19.8% and 10.8%, respectively (Schneider et al., 2015). The UK taxes a high number of goods and services at a rate of zero (most food, medicines, medical equipment for the disabled, water, new houses, passenger transport, books, newspapers and children’s clothing and footwear). It also taxes a high number of goods and services at the reduced rate of 5%, including electricity, gas and gas-oil for domestic use. Nevertheless, the average tax burden in the UK between 2002 and 2014 was 0.8 points more than that of Spain.
References
AGENCIA ESTATAL DE ADMINISTRACIÓN TRIBUTARIA (2017), Historical series of tax revenue figures, available at http://www.agenciatributaria.es/AEAT. internet/datosabiertos/catalogo/hacienda/Informe_ mensual_de_Recaudacion_Tributaria.shtml.
EBRILL, L.; BODIN, J.-P.; KEEN, M., and V. SUMMERS (2001), The Modern VAT, Washington: International Monetary Fund.
EUROPEAN COMMISSION (2004), VAT indicator, Working paper, 2. Luxembourg: Publications Office of the European Union.
— (2011), A retrospective evaluation of elements of the EU VAT system, Luxembourg: Publications Office of the European Union.
— (2016), Taxation trends in the European Union, Luxembourg: Publications Office of the European Union.
FUNCAS (2018), “Spanish Economic Forecasts Panel, January 2018,” Spanish and International Economic and Financial Outlook (SEFO), January 2018.
INSTITUTO NACIONAL DE ESTADÍSTICA (2017), Contabilidad Nacional Anual de España, available at http://www.ine.es/dyngs/INEbase/es/operacion. htm?c=Estadistica_C&cid=1254736165950&menu=res ultados&idp=1254735576581
MINISTRY OF FINANCE AND CIVIL SERVICE (2017), Presentación del Proyecto de Presupuestos Generales del Estado 2017 [Presentation of the Draft State Budget for 2017], Madrid.
POTERBA, J. M. (1991), “Is the gasoline tax regressive?,” in Bradford D. (publisher), “Tax policy and the economy, Vol. 5, MIT Press: 145-164.
ROMERO, D., and J. F. SANZ (2013), “Changes in Spain’s VAT during the economic crisis. A comparative analysis,” Spanish Economic and Financial Outlook, 4: 5-15.
SANZ, J. F.; CASTAÑER, J.M., and D. ROMERO (2016), “Consumption tax revenue and personal income tax: analytical elasticities under non-standard tax structures, Applied Economics, 48: 4042-4050.
SCHNEIDER, F.; RACZKOWSKI, K., and B. MRÓZ (2015), “Shadow economy and tax evasion in the EU,” Journal of Money Laundering Control, 18: 34 - 51
Desiderio Romero-Jordán. Universidad Rey Juan Carlos
José Félix Sanz-Sanz. Universidad Complutense de Madrid