The relationship between the recovery in Spain’s current account and labour productivity
Since 2013, Spain’s current account entered into surplus – reversing a recent history of deficits. Unlike the years prior to the crisis, an apparent rise in labour productivity across most sectors is presumably underpinning recent favourable developments in the current account.
Abstract: Spain’s current account deteriorated sharply between 2003 and 2007 but went on to recover just as swiftly, entering into surplus territory in 2013, where it has remained since then – an unprecedented phenomenon in Spain’s recent economic history. An analysis of Spain’s current account dynamics dating back to 2000 relative to the main eurozone benchmark economies (Germany, France, Italy and the Netherlands) reveals that the biggest component, the balance of trade in goods, continues to present a deficit, despite having narrowed in recent times. The goods trade deficit is significant because it sets the Spanish economy apart not only from the eurozone’s most competitive economies, Germany and the Netherlands, but also Italy. As for apparent labour productivity, the results reveal two discrete patterns, pre- and post-crisis. Before the crisis, the Spanish economy was growing because the number of workers and hours worked were increasing but in the general absence of any improvement in apparent productivity. Since the crisis, and although it is still too soon to make a definitive assessment of the situation, there are arguments to support the notion that productivity is rising in most sectors of the Spanish economy, presumably shoring up the current account.
Although the Spanish economy has exhibited a noteworthy recovery on a number of fronts since 2013, certain economic indicators, such as those related to the labour market, remain of the utmost concern.
One of the areas in which the improvement has been most significant is the current account, the snapshot of the country’s net economic position with the rest of the world. The current account deteriorated sharply between 2003 and 2007, plummeting from a deficit of 4% of GDP to 10%. However, it also recovered sharply thereafter, entering into surplus territory in 2013. The scale and speed of the adjustment in the current account in both directions makes Spain somewhat of an outlier relative to other advanced economies. This prompts an important question about the state of the Spanish economy, namely whether the observed adjustment in external imbalances is attributable to a structural change or rather to cyclical factors that could therefore be reversible (see ECB, 2014: 47-50 and 2015:1-3).
This paper attempts to provide information to help answer this question, albeit without purporting to constitute an exhaustive analysis. Firstly, the trend in the current account balance in Spain since 2000 is analysed relative to that observed in the other four major eurozone economies (Germany, France, Italy and the Netherlands, hereinafter, the EA4). The comparison is performed at the aggregate level and also for the main components of the current account balance. The goal of this comparative exercise is to better isolate the idiosyncrasies of the trend in Spain’s current account balance relative to current account patterns in comparable neighbouring economies. Against this backdrop, other economic data deemed necessary to analysing the current account dynamic, such as GDP growth and the unemployment rate, are also analysed.
Secondly, we attempt to relate the trend in the current account balance with the basic indicators of apparent labour productivity. To this end, we analyse the trend in labour productivity in terms of hours worked and number of employees at the sector level and also comparing Spain with the average of the four benchmark economies (EA4).
Trend in the current account balance in Spain
As shown in Exhibit 1, between 2000 and 2003 Spain’s current account balance hovered around a moderate deficit of 4% of GDP. In the years prior to the onset of the crisis, as a result of the exacerbation of several imbalances, both internal and external, the deficit gradually deteriorated, bottoming out at 10% of GDP in 2007.
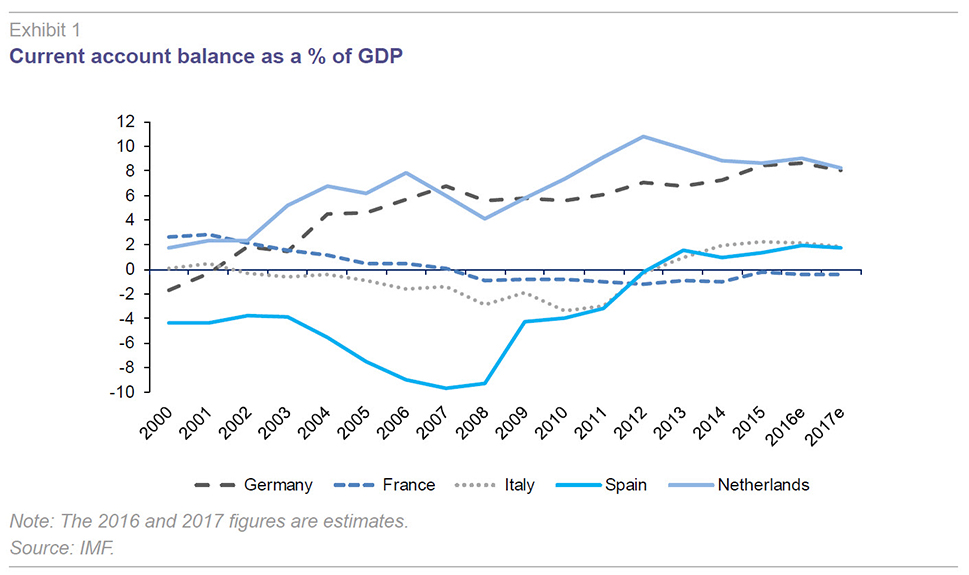
As is also observed in Exhibit 1, throughout the period analysed – 2000 to 2017 (the 2016 and 2017 figures are IMF estimates) – none of the other four EA4 economies presented a current account deficit of greater than 4%. In fact, the Netherlands recorded a surplus throughout the entire period and Germany was not far off. Moreover, both countries’ balances clearly improved over the horizon analysed. In contrast, France saw its current account balance erode slowly but surely although it has never presented a deficit of more than 1% of GDP. Italy’s current account deficit exceeded 2% of GDP during just three of the 18 years analysed.
This EA4 background paves the way for a better assessment of the trajectory of the current account balance in Spain. What is unusual about Spain’s situation relates not only to the years of high deficits (between 2004 and 2009) but also to the fact that in the run-up to that period (2000-2003), Spain presented a deficit that was not commensurate with that of a major eurozone economy.
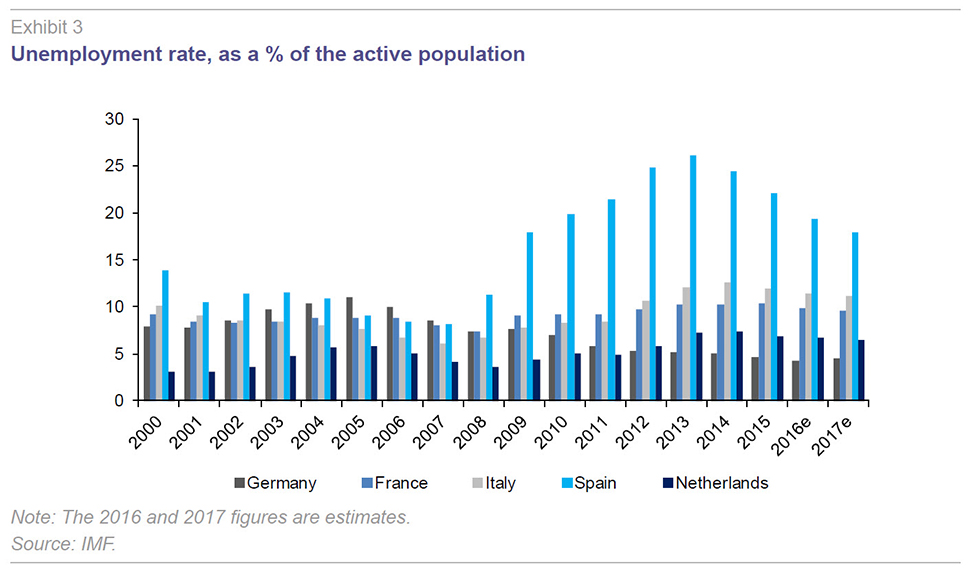
In order to better pin down the trend in the current account balances, it is useful to analyse the numbers in tandem with annual GDP growth (Exhibit 2) and unemployment rates (Exhibit 3).
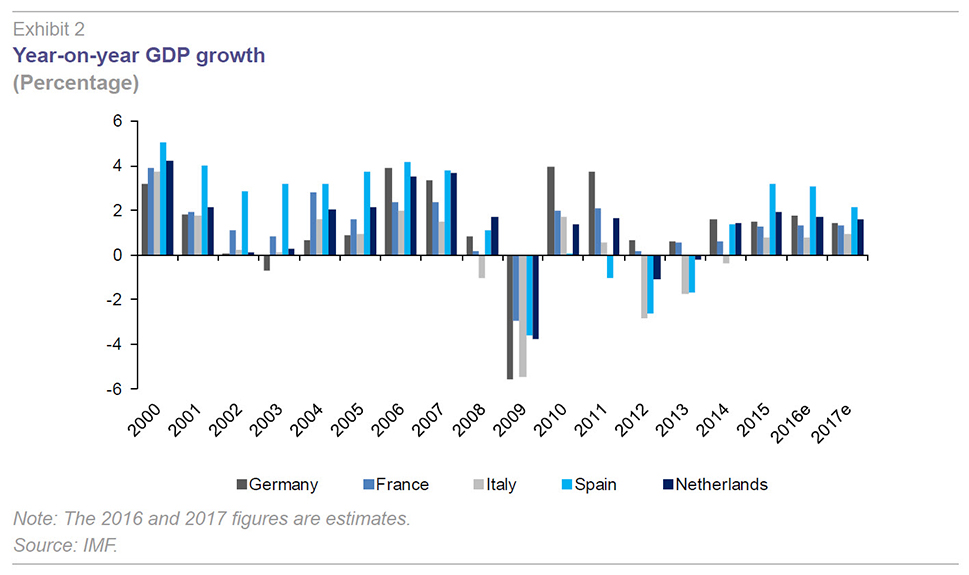
As shown in Exhibit 2, Spain is the country to have registered the fastest economic growth in both the run-up to the crisis (2000 - 2007) and, post-crisis, between 2015 and 2017 (the 2016 and 2017 figures correspond to IMF estimates). In fact, the numbers suggest that the Spanish “growth model” has differed from that of the rest of the EA4 economies both before and after the crisis, albeit following different patterns in each period.
Before the crisis, the growth model was based on a level of leverage and dependence on trade that were unusual for a major eurozone economy. In contrast to the EA4 economies, Spain presented a high-growth/high-current-account-deficit binomial. Since the crisis, the main difference is that Spain is once again growing faster than the EA4 economies yet also presenting unemployment rates that are almost triple the EA4 average (Exhibit 3). The binomial that identifies the Spanish case in this period is therefore high-growth/high-unemployment. For a detailed analysis of these matters, see Andrés and Doménech (2015), Xifré (2016) and García-Santana et al. (2016).
Components of the current account balance
The current account encompasses four balances: it is the tally of international transactions in goods and services, plus net income abroad and net current transfers (see Feenstra and Taylor, 2017 for a systematic and expanded explanation). The current account balance records total net flows of resources in and out of a country; each of the four sub-balances is also presented separately.
As the Exhibit shows, the only component of Spain’s current account balance that has been in surplus consistently over time has been the services trade balance, which evidences the net inflow of funds generated by tourist expenditure. The biggest determinant of the overall balance is the balance of trade in goods, i.e., net exports of merchandise, a component that has registered systematic and, in some years, very significant deficits (over 6% of GDP between 2004 and 2008). Although the goods trade deficit corrected sharply between 2009 and 2013, the data available for 2014 points to renewed widening.
The net income balance has also registered systematic deficits with somewhat of a tendency to widen in time, suggesting that the payments made by Spanish companies for the foreign resources they use (capital and labour) grow faster than the remuneration obtained for the use of Spanish resources by foreigners. The net current transfers deficit has also been widening, reflecting growth in remittances by immigrants in Spain to their home countries.
The trend and composition of the German (Exhibit 5.a) and Dutch current accounts (Exhibit 5.d) have multiple elements in common. In both instances, the overall balance presents a clearly positive trend throughout the period analysed, underpinned by a systematic and sizeable goods trade surplus of close to 10% of GDP in the Netherlands and 7% in Germany. In both nations, the trend in the net income balances has also been positive, with their respective surpluses widening over time (Germany has presented a net income surplus since 2004 and the Netherlands has presented a surplus under this account every year except 2008).
The erosion of France’s current account balance is attributable almost entirely to its burgeoning goods trade deficit. Having presented a surplus until 2003, France’s balance of trade in goods presented a deficit of around 3% of GDP in 2013 and 2014. In Italy, it is harder to establish a clear pattern. Perhaps the most remarkable trend is the fact that the overall balance has been relatively stable with both the surpluses and deficits (the latter more frequent than the former) contained at under 3% of GDP.
Trend in labour productivity and its relationship with the current account
What does the current account balance depend upon – particularly the balance of trade in goods, which, as we have seen – is its largest component? The factors that affect net exports, i.e., the difference between a country’s exports and its imports, are numerous. In general terms, it can be said that a country’s exports to the rest of the world depend on three key factors.
Firstly, on the products exported, in the broadest possible sense. By this we mean their value added (vertical diversification), the diversity of products within the export mix (horizontal diversification), the after-sales services accompanying these products, their technological component and any other attribute that makes them attractive in the international markets. Secondly, the prices of these products; all other attributes being equal, a product or service will sell better abroad if it costs less. Here it is important to note that if a product or service is exported to a jurisdiction with a different currency, what counts is the effective price, i.e., the price times that rate of exchange between the two currencies. Lastly, the third key driver of a country’s exports is external demand, which, ultimately, depends on the situation of the destination economies to which the exports of the companies in the country of origin are targeted.
This third factor, external demand, is exogenous and does not depend on the domestic economic conditions prevailing in the exporting country. In contrast, the first two factors are largely shaped by how the home economy is faring. Indeed, the production of value-added products and services at a competitive price is precisely what is known as an economy’s competitiveness.
Against this backdrop, the work performed recently by Crespo and García Rodríguez (2016) shows that Spanish exports are far more sensitive to changes in external demand than to changes in competitiveness. However, because the performance of external demand is exogenous, from the standpoint of the domestic economy, it makes sense to focus policy on the internal factors that have the biggest influence on competitiveness.
There is broad consensus that productivity is the most important of these factors. In this paper, we analyse the most basic, albeit most direct, measure of productivity: apparent labour productivity, which is defined as value added generated per unit of labour, the latter measured either in hours worked or number of workers. For a more precise analysis, this paper looks at productivity broken down by sector and, as in the earlier sections, in relation to the EA4, in this instance presenting the average for this group of four countries.
Table 1 and Table 2 provide the two main labour productivity indicators: gross value added or output per hour worked and gross value added per person employed, respectively. The figures are provided for the economy as a whole and broken down for a group of sectors (using the OECD’s ISIC Rev. 4 classification of economic activities) and for four periods of time: the full study span for which there is data available (2000-2015) and three sub-periods, namely the pre-crisis years (2000-2007), the crisis years (2008-2012) and the post-crisis years (2013-2015). For each period, the average rate of growth is presented as a percentage.
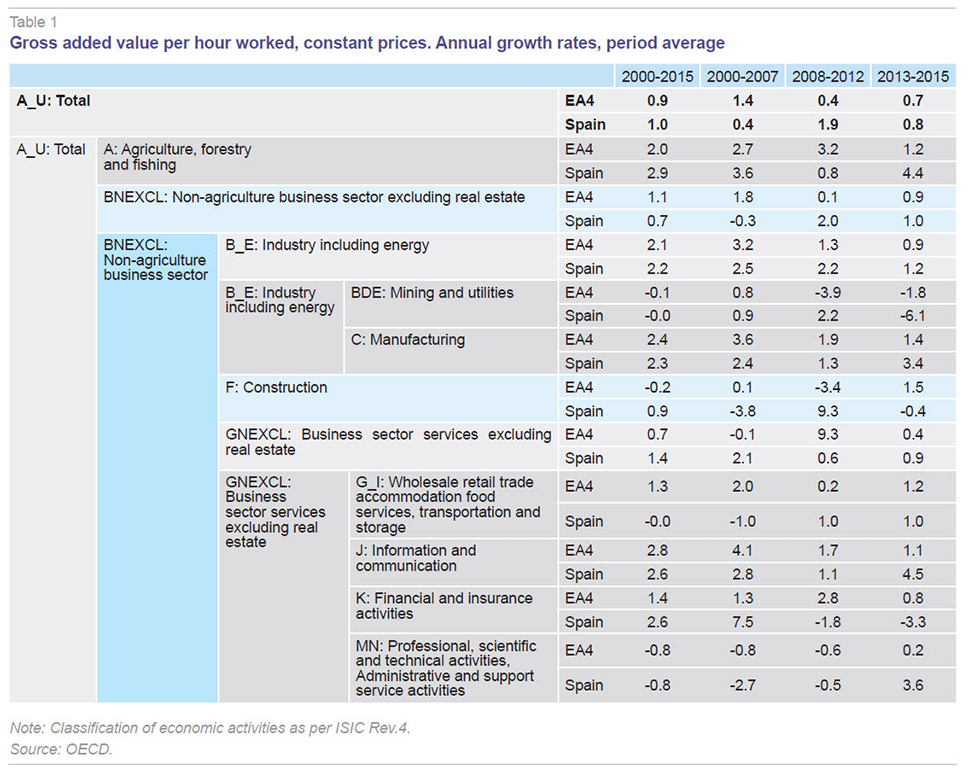
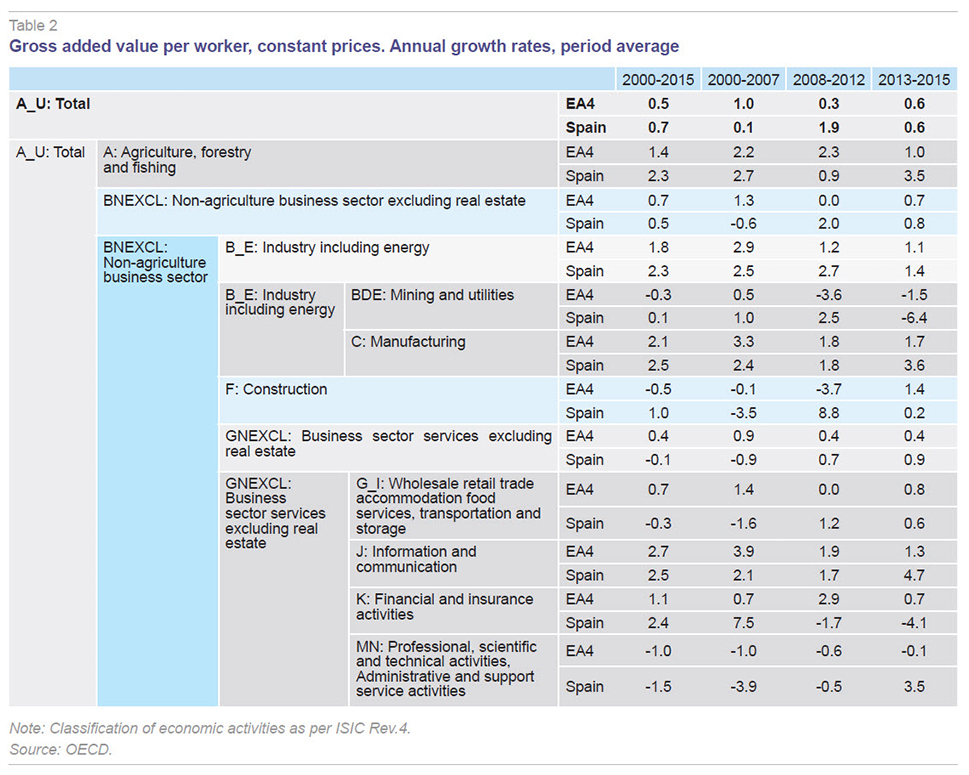
As illustrated in Tables 1 and 2, during the pre-crisis years, productivity across the Spanish economy as a whole rose on average by one percentage point less than the productivity gains recorded by the EA4, both in terms of hours worked (annual growth of 1.4% in the EA4 vs. 0.4% in Spain) and number of people employed (1.0% vs. 0.1%, respectively).
The productivity gap, i.e., the difference between productivity growth in Spain compared to the EA4, was relatively widespread sector-wise during the pre-crisis years but was particularly pronounced in the construction sector, professional services and scientific activities, trade and food service, information and communication activities, financial and insurance activities and the manufacturing industry.
The construction and professional services sectors stand out: in these two sectors average labour productivity growth was negative (-3.8% and -2.7%, respectively, by number of hours worked and -3.5% and -3.9%, respectively, by number of employees).
Table 3 and Table 4 provide complementary information for the purpose of analysing productivity growth as they present, using the same format as Tables 1 and 2, the changes in the number of hours and number of employees, respectively. In short, they isolate the change in the denominator of the apparent productivity equation, permitting analysis of the cause of a productivity gain in a given sector. Such a productivity gain can be the result of faster growth in output relative to the growth in labour units (whether hours or employees) or a drop in the labour units used in that sector.

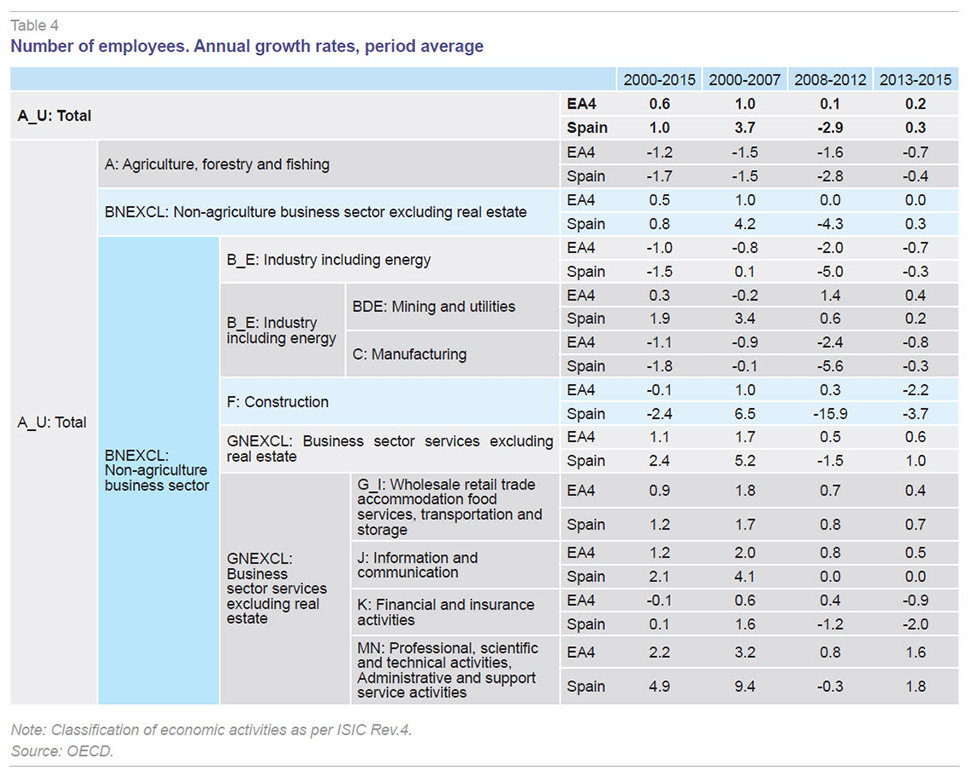
This analysis reveals how the number of labour units employed in Spain during the pre-crisis years (hours and workers) rose in all sectors except for agriculture (where they fell sharply) and the manufacturing industry (where they were relatively flat). Specifically, in the two sectors mentioned above that presented productivity losses, construction and professional services, the number of hours worked and number of people employed rose. The conclusion is, therefore, that the value added generated by these sectors grew by less than the additional human resources taken on.
A similar phenomenon, albeit less pronounced, is observed in the other main productive sectors listed above which, as already noted, presented lower average productivity growth relative to the EA4.
The key takeaway is, therefore, that during the pre-crisis years, economic growth in Spain was driven more by growth in the units of labour employed in the main economic sectors than to sector-specific productivity gains. In turn, this pattern helps to partially explain the current account deficits recorded during the period (Exhibit 1). As shown in Table 3, the number of hours worked in the Spanish economy as a whole increased at an average annual rate of 3.3%, compared to 0.5% in the EA4, while, looking at Table 4, the number of people employed increased by 3.7% per annum in Spain, compared to 1% in the EA4.
What form did the adjustment take and how has the relationship between productivity and the current account changed post-crisis?
The crisis years were marked by a widespread and pronounced drop in the number of labour units, measured by both hours and workers, deployed in virtually every productive sector (Table 3 and Table 4). The sharp contraction in the construction sector stands out: by 2013 this sector was using just 20% the amount of labour it had been using in 2008. Albeit without sustaining such a drastic contraction, the norm during the crisis years, as is well known, was a pervasive slowdown in activity. As a result, the apparent labour productivity ‘gains’ observed in certain sectors (Table 1 and Table 2) do not reflect an improvement in sector efficiency but rather a massive expulsion of labour resources.
During the post-crisis years, between 2013 and 2015, the figures reveal that labour productivity in Spain in aggregate terms has increased at roughly the same pace as in the EA4 in terms of both hours worked (Table 1) and number of workers (Table 2). This top line trend of productivity gains in line with those of the EA4 masks two sub-patterns: (i) sectors in which productivity growth is outpacing that of the benchmark economies (notably professional services, scientific activities and the manufacturing industry); and (ii) the sectors in which productivity growth its trailing that of the EA4 (notably the financial sector and construction industry).
In short, the most noteworthy aspect of the situation in Spain since the crisis is the fact that, in general, labour productivity gains are not being driven by a reduction in the number of units of labour the various sectors are using (in contrast to what happened during the crisis years). This indicates, therefore, that the foundations of the recovery in labour productivity in Spain are relatively solid, suggesting that the structural factor is outweighing cyclical factors. It is a little soon, however, to take a definitive position on this matter which would require a longer time horizon and more detailed analysis of the sector dynamics.
Conclusions
This paper analyses the trend in the Spanish economy’s current account, its main determinants and the sector dynamics underpinning the labour productivity trend.
Spain’s current account deteriorated sharply in the run-up to the crisis but went on to recover just as swiftly. Nevertheless, the analysis shows that the structural weak link in Spain’s current account balance remains the persistent goods trade deficit.
Given that the balance of trade in goods is determined by an economy’s competitiveness and this in turn depends, directly but not exclusively, on labour productivity, it is opportune to analyse the trend in the latter variable.
The information available suggests that the productivity trend has improved in most of Spain’s productive sectors in the wake of the crisis. This improvement may explain part of the high rates of GDP growth and the improvement in the current account balance being observed.
Nevertheless, important questions remain regarding how to get Spain’s labour market back on its feet as the strong growth, current account and productivity figures coexist with a rate of unemployment that is nearly three times that of its benchmark economies. Indeed, until the Spanish labour market begins to create jobs in the quantity and of the quality needed, it cannot be said that the economy is moving towards effective recovery.
ANDRÉS, J., and R. DOMÉNECH (2015), En busca de la prosperidad. Los retos de la sociedad española en la economía global del siglo XXI [In search of prosperity. The challenges facing Spanish society in the global economy of the 21st century], Ed. Deusto.
CRESPO, A., and A. GARCÍA RODRÍGUEZ (2016), “¿Ha mejorado la competitividad exterior gracias a la devaluación interna? [Has external competitiveness improved thanks to internal devaluation?]” Papeles de Economía Española, No. 150, 114-126.
EUROPEAN CENTRAL BANK (2014), Monthly Bulletin, January 2014.
— (2015), Economic Bulletin, Issue 4 / 2015.
FEENSTRA, R. C., and A. M. TAYLOR (2017), International Economics, Fourth Edition. McMillan.
GARCÍA-SANTANA, M.; MORAL-BENITO, E.; PIJOAN-MAS, J., and R. RAMOS (2016), Growing like Spain: 1995-2007, CEPR DP 11144.
XIFRÉ, R. (2016). Spain in the Wake of the Crisis: Reforms or Adjustment?, IESE WP 1141-E.
Ramon Xifré. Professor at ESCI-UPF and research fellow at the Public-Private Sector Centre at IESE