European banking models: Adapting to a new, complex operating environment
The post-crisis environment of falling interest rates, deleveraging, regulatory requirements and increased competition has forced banks to adapt their business models to maintain profitability. Against this backdrop, in Spain as well as the rest of the euro area, the structure of banks’ balance sheets has changed, with the relative weight of non-interest sources of income increasing.
Abstract: A new operating reality for European banks has forced change in the composition of both their banking activity and their income structure. Empirical evidence demonstrates how Spanish banks have adapted their business models in response to these changes relative to their euro area peers. In Spain, the retail banking model continues to dominate, although overall lending to the private sector fell largely due to deleveraging by non-financial corporations. Also, it is worth noting how the weight of sovereign debt on Spanish banks’ balance sheets has tripled, making it one of the countries with the fastest growth in sovereign debt holdings by banks within the euro area. Finally, both in Spain and the euro area, the decline in interest income and the slowdown in lending growth have undermined banks’ profits and obliged them to seek out non-interest bearing revenue streams, particularly by increasing fee income generating activities.
The recent financial crisis and the measures that have been taken to combat it have affected banks’ activity and their business models. The crisis has forced the private sector to undergo a deleveraging process with negative knock-on effects for banks’ activities, changing the composition of their balance sheets. The toughening up of banking regulation (including higher capital requirements, liquidity coverage ratios, a leverage ratio and loss absorbing capacity requirements) has also affected the structure of balance sheets, both on the liability (with a growing weight of own resources) and asset (discouraging activities which consume more capital) side. Furthermore, difficulties in accessing wholesale funding markets have led to an increase in the weight of more stable funding (deposits), altering banks’ funding structures. Finally, the excessive liquidity gap which many banks accumulated during the boom years, gave way to a period of sharply declining bank lending, which was necessary to bring down the excessive loan-to-deposit ratio.
In the European banking sector, the measures adopted by the ECB have also affected the composition of banks’ balance sheets, both through offering copious amounts of funding at a reduced cost (or even zero), as well as through assets purchase programmes. Part of the funding that was initially awarded did not bring about increased lending to the private sector but instead was used for purchases of sovereign debt. In addition, the continued downward reduction in interest rates, reaching negative rates in some parts of the yield curve, has negatively affected net interest income, obliging banks to seek more profitable activities as an alternative to interest income.
All of these factors have had an impact on European banks’ business models, with changes both in the composition of balance sheets, as well as in the income statement, illustrated by variations in the relative weight of different sources of income. Thus, the decline in net interest income and slower lending growth have undermined profits, requiring banks to seek out non-interest bearing revenue streams (such as bank fees and commissions).
Against this backdrop, the objective of this article is to analyse the changes in the business model of European banks, focusing on the Spanish banking sector in comparison to both the eurozone average and the main banking sectors (Germany, France and Italy). Aggregate balance sheets for the Monetary Financial Institutions of eurozone economies provided by the ECB have been used for this exercise, with structural changes being analysed over the period 2007-2016. Business model changes are also apparent in the revenue structure, which is analysed using ECB data for consolidated banking groups.
The article is structured as follows: The next section analyses the differences in specialisation of the Spanish banking sector in comparison with the eurozone average and the changes that have taken place from 2007 to 2016. The following section extends the comparison to the main European banking sectors (Germany, France and Italy) with the aim of identifying different types of business models and the changes that have taken place. The subsequent section focuses on analysing differences in the income structures of the euro area banking sector and the changes that took place during the crisis years. Finally, the article set outs the main conclusions.
Business models in the European banking sector: Recent changesIn the eurozone, and within Member States, financial institutions operate using different business models. However, at the aggregate country level, a specific type of banking specialisation tends to dominate in each banking sector.
[1] This can be observed from the structure of the balance sheet in each sector. In general, there are two main types of models: retail banking, characterised by a high proportion of loans and deposits and, therefore, of net interest income in total income; and investment banking, where service provision is the main source of revenue as opposed to interest income. In between both extremes, various groups of specialisation or business models can be found. For example, a recent ECB (2016a) analysis identifies up to seven groups using cluster techniques: medium-sized universal banks, small deposit-taking banks, specialised lenders with high market based-funding, large universal banks, medium-size universal banks, large international banking groups and investment banks.
The Spanish banking sector has a clear retail focus, as can be seen in the 2016 data set out in Table 1. Loans to the private sector account for 47% of assets (12.4 percentage points — pp — above the eurozone average) and private sector deposits represent 53.2% of total liabilities (15.2 pp more than the euro area).
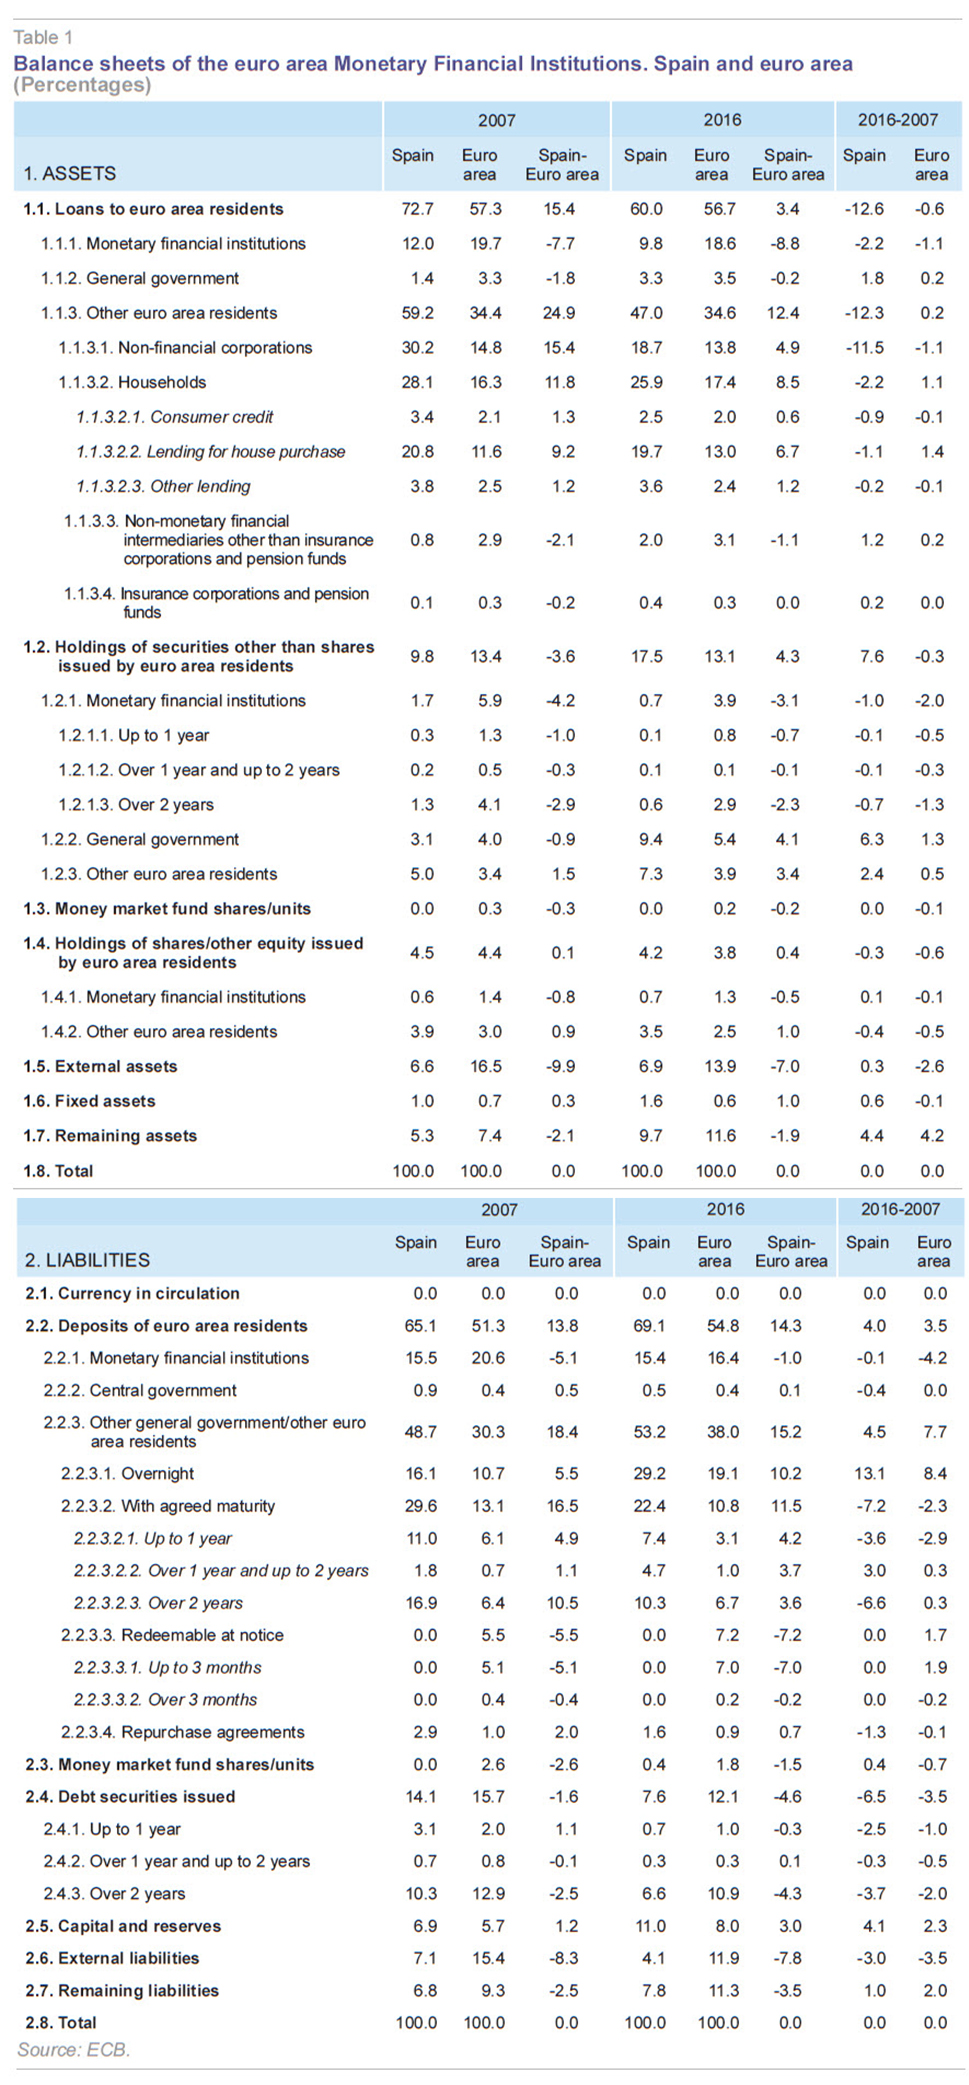
In terms of lending to the domestic economy, Spain also stands out for the higher weight of lending for house purchase, which accounts for 19.7% of total assets, compared to 13% in the euro area. Lending to non-financial corporations also represents a larger share in Spain (18.7% vs. 13.8%). This is a reflection of the proliferation of SMEs in our economy, which are highly dependent on bank financing.
Both sight (29.2% of total assets in Spain, compared to 19.1% in the euro area) and time deposits (22.4% vs. 10.8%) are much more important sources of funding for Spanish banks than debt funding, which has a lower weight in Spanish banks’ liabilities (7.6% vs. 12.1%). The Spanish banking sector is also relatively better capitalised. The ratio of own resources/assets stood at 11% in 2016 compared to 8% in the euro area.
The focus in this article is on the changes that have taken place in the business model of the Spanish banking sector within a wider European context since the start of the crisis, comparing the structure of the balance sheet in 2007 and 2016. The following messages emerge from this comparison:
- The deleveraging process in the Spanish economy is the main factor behind the 12.3 pp decline in the weight of private sector lending in total assets from 59.2% to 47%. Deleveraging has led to a 482 billion euros reduction in (mainly bank) debt between 2007 and 2016, or the equivalent of a 21% fall. The decline is primarily focussed in lending to non-financial corporations (whose weight in the balance sheet has fallen by 11.5 pp from 30.2% to 18.7%), given that lending to households only declined by 2.2 pp. These movements are in sharp contrast to the euro area banking sector, where lending to non-financial corporations fell 1.1 ppts, while lending to households rose 1.1pp. As a result, the difference between Spain and the euro area in terms of the weight of lending to the private sector on the balance sheet has narrowed by 12.4 pp to 2016.
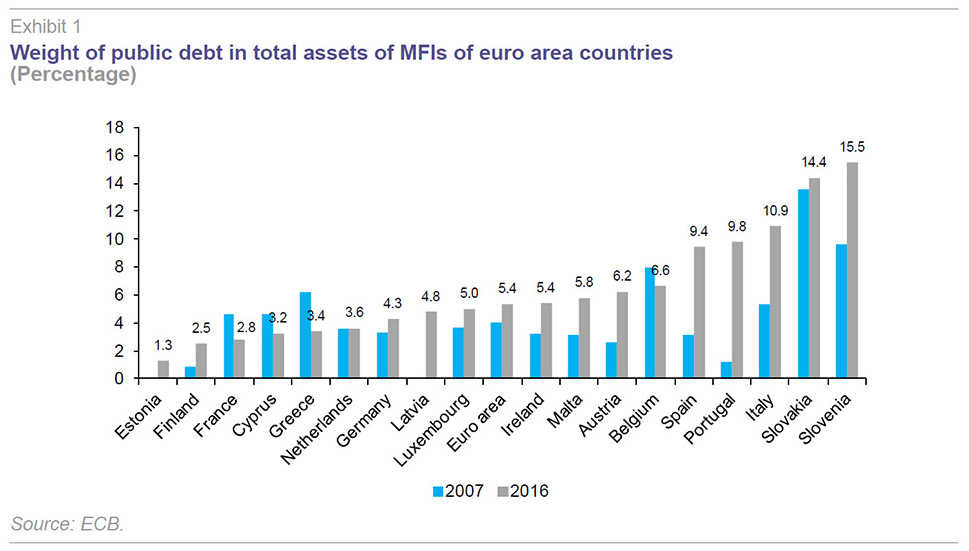
- Another noteworthy change in Spanish banks’ assets is the increase in the weight of investment in debt instruments, which have almost doubled their share in the balance sheet from 9.8% in 2007 to 17.5%. The increase in holdings of public debt is behind this growth, with Spanish banks’ sovereign debt holdings registering a threefold increase over the period to reach 9.4% in 2016. As can be seen in Exhibit 1, Spain comes second only to Portugal in terms of the increase in public debt in total bank assets registered from 2007 to 2016 (6.3 pp vs. 8.5 pp in Portuguese banks). Exhibit 1 also reveals that the Spanish banking sector has the fifth largest proportion of public debt in total assets amongst eurozone economies, after Slovenia, Slovakia, Italy, and Portugal.
- On the liability side, private sector deposits have increased their weight in the balance sheet by 4.5 pp from 2007 to 2016. Taking into account the decline in lending, the Spanish banking sector’s liquidity gap has improved significantly from a positive loan-deposit gap of 240 billion euros in 2007 to a negative difference of 170 billion euros in 2016. In other words, in 2007 for every Euro in private sector deposits, Spanish banks were providing 1.15 euros’ worth of credit. In 2016, the ratio stood at 0.88, which is below the 0.91 for the euro area as a whole.
- Sight deposits have gained particular momentum in Spain, increasing their weight in the balance sheet by 13.1 pp to 29.2%, well above the 19.1% they represent in the euro area banking sector. Meanwhile, the relative weight of time deposits has fallen (to 22.4%), though still remaining twice as important as in the euro area (10.8%). The decline in interest rates on time deposits towards close to zero explains both the lower weight of this type of deposit in the balance sheet as well as the increase in current accounts.
- Another important feature of Spanish banks’ liabilities is the loss of weight of funding through debt issuance, which has declined from 14.1% of assets in 2007 to nearly half (7.6%) in 2016. The decline has been much more pronounced than in the European banking sector, with the weight of market-based funding in Spain 4.6 pp lower than the euro area average.
- Finally, the increased regulatory demands imposed by Basel III explain why own resources have increased their share over total assets, rising from 6.9% in 2007 to 11% in 2016 in Spain. The increase is smaller in the eurozone and in 2016 the overall capital ratio of the Spanish banking sector was 3 pp above the European average, although the solvency coefficient is lower. The latter implies that the proportion of risk-weighted assets (RWAs) in total assets is larger in Spain, reflecting a more demanding treatment. This is a point that should be very much kept in mind when making international comparisons of bank solvency.
Exhibit 2 provides a graphical summary of the specialisation of the Spanish banking sector in comparison to the euro area average, as well as of the changes from 2007 to 2016. The exhibit organises the data from smaller to larger differences (in percentage points) between Spain and the euro area in terms of the weight of each asset and liability heading in the total balance sheet. The right of the exhibit shows business areas where Spanish banks are most specialised and vice-versa.
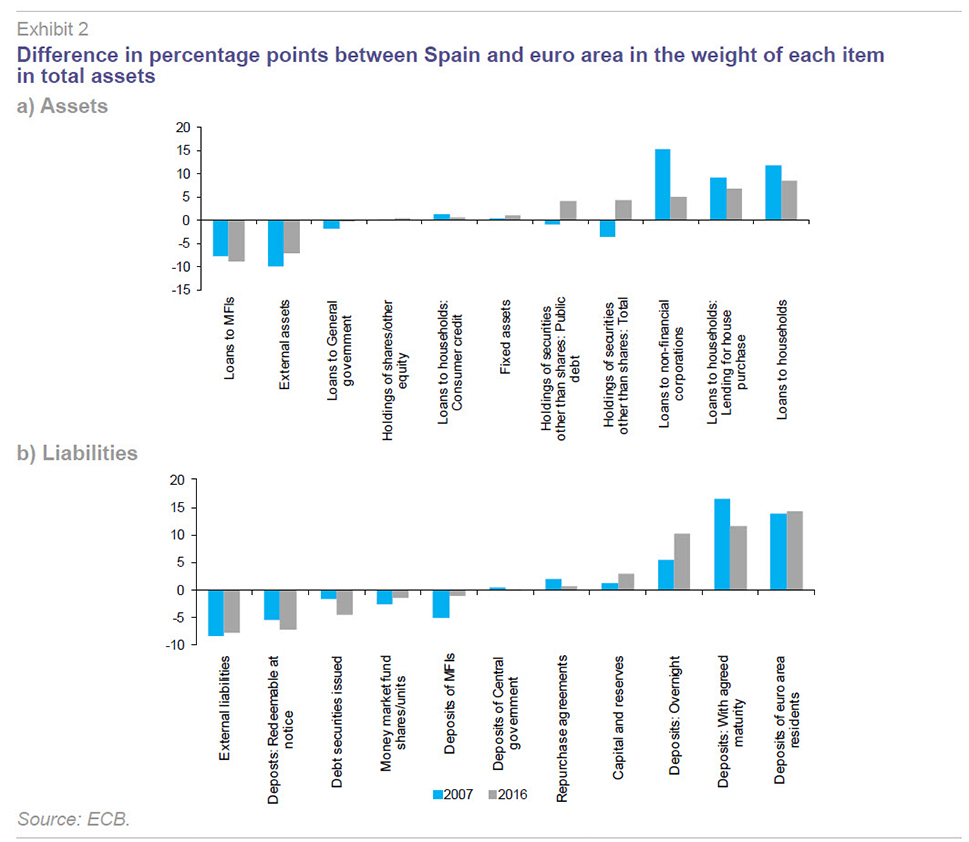
The latest data to 2016 show that the biggest differences lie in the relative weight of lending to the private sector, both to households for house purchases and to non-financial corporations, as well as in the overall importance of both sight and time deposits.
Meanwhile, the European banking sector is more focused in the interbank market and in external activity (non-euro assets), as well as debt funding through wholesale markets.
One of the most noteworthy changes between 2007 and 2016 is the decline in the weight of lending to non-financial corporations in Spain, as a result of the deleveraging process. Also of note is the growing weight of fixed income investment, which has gone from having a lower relative weight in total assets than the European average in 2007 to being nearly 4.3 pp above in 2016. On the liability side, the increased weight of sight deposits in Spain and the declining importance of interbank funding are the main highlights.
Differences in the specialisation of the large European banking sectors
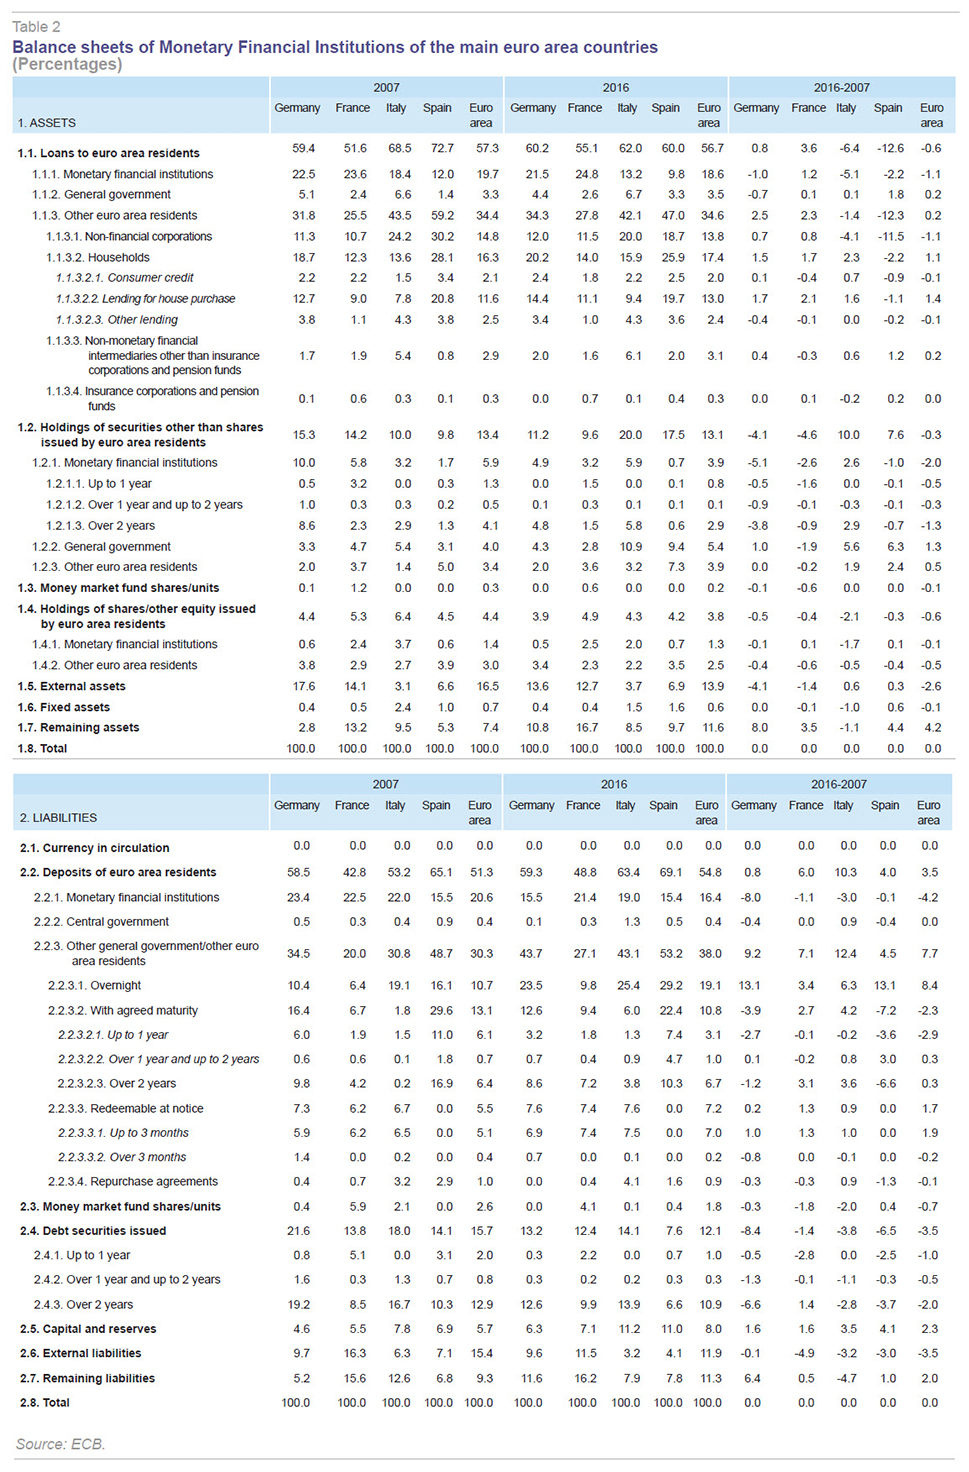
Various different types of business models coexist in the European banking sector, as reflected in the different balance sheet structures. As regards the main euro area economies, the Spanish banking sector stands out for the high proportion of private sector lending and deposits, which is the defining characteristic of a retail banking model. Thus, lending to the private sector in Spain in 2016 accounts for 47% of total assets, compared to 34.3% in Germany, 27.8% in France and 42.1% in Italy. The same is true for deposits, with a weight of 53.2% in Spanish banks’ total liabilities, compared to 43.7% in Germany, 27.1% in France and 43.1% in Italy.
Non-interbank deposits have increased their weight in the balance sheet between 2007 and 2016 in all four economies, albeit with Spanish banks registering the smallest increase and Italian banks leading the pack with a 12.4 ppt increase. By contrast, the weight of lending to the private sector in total assets has increased in Germany and France (2.5 pp and 2.3 pp respectively) but has fallen by 1.4 pp in Italy, with Spain registering by far the largest decline (12.3 pp). It is worth remembering that in the boom years leading up to 2007, Spain was an outlier in Europe due to the strong growth in lending associated with the real estate bubble. As such it is logical that the subsequent correction has been much more pronounced.
Another feature of the Spanish banking sector compared to the main European economies is the much higher degree of specialisation in the mortgage market. The weight of lending for house purchase accounted for 19.7% of total assets in Spain in 2016, compared to 14.4% in Germany, 11.1% in France and 9.4% in Italy. By contrast, the weight of lending to non-financial corporations in total assets is higher in Italy (20%) than in Spain (18.7%). The high ratio of non-performing business loans in Italy, together with the significant weight of lending to this segment on the balance sheet, help to explain some of the current problems facing the Italian banking sector.
A difference that can also be seen is the weight of sovereign debt in the balance sheets of French and Germany banks compared to Spanish and Italian banks. Thus while in the case of the former two countries the weight of sovereign debt has fallen (in the case of France) or barely changed (Germany), public sector debt holdings have significantly increased in the second group —doubling in Italy and tripling in Spain. Italian banks have the highest weight of public debt (10.9% of total assets) in 2016, closely followed by Spain (9.4%). By contrast, sovereign debt accounts for just 2.8% of French banks’ assets and 4.3% in the case of German banks. The hefty difference between the two groups of countries helps explain why German is calling for a change in the treatment of public debt, demanding capital be consumed according to risk.
A common feature across all the European sectors analysed is the increase in capitalisation as a result of the implementation of Basel III. The largest increase in own resources/assets has been in Spain (4.1 pp from 2007 to 2016), with more modest increases in Germany and France (of 1.6 pp). Capitalisation levels in 2016 are greater in Spain (11%) and Italy (11.2%) than in France (7.1%) and Germany (6.3%).
A distinctive feature of the Spanish banking sector is the limited importance of interbank market activity, especially as far as lending to other MFIs is concerned. In Spain, lending to MFIs accounts for 9.8% of total assets, almost half as important as it is in European banks and considerably less than for France (24.8%) and Germany (21.5%).
Another aspect worth highlighting regarding the Spanish banking sector is the relative lack of importance of funding through debt issuance, which accounts for 7.6% of the balance sheet in 2016, compared to 13.2% in Germany, 12.4% in France and 14.1% in Italy. While the importance of debt as a source of funding has fallen across all the countries analysed, and the euro area in general between 2007 and 2016, the decline has been more pronounced in Spain and, even more so, in Germany.
Business models and income structures
Changes in banking business models can be seen in both the composition of the balance sheet and the income structure. As highlighted by the ECB (2016a), since the start of the crisis many European banks have diversified their sources of income to maintain profitability levels. The pressure from falling interest rates (which has a negative impact on the net interest margin) and slower lending growth (negative in some countries like Spain) has forced banks to seek out alternative sources of income, such as fees and commissions or trading income. In addition, more recently, the zero interest rate environment and growing ECB penalisation of banks’ excess liquidity (since February, -0.4% in the deposit facility and on excess reserves) has pushed the interest rate on deposits to very low levels, encouraging banks to direct savings towards alternative forms of investment, such as mutual funds, in order to generate fee income.
In order to analyse changes in the income structure of European banks in recent years, Exhibit 3 shows developments from 2008 (information is not available for 2007 for some countries) to the third quarter of 2016
[2] in the share of non-interest sources of income in total net income. Non-interest sources of income include fees and commissions, dividends, trading income and foreign exchange rate results.
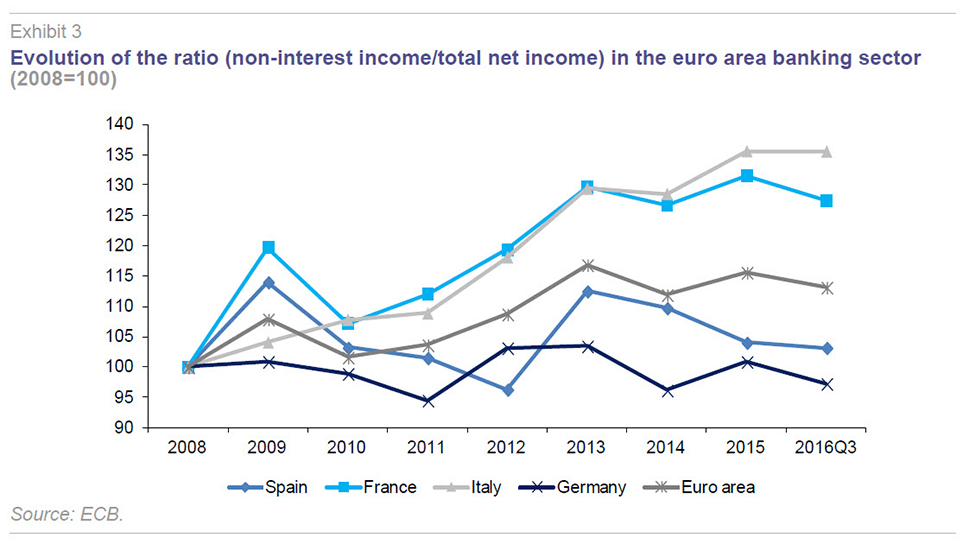
After experiencing a sharp fall in 2008 as a result of losses on financial operations, the weight of non-interest income in net income on average in the euro area has gained weight, standing at 13% above 2008 levels in 2016. In Spain, developments have been more volatile. Following the fall during the worst years of the crisis from 2009 to 2012, non-interest income recovered in 2013, but then fell again. In 2016, it stood at relatively similar levels to 2008. In the case of France and Italy, the weight of non-interest income is 27% and 35% higher, respectively, than in 2008. Meanwhile, in Germany, the income structure has remained relatively stable. Overall, since 2008, the weight of non-interest income in the European banking sector in general has increased in the face of a decline in net interest income on the back of falling interest rates.
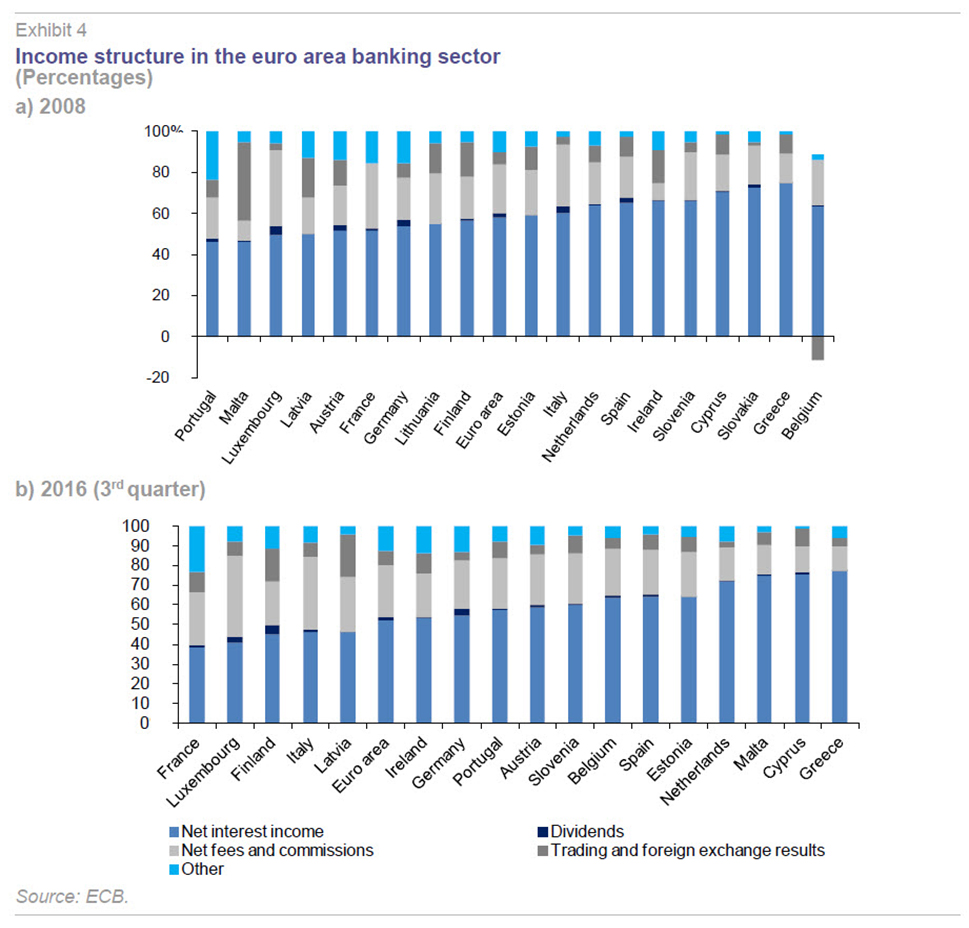
Data for 2008 and 2016 point to significant differences in the income structure of European banks (see Exhibit 4). For example, in 2016, the weight of net interest income varies from a minimum of 38% in France to a maximum of 77% in Greece. The weight of net interest income in Spain stands at 12 pp above the euro area average, at 64%, reflecting the importance of retail banking activities. There is no clear pattern in income structure developments across different euro area countries between 2008 and 2016.
The ECB (2016b) has concerned itself with analysing the impact that changes in the European banking sector’s business model are having on their capacity to offer activities that generate income through fees and commissions, given how cyclical (such as the fall in interest rates) and structural factors (regulatory changes, growing competition) are squeezing bank profitability. Hence, the interest in focusing on these sources of income, analysing their development over time and differences across countries.
Exhibit 5 focuses on Spain and the euro area, showing the increase in the weight of fees and commissions in relation to total assets since 2012. New highs were reached in Spain in 2014 (0.68%) and the euro area in 2015 (0.64%), both in excess of 2008 levels. The Spanish banking sector has consistently registered a higher proportion of fees and commissions in total assets, which remains the case up to September 2016 on the basis of annualised data. As a result, the evidence suggests that both Spanish and euro area banks have responded to the challenges posed by cyclical and structure factors by increasing activities that generate fee income.
[3]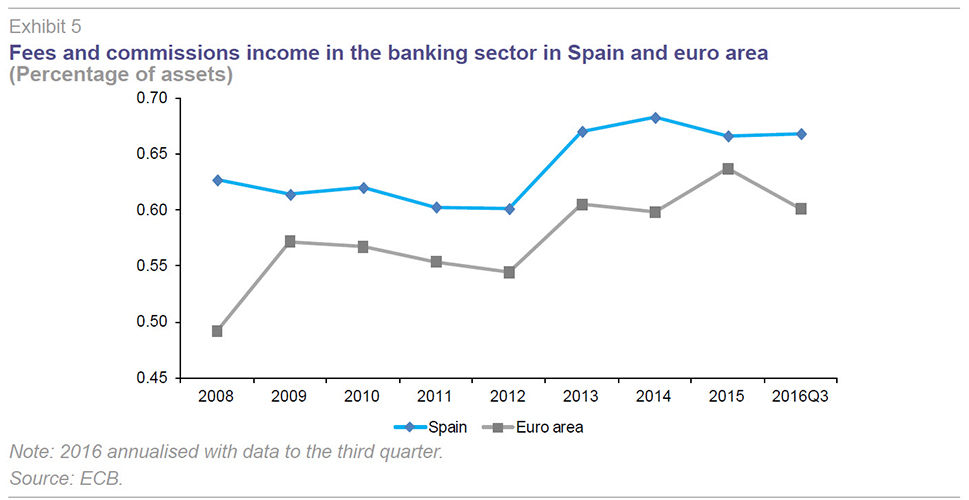
Conclusions
The recent financial crisis and the way in which it has been dealt with have resulted in a new, much more complex operating environment for European banks. This is characterised by very low levels of interest rates, a very flat yield curve, growing private sector deleveraging, increased regulatory burdens (both capital and liquidity) and an increase in competitive pressures (both within the sector and from outside, such as fintech). The combination of these factors has pushed down profitability levels to below the cost of capital.
In this hostile environment, European banks have responded by changing their business models to adapt to the new reality. These changes are happening both in the composition of banking activity and in their income structure.
Against this backdrop, the objective of this article has been to provide empirical evidence of the changes in Spanish banks’ business models in the context of the euro area, using information on both balance sheets and income structures. The analysis has been carried out for the period from 2007 to September 2016, making it possible to compare how banks have reacted in the aftermath of the crisis.
The conclusions from this evidence are as follows:
- The retail banking model continues to dominate in Spain after the crisis, although lending to the private sector has fallen as a share of total assets by 12.3 pp since 2007, mainly due to deleveraging by non-financial corporations.
- A key aspect worth highlighting is the increased weight of sovereign debt in Spanish banks’ sector assets, which has tripled from 2007 to 2016 to above 9.4% (compared to a euro area average of 5.4%). Only one other euro area country has seen faster growth in sovereign debt holdings than Spain.
- The sharp decline in lending and the increase in the weight of non-interbank deposits in Spanish banks’ balance sheet has led to a complete reversal of the 2007 liquidity gap. In 2016, for every euro of deposit banks lent out 0.88 euros. This is below the 0.91 ratio in the euro area.
- The decline in interest rates on term deposits explains why this product has lost importance as a source of funding for Spanish banks, as well as explaining the growth in sight deposits. The weight of term deposits in the balance sheet has fallen by 7.2 pp, while sight deposits have increased by 13.1 pp.
- Difficulties in accessing wholesale funding markets explain why the weight of debt on Spanish banks’ balance sheets has practically halved between 2007 and 2016.
- Tougher regulatory demands have forced banks to increase capital levels, such that the weight of own resources in Spanish banks’ assets has increased 4.1 pp in the period to now stand at 3.0 pp above the European average (11% vs. 8%).
- Changes in the business model are also illustrated by banks’ income structures. The relative weight of non-interest sources of income has increased in both the euro area and Spanish banking sectors since 2008, albeit less strongly in the latter. In 2016, non-interest income accounted for 36% of total net income in Spanish banks, 12 pp below the European average.
- The growing weight of fees and commissions in total income is a corollary of changes in the business model. Banks have responded to the new environment of low interest rates, increasing regulatory demands, heightened competition, etc. by increasing fee-generating activities. This has also been the case in the Spanish banking sector, which has seen the weight of fees and commissions in total assets increase from 0.63% in 2008 to 0.67% in 2016, putting it above the European average. Nonetheless, as a proportion of total net income, fees and commissions in Spain (23%) account for a smaller percentage than they do in the euro area (26%).
In summary, the new environment facing the banking sector as a result of falling interest rates, deleveraging, regulatory requirements and growing competition, has forced banks to respond by adapting their models in order to maintain profitability levels. This can already be observed by comparing current balance sheets to pre-crisis balance sheets and also by analysing the income structure. Against this backdrop, and this is true for Spain, the structure of the balance sheet has changed (lower weight of lending, growing importance of sovereign debt purchases, increased funding through deposits and lower recourse to wholesale debt markets, increased capitalisation, etc.) with the relative weight of non-interest sources of income increasing, particularly fees and commissions for providing services.
Notes
Through a cluster analysis Ayadi et al. (2016) identify up to five different types of European banking model (focused retail, diversified retail 1, diversified retail 2, wholesale and investment). According to their analysis, retail banks dominate in Spain (around 90% of total business) with market-based and investment banking having a very limited role (around 10%).
The 2016 data in the exhibits has been annualised on the basis that fourth quarter data is equal to the average of the three previous quarters.
The increase in the weight of fees and commissions in total assets has taken place in the euro area aggregate between 2008 and 2016 and across the majority of countries, with the exception of Finland, the Netherlands, Greece, Cyprus and Portugal.
AYADI, R.; DE GROEN, W.; SASSI, I.; MATHLOUTHI, W., and H. REY (2016), Banking Business Models Monitor
2015, Europe. A. and D. Desjardins, International Institute for Cooperatives and International Research Centre on Cooperative Finance.
EUROPEAN CENTRAL BANK (2016a), “Recent trends in euro area banks´ business models and implication for banking sector stability,” Financial Stability Review, special features, May.
— (2016b), “Adapting bank business models: financial stability implications of greater reliance on fee and commission income,” Financial Stability Review, special features, November.
Joaquín Maudos. Professor of Economic Analysis at the University of Valencia, Deputy Director of Research at Ivie and collaborator with CUNEF. This article was written as part of the Spanish Ministry of Science and Innovation (ECO2013-43959-R) and Generalitat Valenciana PROMETEOII/2014/046 research projects