Just one business cycle in Europe
Recent global events have renewed interest in assessing the pattern of European business cycles. Results show increased comovements during periods of European convergence as well as during the Great Recession. The analysis identifies the existence of just one cluster among the business cycles of European countries.
Abstract: Large contractionary shocks, such as the Great Recession and the European sovereign debt crisis, have renewed interest in analysing business cycle patterns. In Europe, this interest is more pronounced, as such analyses may help shed some light as to whether or not the construction of the European project, in particular, the creation of the euro (and the subsequent institutional framework designed to support it) have helped increase synchronisation across European Monetary Union (EMU) countries. In this paper, we first examine business cycle comovements among EU countries, and then we obtain a dating of the different business cycles that allows us to identify clusters among them. We observe that spatial correlation increased during the convergence process towards the introduction of the euro and has taken a big leap with the Great Recession. In fact, comovements among countries have mainly increased during the last decade. Finally, we find evidence of just one cluster amongst the European countries.
[1]
The severity of the Great Recession, along with the subsequent slow pace of recovery, has renewed interest in business cycle analysis. In the EMU, the adoption of a single currency raised many concerns about the ability of common policies to deal with country specific shocks, and more recently, the Great Recession seems to have produced significant changes in the overall patterns of business cycle synchronisation. The aim of our paper is to analyse the business cycles of European countries and the comovements among them, obtaining a dating of the business cycle that allows us to identify possible groups (clusters) among the countries.
Much effort has already been devoted in the existing literature to country analysis in the study of European business cycles since the creation of the euro. Numerous studies have analysed the business cycles and the synchronisation among the countries that make up the European Monetary Union (EMU). However, as far as we know, the impact of the recent crisis and the subsequent slow recovery has not yet been assessed.
By examining business cycles’ comovements, we observe that the spatial correlation has been increasing since the beginning of the EMU period (1999), and received a new impulse with the Great Recession. We identify some similarities in the business cycles of European countries studied, such as the huge impact of the Great Recession in 2008-2009, a deceleration at the beginning of the nineties and the slowdown in 2001, although each business cycle presents an idiosyncratic behaviour. Using Finite Mixture Markov Models, we also find evidence of just one cluster, i.e., a common cycle, at this geographical level.
The remainder of the paper is organized as follows. In the next section, we conduct a comprehensive literature review on European business cycles. We then provide a section explaining the methodology used in this paper, the Finite Mixture Markov Models, as well as describe the data. Next, we detail the main results on our paper. The final section presents the conclusion.
Literature review
There are numerous studies which describe the characteristics of business cycles within the euro area (EA) or the European Union (EU) countries. Camacho et al. (2008), Giannone et al. (2010) and De Haan et al. (2008) provide a comprehensive survey of this literature. However, there is a lack of consensus in the available results. Differences in results could be due to differences in geographical coverage, in the temporal dimension, in the methodologies used or even in the economic variables chosen. Hence, it is quite difficult to synthesise results in a meaningful way. Nevertheless, in the following paragraphs, we summarize some of the main findings.
A question commonly addressed in the literature was whether the introduction of the euro would contribute to the synchronisation of business cycles or, whether, on the contrary, it would reinforce the divergence of business cycles. Many studies have focused on countries’ heterogeneity and look at synchronisation to identify the degree of comovement. Some authors have investigated the role played by important milestones in Europe such as the Maastricht Treaty or the introduction of the single currency. However, the importance of institutional changes is not clear. A popular approach has been to identify whether business cycles in European countries have a global and/or a European component, allowing one or more separate European business cycles to exist.
The results in the literature about the existence of a single European business cycle over a long sample are not conclusive. For instance, some studies identify the emergence of a European cycle in the nineties, some date it back to the seventies, while others do not support its existence at all. Among the papers that find a single European cycle, Artis and Zhang (1997), in an article prior to the adoption of the euro (their sample spans from 1961 to 1993), show that there is a core group made up of France, Belgium, Austria and the Netherlands, and two peripheral groups comprising northern and southern countries of the EU, respectively.
[2] They also find evidence of increased synchronicity after 1979 for countries belonging to the Exchange Rate Mechanism (ERM). Lumsdaine and Prasad (2003) examine industrial production indexes for seventeen OECD economies over the period 1963-1994 and identify a clear European business cycle from 1973 to 1994.
[3] Artis, Krozlig and Toro (2004) conclude that there is clear evidence of comovement in output growth among nine EA countries, suggesting the existence of a common business cycle. Canova
et al. (2007) study the G7 cycle using a multi-country Bayesian panel VAR model with time variation, unit-specific dynamics and cross-country interdependences for the period 1979-2002 and show no European cycle prior to the mid-80s, while a single EU cycle emerges in the 1990s that is common to EA and non-EA countries. Giannone
et al. (2010) document the pattern of business cycle correlations by analyzing business cycles for EA12 from 1970-2006 and they identify two groups: core countries (Austria, Belgium, France, Germany, Italy and the Netherlands) and non core countries (Finland, Greece, Ireland, Luxembourg, Portugal and Spain).
[4] Kaufmann (2003) finds that, for the period 1978-2001, there is a common growth cycle for EA countries and, when the analysis includes Australia, Canada and the US, she observes that, under a long-term perspective, these three countries form one group, while most European countries fall into the other group. Finland and Ireland follow more closely the first rather than the Euorpean cycle, while the UK and Japan clearly fall into the group of European countries. Nevertheless, this classification varies in shorter term horizons.
[5]
With respect to the papers that do not identify a European business cycle, Artis (2003) uses data from 1970 to 2001 and concludes there is no European cycle with a sample of twenty three countries (fifteen of the total are European countries). With a wider focus, Helbling and Bayoumi (2003) find little synchronisation across the G7 countries from 1973 to 2001, although there were strong cross-country correlations during recessions. They notice that Germany was more synchronised with Anglo-Saxon countries than with France. In the same line, Camacho et al. (2006) study more than thirty countries [including most European countries and four industrialized economies (Canada, US, Norway and Japan)] for the period 1962-2003 and they reveal that there is no evidence of a European attractor that brings European cycles together. Del Negro and Otrok (2008) examine the evolution of the business cycle for nineteen countries with data from 1970 to 2005 and find no change in average cross-country correlation of EA business cycles for a large set of European countries.
Some papers have also tried to characterize the EA business cycle with a focus on the dating of recessions and expansions of levels of economic activity or on the growth cycle. Kaufmann (2003) gets a dating of the grouped EA countries based on Finite Mixture Markov Switching modes. Altissimo et al. (2001) also provide a business cycle chronology based on the cyclical components. Artis, Krolzig and Toro (2004) propose a dating of the business cycle, both for an index of industrial protection and GDP, and both chronologies appear to be consistent. Artis et al. (2005) date EA turning points with data from 1970 to 2003 and find that the timing of EA cyclical phases is similar to that of the US, as reflected in the National Bureau of Economic Research (NBER) chronology. However, Giannone and Reichlin (2005) show that EA turning points lag behind US ones.
Finally, some papers assess the propagation of shocks across countries on the basis of structural or semi-structural models. Bayoumi and Eichengreen (1992) identify demand and supply shocks, through VAR models, on output growth and inflation for the twelve EA countries from 1960 to 1988. On the basis of these results, they identify a core group (Germany, France, Belgium, the Netherlands and Denmark) whose supply shocks are both smaller and more correlated across neighboring countries and a periphery group (the UK, Italy, Spain, Portugal, Ireland and Greece) with large and weakly correlated shocks. Giannone and Reichlin (2006) study the response of the output growth of EA countries to an EA-wide shock for the 1970-2005 period and find that a large part of business cycles is due to common shocks while idiosyncratic fluctuations are limited, but persistent.
To sum up, this review shows that the literature on the main facts of European business cycles is far from having reached a consensus. Results depend on samples, variables of analysis or methodologies.
Methodology and data
The methodological strategy used in this paper, called Finite Mixture Markov Models (Frühwirth-Schnatter, 2006), has an advantage over the previous literature in that it not only allows us to obtain a dating of the turning points of the business cycle of the countries, but also to investigate a broad set of issues. For instance, to find out whether there is a common growth cycle for the European countries or if, on the contrary, there are several different growth cycles and to identify which countries belong to each group. We can also determine whether the degree of synchronisation within each group has changed over time.
[6]
The Finite Markov Mixture Models combine clustering techniques, finite mixtures and Bayesian estimation techniques. The idea underlying this approach is that we can model a random variable as a mixture of autoregressive processes. Each of these processes represents the characteristics and distribution of the business cycle that underlies the GDP growth. Furthermore, these processes include an unobservable latent indicator that follows a two-state Markov chain that allows capturing the switch between the two cyclical phases (expansion and recession).
We apply clustering based on finite mixtures of dynamic regression models. The idea is to pool time series to obtain posterior inferences but without overall pooling within clusters being necessary. Hence, this methodology benefits from the robustness of time series techniques in the panel when estimating the coefficient of an individual time series. This means that, within a panel of time series, only those that display similar dynamic properties are pooled to estimate the parameters of the data generating process. That is, the appropriate grouping is estimated along with the model parameters, rather than forming groups before estimation. This is achieved within the Bayesian framework by applying Markov Chain Monte Carlo (MCMC) and data augmentation methods to estimate the posterior probabilities.
[7]
To analyse the synchronisation of regional business cycles we employ annual real GDP data. It has to be acknowledged that annual data could be even more reliable to establish robust facts on real economic activity in spite of the loss of information on short-term dynamics.
In this study we consider 16 European countries, namely, the 12 Euro area (EA12) member states [Austria (AT), Belgium (BE), Finland (FI), France (FR), Germany (DE), Ireland (IE), Italy (IT), Luxembourg (LU), the Netherlands (NL), Portugal (PT), Spain (ES) and Greece (EL)], three EU member states [Denmark (DK), Sweden (SE) and the UK (UK)] and Norway (NO), which is not a member state of the EU. Regarding Germany, prior to 1991, the data do not include the eastern Landers and Berlin. However, from 1991 onwards, they are included and incorporated into the national total.
The series cover a period of 34 years, from 1980 to 2014. As far as we know, this is one of the few papers that incorporates the period of the Great Recession. Thus, we analyse the possible effect of the Great Recession on the business cycle of the European countries. The source of the data is the Cambridge Econometrics database, supplemented with data from AMECO, a dataset provided by the European Commission’s Directorate General of Economic and Financial Affairs (DG EcFin).
An analysis of European business cycles
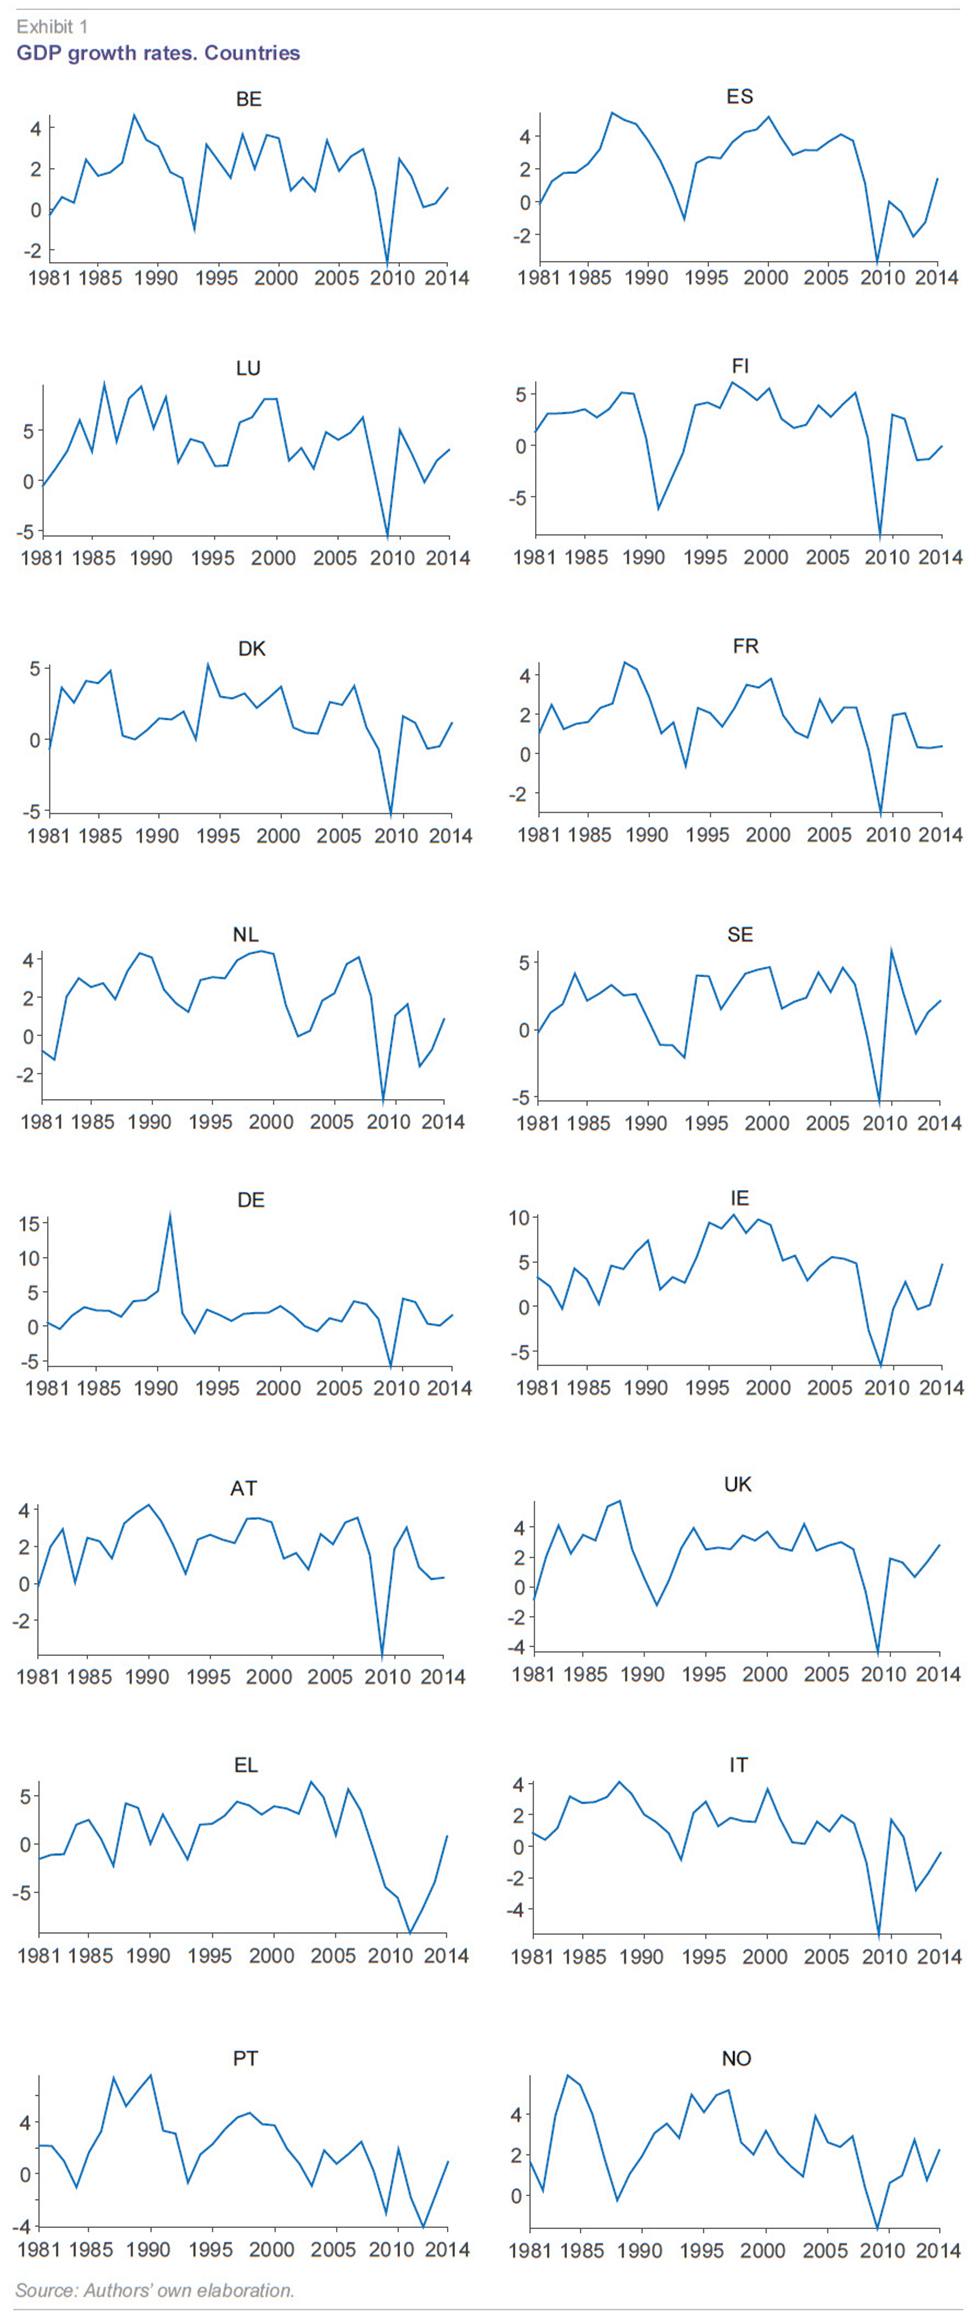
We analyse the national cycles to see whether some general patterns can be identified. We first examine the evolution of country GDP growth rates. Data of the growth rates, calculated as the first logarithmic difference, are displayed in Exhibit 1. We observe some similarities in the business cycles of the European countries, such as the huge impact of the Great Recession, a deceleration at the beginning of the nineties or the slowdown in 2001. However, all countries exhibit some idiosyncratic behaviour, with differences in the duration and depth of recession phases and also in the duration and speed of growth of recoveries.
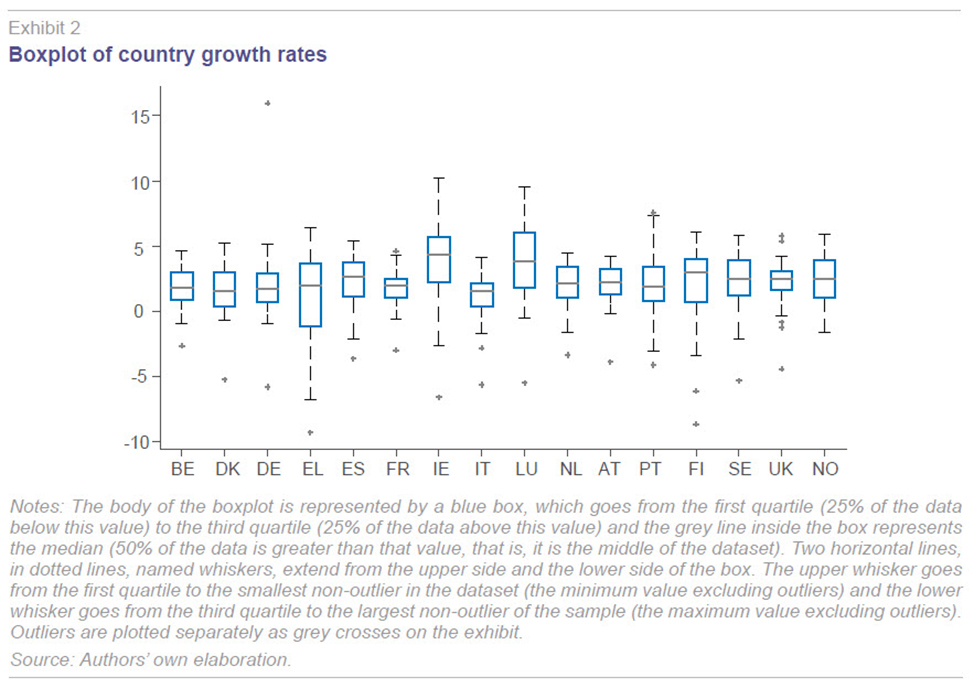
The boxplot of these growth rates is displayed in Exhibit 2, which divide the dataset into quartiles and offer information about the minimum and maximum value of each series, as well as their outliers. We find that Ireland (IE) and Luxembourg (LU) are the countries that have registered the highest growth rates during the whole period considered, followed by Finland (FI) and Spain (ES). On the contrary, the countries with the lowest growth rates were Italy (IT) and Denmark (DK). Regarding volatility, Greece (EL), Luxembourg (LU) and Ireland (IE) show the highest variances, although the former presents a lower growth rate. Meanwhile, the UK and France (FR) stand out because of their low variability. The UK is the country that presents the highest number of outliers whereas, in most of the remaining countries only one outlier is detected.
The analysis of comovements completes this preliminary description section. The top of Exhibit 3 displays GDP growth rates for each country (blue lines) together with the median and quantiles 25 and 75 of the sample (grey lines). Although the inter-country dispersion of business cycles is high, when we focus on the grey lines, we are able to distinguish quite a common cyclical pattern. Two cyclical events are observed. On the one hand, the deceleration of the beginning of the nineties and, on the other hand, and more clearly, the huge decline in the median output growth rates at the time of the Great Recession.
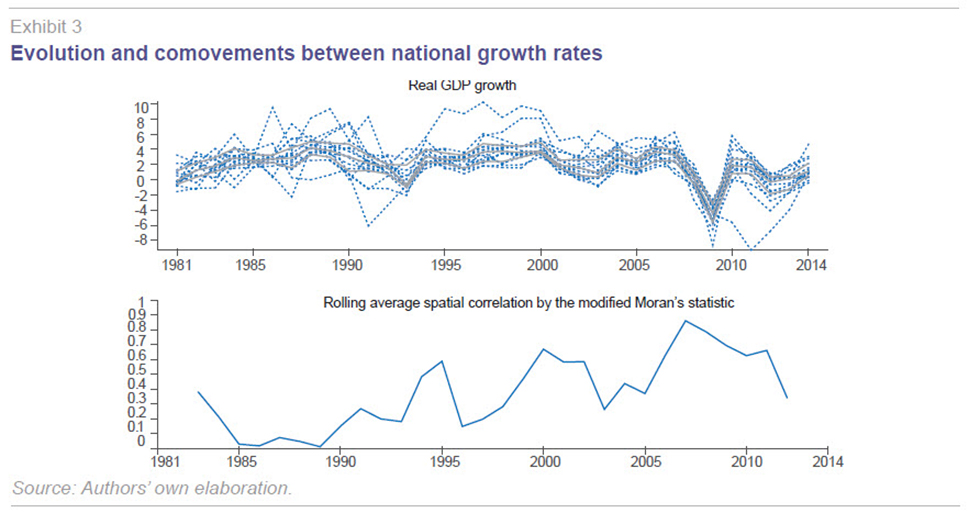
In order to analyse how the series move together over the sample and, specifically, if comovements have intensified during the Great Recession, we compute Moran’s modified statistic, following Stock and Watson (2010), which summarizes the possible time-varying comovements among GDP growth rates. The outcome is plotted at the bottom of Exhibit 3. We observe that synchronisation of comovements is around 0.5, on average, and quite volatile throughout the period. Comovements increased after the mid-nineties and sharply decreased in 1999. This index also confirms that spatial correlation has been increasing since the beginning of the European Monetary Union period (1999). This trend continued during the Great Recession, when it received a new impulse. However, as the worst of the recession ended, the synchronisation smoothly began to decrease. We also observe an increase in synchronisation near the end of the sample associated with a slowdown in the output growth after 2010. Finally, the improvement in the European economies meant a new decline in comovements at the very end of the sample.
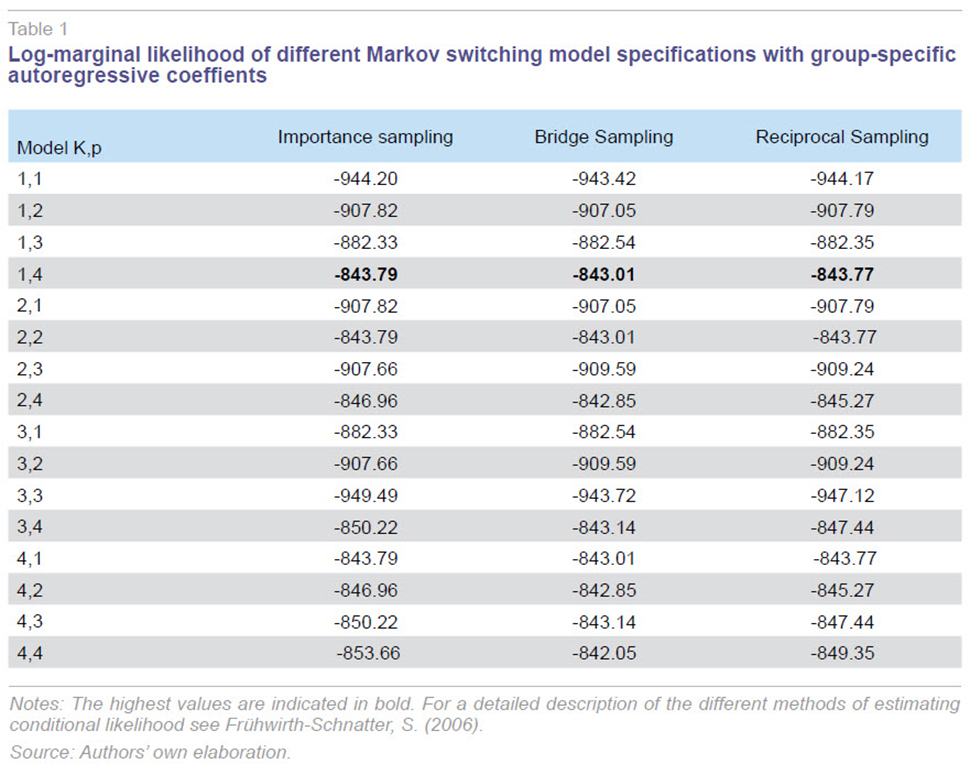
Finally, we apply the Finite Mixture Markov Models methodology, in order to identify the business cycle dating of European countries and to find out into how many clusters these cycles can be classified. To select the best model, we estimate the likelihood function applying three different criteria: importance sampling, bridge sampling and reciprocal sampling. We contemplate various specifications with one, two, three and four possible groups of countries and one, two, three, and four lags to capture the dynamics of the time series processes.
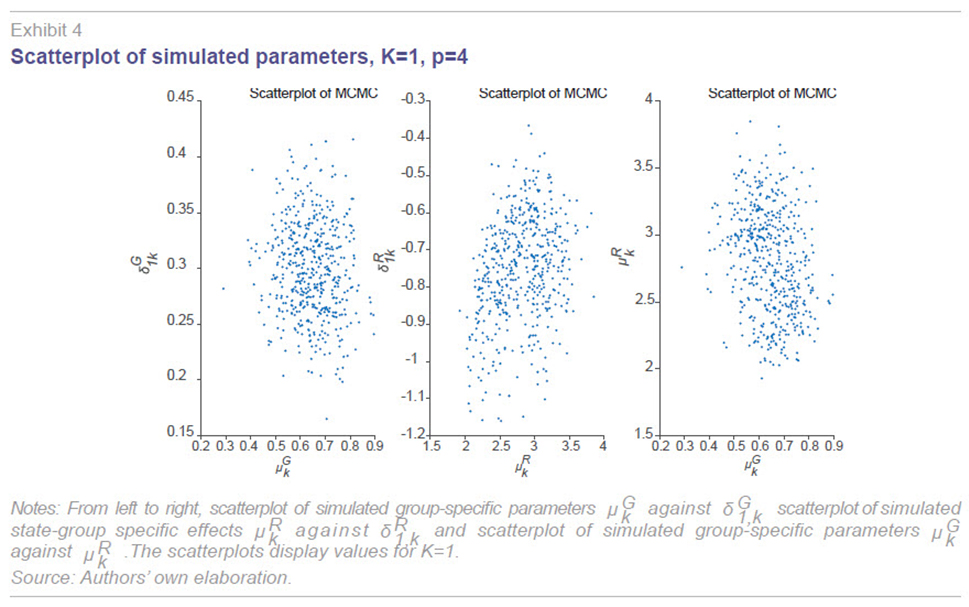
Results show that the likelihood using the three criteria is maximum for the model with only one group of countries and four lags (
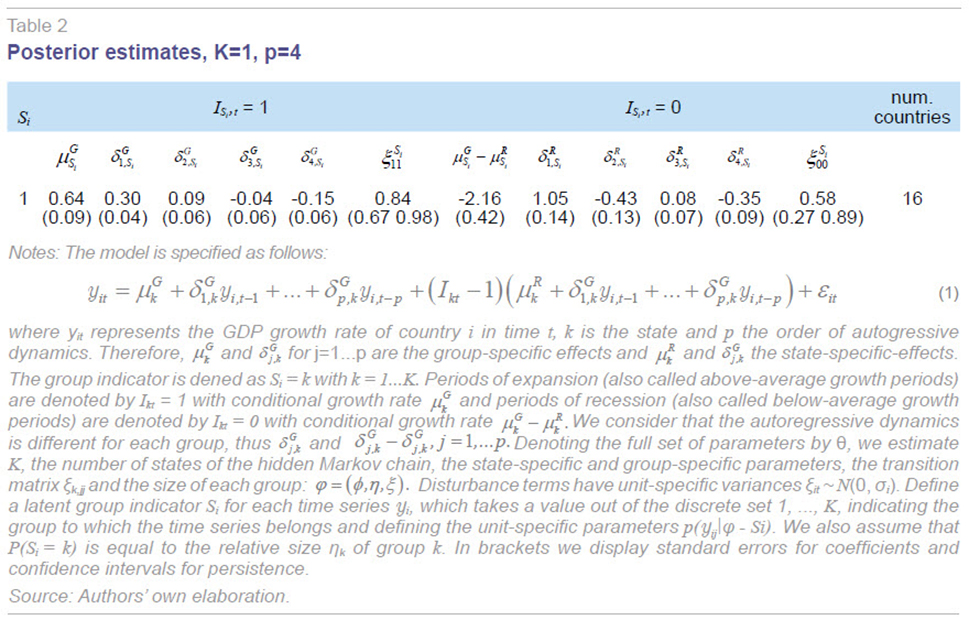
i.e., Table 1). If we observe the scatterplots of the Markov Chain Monte Carlo draws for one group and four lags (Exhibit 4), we can prove that the observations of the different simulated parameters simulated do not reflect distinct groups. This means that there is just one single business cycle across the sixteen European countries under analysis. The details of the posterior estimation of the model parameters are available in Table 2. We observe that the two states specification is significant as the corresponding coefficients of the growth rates in the expansionary phase and the recessionary phase of the cycle are significantly different from zero. It should be noted that, due to the standardization, the coefficients and are not directly interpretable as yearly growth rates. They represent above-average and below-average periods with respect to the mean. We distinguish an above-average cycle, with a mean growth of 0.64%, and a below-average cycle with a mean contraction of -2.16%. Considering these figures and taking into account probabilities of each business cycle phase, the average growth would be 2.69% during expansion and -0.52% during recession.
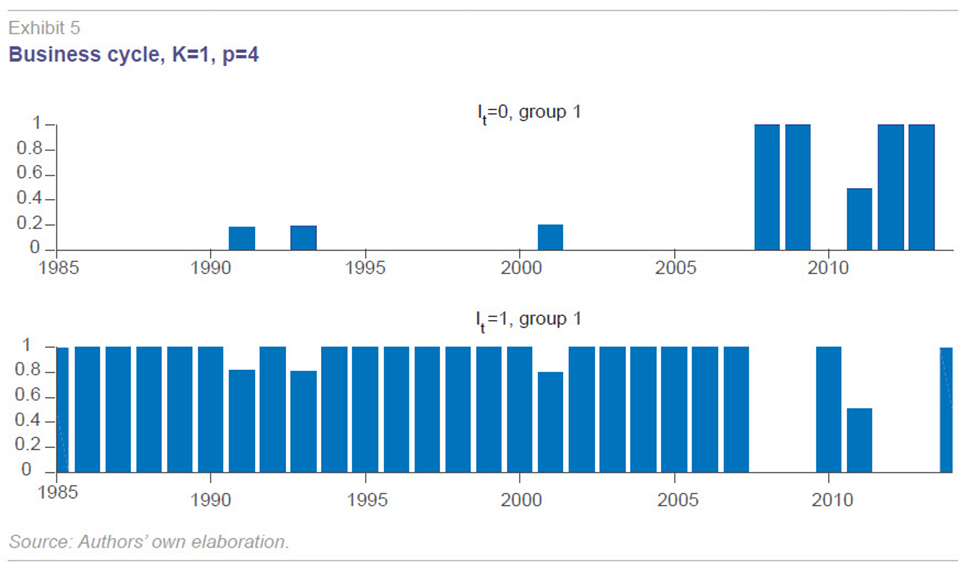
The chronology of cyclical phases appears in Exhibit 5. In particular, it allows us to identify several recessionary periods, namely, the crisis at the beginning of the nineties, the deceleration of 2001 and Great Recession, in chronological order. To be precise, we observe that 1993, 2001, 2008-2009 and 2011-2013 are identified as recessionary phases in the top exhibit. The expansionary periods are displayed in the bottom exhibit. The Euro Area Business Cycle (EABC) Dating Committee of the Centre for Economic Policy Research (CEPR)
[8] identifies just two recessions in this sample: 1992.2-1993.2 and 2008.2-2009.2.
[9] Both chronologies are quite close. Nevertheless, we identify a deceleration at the beginning of the nineties which does not appear in the official dating. In any case, this episode and the one in 2001 were not so clear, as shown by the probability of being in recession, which is slightly below 0.5.
[10] Furthermore, it should be noted that we do not only deal with a different sample of countries but also with a different frequency and temporal dimension.
The regime switches are quite distinct and also present a different persistence for periods of recovery and slowdown. The persistence is interpreted as the probability of remaining in expansion or recession after an expansionary or recessionary cyclical phase, respectively. Table 2 documents that the mean persistence of the states is 0.84 and 0.58, respectively. Hence, the persistence of remaining in expansions is higher than that for recessions. On average, above-average growth periods are expected to last more than nine years, whereas the expected duration of below-average growth periods is around two years.
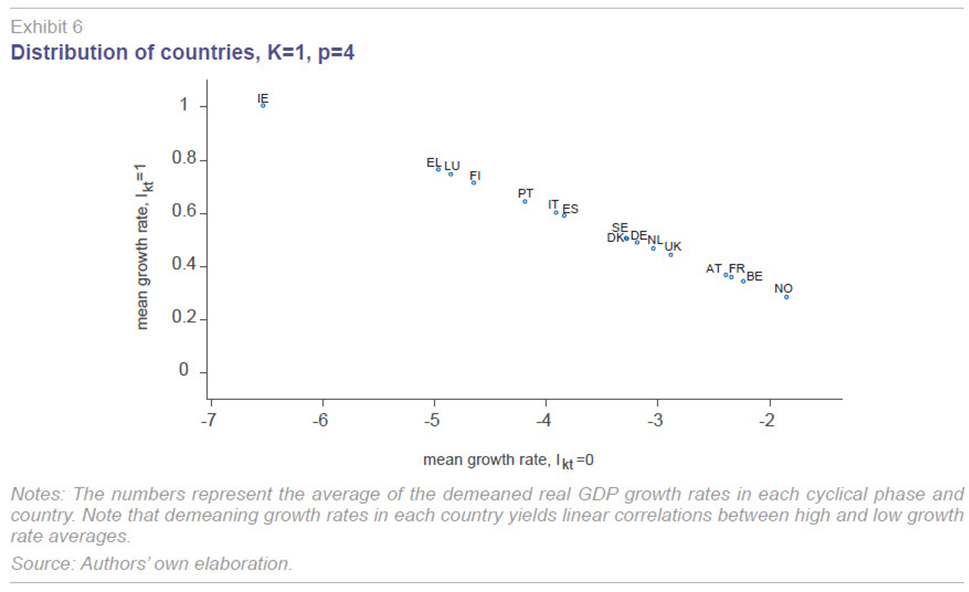
The distribution for each country according to its relative mean growth in recession and expansion is shown in Exhibit 6.
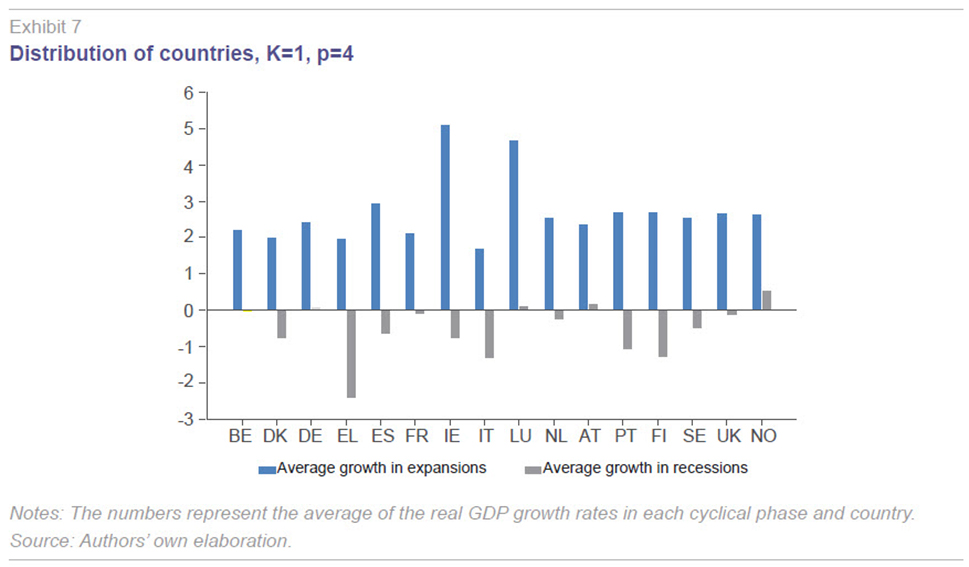
[11] For each cyclical phase and country, we compute the average of the demeaned real GDP growth rates. We observe that there have been important differences in the growth performance of the different countries, but two extreme cases deserve comment. First, Ireland (IE) stands out for having both the most dynamic GDP growth rates during expansion phases and the hardest declines during recession periods. Second, Norway (NO) has less variability in its business cycle, the growth rates being very low during recoveries and experiencing small negative growth rates during recessions. Finally, Exhibit 7 displays for each country, the average growth in the phases of expansion and recession. Ireland, Luxembourg and, to a lesser extent, Spain show the largest growth rates during expansionary phases (on the contrary, Italy, Greece, France, and Denmark are those that grew the least). Furthermore, Norway, Austria, Luxembourg and Germany are those that exhibit the smoothest declines in recessionary phases (with Greece, Italy, Finland and Portugal experiencing the deepest decreases).
Concluding remarks
In this paper, we show the results of a robust methodology that allows us both to date and cluster the business cycles of European countries, that is, the Finite Mixture Markov Models. Considering an autoregressive panel framework, the GDP growth rate in a country is allowed to switch between expansionary and recessionary periods according to a latent indicator that captures the two unobservable cyclical states of the economy. We also estimate the most suitable grouping of countries according to their similarity in business cycle dynamics along with the model parameters. This means that we do not set an a priori grouping on the basis of some unit-specific features, but rather use our statistical model in order to assign each unit to a group defined in terms of business cycle features.
We observe some similarities in the business cycles of the European countries, such as the huge impact of the Great Recession, a deceleration at the beginning of the nineties and the slowdown in 2001, although each business cycle presents idiosyncratic behaviours in terms of average growth rate, variability and the presence of outliers. We also analyse the time-varying comovements in the GDP series, using an index proposed by Stock and Watson (2010), finding that spatial correlation has been increasing since the beginning of the Monetary Union period with a new impulse coinciding with the Great Recession. Applying the Finite Mixture Markov Models, we find evidence of a unique cluster, i.e., a common cycle in the European countries in which the two-state specification is significant and the persistence of expansions, i.e., the probability of remaining in that cyclical phase, is higher than that of recessions. Our methodology identifies 1993, 2001 and 2008-2009 and 2011-2013 as periods of recession.
Notes
We are grateful to Silvia Kaufmann for sharing her codes. The views expressed in this paper are the responsibility of the authors and do not represent those of the Banco de España or the Eurosystem.
Their sample includes the US, Canada, the UK, Finland, Norway, Sweden, Germany, France, Italy, Netherlands, Belgium, Spain, Portugal and Ireland.
However, they show that all countries have a strong positive correlation with the common component in international fluctuations, confirming the existence of a world business cycle after 1973.
They also identify that, in neither of the two groups, were business cycle characteristics altered by the inception of the single currency in 1999.
She also shows an increase in synchronisation over time in the European countries.
See Bandrés, Gadea and Gómez-Loscos (2016) for a detailed discussion of this methodology as well as on the advantages and drawbacks of the different approaches for dating the business cycle.
We have followed the approach of Frühwirth-Schnatter and Kaufmann (2008).
It has to be borne in mind that our dating begins in 1985 because our selected model has four lags. Hence, we do not capture the recession of 1980.2-1983.3 that is identified by the EABC Dating Committee.
This is due to the fact that the enlargement of the sample including the most recent years, which cover the Great Recession and its subsequent recovery, characterized by the sharp decline in output growth, make difficult the identification of previous phases of recession. Previous recessionary phases are very smooth when compared with the Great Recession.
The average state-dependent mean can be computed for each country based on the estimate of the state indicator (cyclical phase), which is common for all the countries in the same cluster.
References
ALTISSIMO, F.; BASSANETTI, A.; CRISTADORO, R.; FORNI, M.; HALLIN, M.; LIPPI, M., and L. REICHLIN (2001), “EuroCOIN: A Real Time Coincident Indicator of the Euro Area Business Cycle,” CEPR Discussion Papers, 3108.
ARTIS, M. (2003), “Is there a European Business Cycle?,” CESifo Working Paper Series, 1053.
ARTIS, M. J.; KROLZIG, H. M., and J. TORO (2004), “The European business cycle,” Oxford Economic Papers, 56: 1‒44.
ARTIS, M. J.; MARCELLINO, M., and T. PROIETTI (2005), Dating the Euro Area Business Cycle, in Euro Area Business Cycle: Stylized Facts and Measurement Issues, ed. by L. REICHLIN, 83‒93, CEPR.
ARTIS, M. J., and W. ZHANG (1997), “International Business Cycles and the ERM: Is There a European Business Cycle?,” International Journal of Finance and Economics, 2(1): 1‒16.
BANDRÉS, E.; GADEA-RIVAS, M. D., and A. GÓMEZ-LOSCOS (2016), Regional business cycles across Europe, Documento de Trabajo, Funcas, 785.
BAYOUMI, T., and B. EICHENGREEN (1992), “Shocking Aspects of European Monetary Unification,” NBER Working Papers, 3949.
CAMACHO, M.; PEREZ-QUIROS G., and L. SAIZ (2006), “Are European business cycles close enough to be just one?,” Journal of Economic Dynamics and Control, 30: 1687‒1706.
— (2008), “Do European business cycles look like one?,” Journal of Economic Dynamics and Control, 32: 2165-2190.
CANOVA, F.; CICCARELLI, M., and E. ORTEGA (2007), “Similarities and Convergence in G-7 Cycles,” Journal of Monetary Economics, 54: 85‒878.
DE HAAN, J.; IINKLAAR, R., and J. RICHARD (2008), “Will business cycles in the Euro Area converge: a critical survey of empirical research,” Journal of Economic Surveys, 22(2):234‒273.
DEL NEGRO, M., and C. OTROK (2008), “Dynamic Factor Models with Time-Varying Parameters: Measuring Changes in International Business Cycles,” Federal Reserve Bank of New York Staff Reports, 326.
FRÜHWIRTH-SCHNATTER, S. (2006), Finite Mixture and Markov Switching Models, 1st ed., Springer-Verlag,New York.
FRÜHWIRTH-SCHNATTER, S., and S. KAUFMANN (2008), “Model-based clustering of multiple time series,” Journal of Business and Economic Statistics, 26: 78‒89.
GIANNONE, D., and L. REICHLIN (2005), Euro Area and US Recessions, 1970-2003, in Euro Area Business Cycle: Stylized Facts and Measurement Issues, ed. by L. REICHLIN, CEPR: 83‒93.
— (2006), “Trends and cycles in the Euro Area: how much heterogeneity and should we worry about it?,” ECB Working Papers, 595.
GIANNONE, D.; LENZA, M., and L. REICHLIN (2010), Business Cycles in the Euro Area in Europe and the Euro, Ed. ALESINA, A. and F. GIAVAZZI, The University of Chicago Press: 141‒167.
HELBLING, T., and T. BAYOUMI (2003), “Are they all in the same boat? The 2000-2001 growth slowdown and the G-7 business cycle linkages,” IMF working paper, 03‒46.
KAUFMANN, S. (2003), “The business cycle of European countries Bayesian clustering of country-individual,” IP growth series, Working Papers, 83, Oesterreichische Nationalbank (Austrian Central Bank).
LUMSDAINE, R. L., and E. S. PRASAD (2003), “Identifying the Common Component of International Economic Fluctuations: A New Approach,” Economic Journal, 113(484): 101‒127.
STOCK, J., and M. WARSON (2010), “Dynamic factor models,” in CLEMENTS, M. P. and D. F. HENDRY (eds), Oxford handbook of economic forecasting, Oxford University Press.
María Dolores Gadea. University of Zaragoza
Ana Gómez-Loscos. Banco de España
Eduardo Bandrés. University of Zaragoza and Funcas