
Deconstructing Spain’s net borrowing/lending position by institutional sectors
The return of the household sector to a net borrowing position in 2018 after eight years in surplus constitutes one of the most significant developments in the Spanish economy. However, the net lending position of non-financial corporates in part obscures existing risks associated with the country’s negative net international investment position, which would likely be exacerbated during an economic downturn.
Abstract: The return of the household sector to a net borrowing position after eight years in surplus constitutes one of the most significant developments in the Spanish economy. Notably, the sector registered growth in gross disposable income (GDI) of 3.2% in 2018, the highest rate since 2008. However, this was accompanied by a decline in the household savings rate to 4.9% of GDI, the lowest level since the statistic was first published in 1999. This downward trend in savings could be attributed to factors such as an ageing population and low interest rates, among others; however, these dynamics have been present in other European economies where the savings rate has moved along a different trajectory. Turning to the non-financial corporate sector, a net financial surplus of 2.5% was recorded in 2018. Similarly positive was the reduction in the public sector’s deficit to 2.48% of GDP. Nevertheless, with Spain’s households and the public sector presenting a net borrowing requirement, the country’s non-financial corporations are bearing the full weight of propping up the economy’s overall surplus, which is necessary if the country is to reduce its high NIIP deficit and shore up confidence in its solvency.
Introduction
In recent years, private consumption has underpinned growth in the Spanish economy. This has driven the savings rate to record lows, both domestically and in comparison to the developed world, thereby eroding Spain’s net lending position. With Spain’s households and government sectors presenting a net borrowing requirement, Spanish corporations are currently propping up the country’s headline financial surplus.
This paper outlines the 2018 trends in the Spanish economy’s financial and non-financial accounts broken down by institutional sectors. The analysis focuses on data from the start of the crisis and compares Spain’s situation with the rest of Europe.
Households
Spanish households’ gross disposable income (GDI) increased by 3.2% in 2018, the highest rate since 2008. That growth was primarily the result of a 2.7% increase in paid employment, a 1.4% expansion of average wages, and a rise of 3.8% in social benefits received. Significantly, this latter statistic represents the biggest increase since 2010 and is largely attributable to increases in pensions. Lastly, Spanish households experienced a 5.4% rise in net capital income (interest and dividends) last year.
In nominal terms, the volume of GDI (773 billion euros) is now considerably higher than before the crisis. Due to the higher growth in consumer prices since then, GDI in real terms is still 6% below pre-crisis levels.
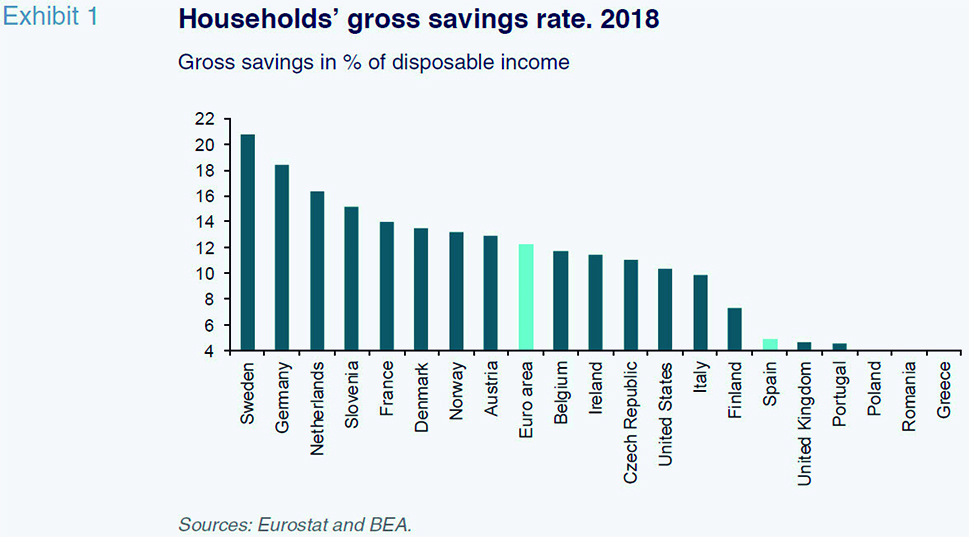
Final consumption expenditure increased by 4% in nominal terms in 2018, which is comparable to 2017. Since growth in spending outpaced that of GDI, household savings diminished for the fifth year in a row, resulting in a reduction of the gross savings rate to 4.9% of GDI, the lowest level since this statistic was first published in 1999.
That rate is considerably lower than the eurozone average (Exhibit 1), which stands at around 12%. It is also one of the lowest in the EU with only Greece, Portugal, the UK and some of the Eastern European countries presenting lower rates. Moreover, it has proved more volatile, too. The highest savings rates are observed in Germany (18.4%) and Sweden (20.7%), with an increasing trend in both countries.
The reasons for such a sharp drop in the savings rate are somewhat obscure, thereby requiring more in-depth analysis. In theory, both structural and circumstantial factors could account for this trend. These include an ageing population, low interest rates, the wealth effect, a reduction in disposable income, the unemployment rate’s downtrend, and the effect of ‘pent-up’ demand. However, these factors are present in other eurozone countries where the savings rates have moved along a different trajectory. For this reason, it is doubtful that these factors alone explain the decrease in Spain’s savings rate.
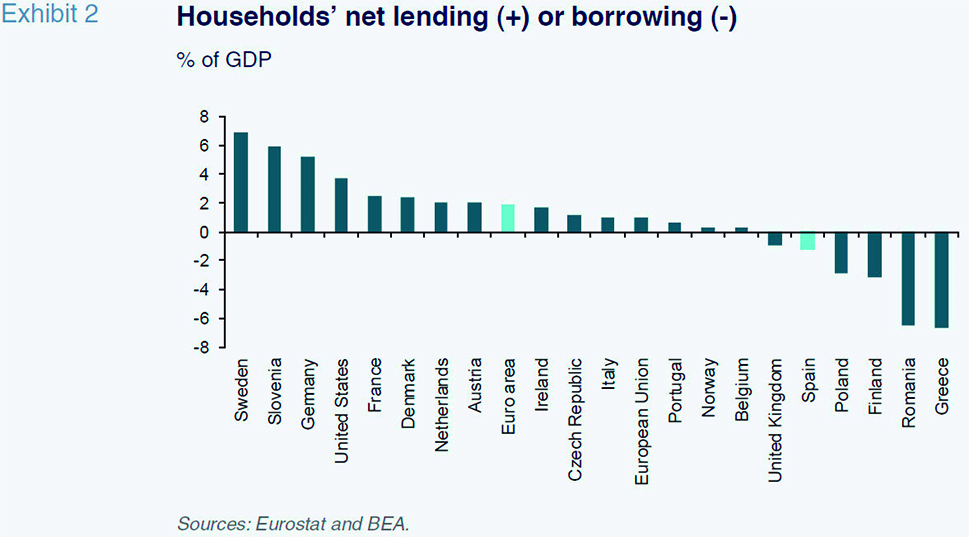
The drop in the savings rate, coupled with growth in household investment (mainly housing), has widened the sector’s financial deficit from 0.4% of GDP in 2017 (the first negative balance since 2008) to 1.2% of GDP in 2018. That shift from a net lending position to a net borrowing requirement marks a significant change in Spain’s pattern of growth since the economic recovery.
With the exception of some Eastern European economies and Finland, only Spanish, Greek, and British households presented a net borrowing requirement in 2018 (Exhibit 2). By comparison, Germany and Sweden registered surpluses of 5.2% and 6.9%, respectively.
Despite the net borrowing position evident in the nation’s non-financial accounts, Spanish households’ indebtedness has not increased in nominal terms. This is partly because the financial accounts drawn up by the Bank of Spain reveal a small financing surplus rather than a deficit. This discrepancy is due to the difference in how the Bank of Spain and the national statistics office’s non-financial accounts classify individuals as households versus non-financial corporations. Another explanation is the fact that although Spain’s households took on net new debt in 2018 for the first time since 2010 (i.e., the volume of new loans was higher than the balance of repayments), the value of their overall borrowings diminished, primarily due to the cancellation of previously arranged debt. Elsewhere, other household liabilities, such as retail credit or outstanding account balances, have been rising, so that total household liabilities increased in 2018.
In short, the household sector’s ratio of debt-to-GDI continued to decline, ending 2018 at 97%, the lowest level since 2003. The household debt service burden (principal and interest) also trended lower so that by the end of 2018 it fell below levels last seen at the turn of the century. The sharp drop in interest expenses explains this trend.
Additionally, a recovery in house prices has increased household’s property wealth. As a result, household balances remained solid. Thus, despite the net borrowing requirement, this trend is unlikely to trigger a correction in consumption or a recession. Still, these developments are worth observing. If current trends continue, an imbalance could emerge in the medium term. Also, while the household deficit on its own is not enough to trigger a recession, it could serve as a source of vulnerability in the event of recession. Under this scenario, Spain’s households would have to significantly pare back their spending in order to balance their finances. Lastly, household debt is not a concern at the macroeconomic level, but it could be at the microeconomic level for individuals below certain income thresholds who may be becoming more vulnerable.
Non-financial corporations
The rate of growth in non-financial corporations’ gross operating surplus (GOS) eased to 2% in 2018. GOS, plus net income from interest and other capital income, fuelled growth of corporate income to 305 billion euros, which was subsequently reduced to 273 billion euros after the payment of taxes and employee benefits.
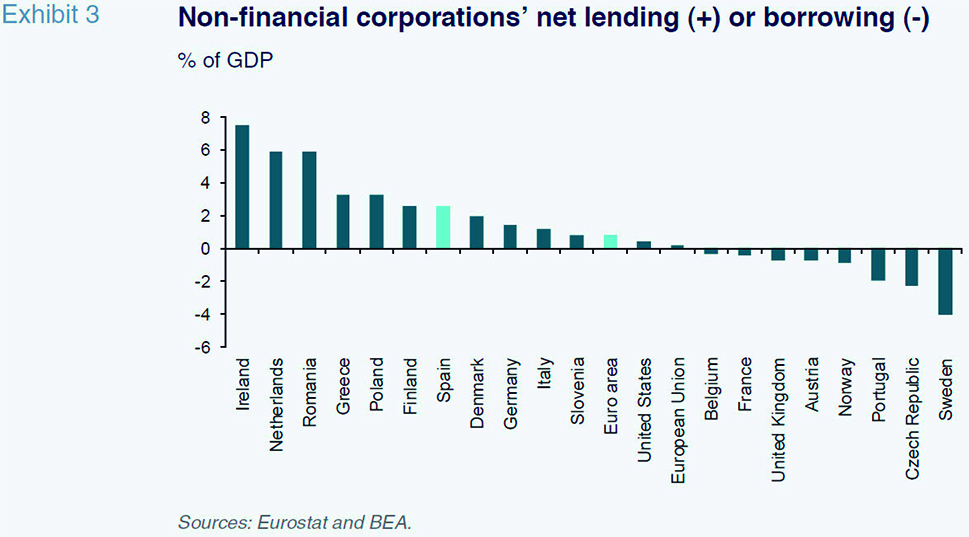
Of that sum, 22% was earmarked for dividend payments, which was the second lowest reading in the series after 2010. The remaining amount, equivalent to 17.7% of GDP, constituted corporate savings. Of those savings, 88% went to fund capital expenditure, which increased by 6.4% year-on-year. Given that savings exceeded investments, Spain’s non-financial corporations generated a net financing surplus equivalent to 2.5% of GDP. Notably, the corporate sector has generated a financing surplus every year since 2009.
This surplus is higher than the eurozone average, which stands around 0.8% of GDP (Exhibit 3). Germany’s corporations generated a surplus of 1.4% of GDP, while their counterparts in France, Austria, Portugal and the UK generated a net borrowing requirement.
Despite recording a net lending position in 2018, Spain’s non-financial corporations increased their borrowings slightly last year, from 1,124 billion euros to almost 1,126 billion euros. However, measured in terms of GDP, corporations continued to deleverage. Spanish companies earmarked these new net liabilities, coupled with the cash derived from their net financial surplus, for the purchase of financial assets, specifically equity investments and deposits.
Government
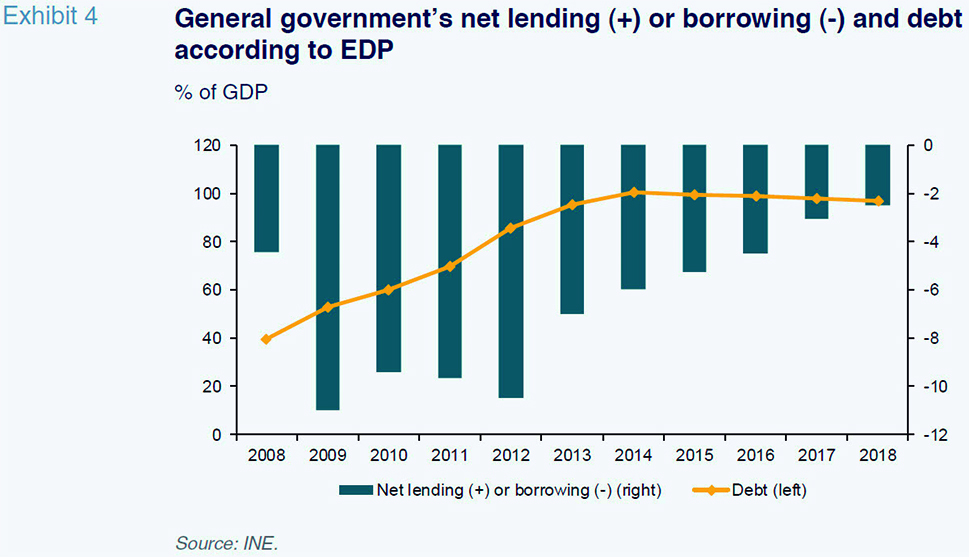
The Spanish government’s current income fell short of its current expenses by 1.68 billion euros in 2018. This is the strongest performance since the public sector began recording negative savings rates in 2009. Thus, despite sharp growth in public investment in 2018, the government’s net borrowing requirement, measured as the public deficit, fell to 2.48% of GDP. However, the improvement in the headline deficit masks a standstill in the structural deficit.
Looking at the various levels of government, the central government recorded a deficit equivalent to 1.36% of GDP, while social security and regional governments recorded deficits of 1.4% and 0.23% of GDP, respectively. Conversely, Spain’s local governments presented a surplus of 0.5%.
The overall public deficit led to an increase in borrowings in terms of the excessive deficit procedure (EDP) of 2.5%. Nevertheless, the ratio of debt-to-GDP declined by one percentage point to 97.1% (Exhibit 4).
Savings and overall net lending position of the Spanish economy
Gross national savings, measured as the sum of government, household and corporate savings, amounted to 22.9% of GDP, which is virtually flat year-on-year. While still in negative territory, the improvement in the government savings rate offset nearly all of the decline in savings by Spain’s households and corporations.
Meanwhile, total gross capital formation increased by 0.8 percentage points to 21.9% of GDP. As a result, factoring in net income from foreign capital transfers, the Spanish economy recorded a net lending position equivalent to 1.5% of GDP. This represents a decline of around two percentage points from figures recorded between 2013 and 2017.
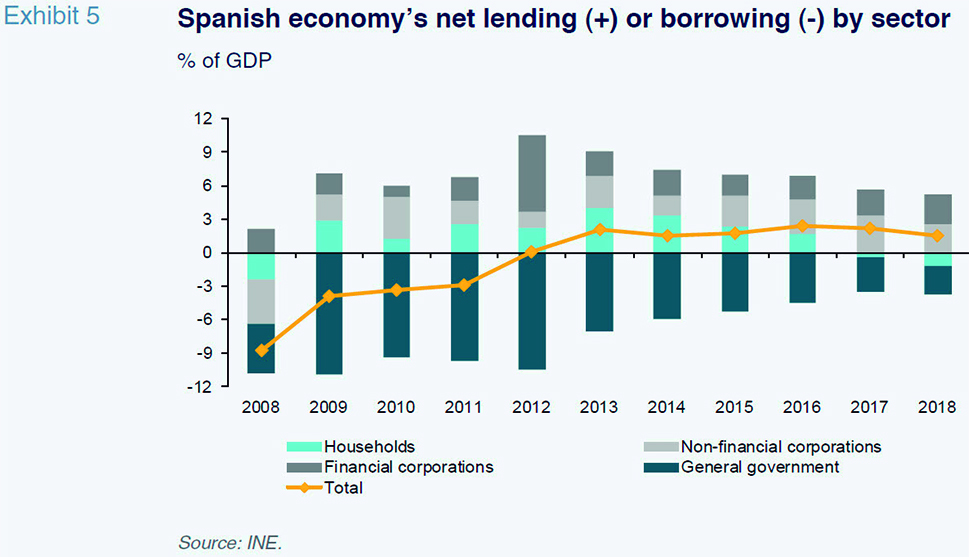
In the years since the financial crisis, Spain’s households and non-financial corporations maintained a net lending position, a significant divergence from the public deficit trend. This reflected the simultaneous processes of deleveraging of the private sector and indebtedness of the public sector. However, in 2017 and 2018, that pattern began to shift. Specifically, the public deficit narrowed while Spain’s households moved from a surplus to a deficit. Conversely, Spanish corporations continued to record a surplus during this period (Exhibit 5).
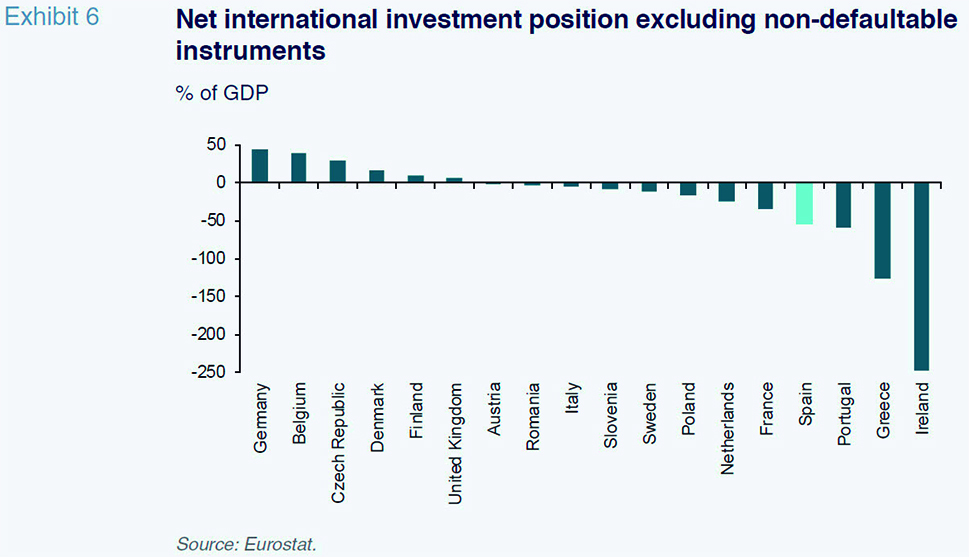
The net lending position recorded by the Spanish economy over the last few years has enabled a reduction in Spain’s net international investment position (NIIP) deficit, excluding non-defaultable instruments, from 78.3% of GDP in 2009 to 53.9% in 2018. Nevertheless, Spain continues to present one of the highest NIIP deficits in the EU. Only Greece, Cyprus and Portugal –excluding the particular cases of Ireland and Luxembourg– have recorded higher NIIP deficits (Exhibit 6).
Such a high level of debt is a source of vulnerability vis-a-vis the rest of the world. A recession or financial market stress could erode confidence in the Spanish economy’s solvency. It is therefore important that Spain continues to record a net lending position, as this will enable it to reduce its foreign borrowings.
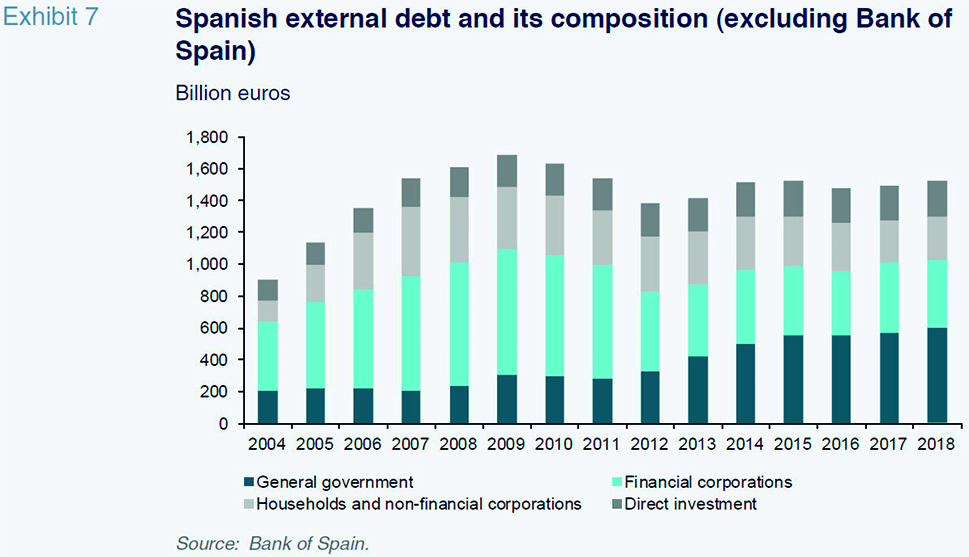
For these reasons, Spain’s overall situation would be strengthened if households returned to a net lending position similar to the period before 2017. This is despite any short-term deceleration in consumer spending and GDP growth that might occur as a result. The same can be said of the public sector, especially given the fact that it holds almost 40% of Spain’s gross foreign borrowings (excluding those corresponding to the Bank of Spain), up from 18% in 2009 (Exhibit 7).
Conclusion
The return of the household sector to a net borrowing position after eight years in surplus constitutes one of the most significant developments in the Spanish economy. This can be attributed to the notable decline in the household savings rate, which now stands below many other European economies. This trend has supported a robust economic expansion and accounts for Spain’s relatively stronger GDP growth rates to that of the eurozone average. However, this means an economic slowdown would likely precipitate a sharp correction in spending.
As a result, with Spain’s households and the public sector registering a net borrowing requirement, the country’s non-financial corporations are bearing the full weight of propping up the economy’s overall surplus, which is necessary if the country is to reduce its high NIIP deficit and shore up confidence in its solvency. Moreover, those same corporations are responsible for the bulk of the economy’s productive investment. For this reason, it would be preferable to maximize the amount they allocate to capital expenditure, even if this requires an increase in borrowing. Likewise, households and the government would ideally generate the surplus needed to finance the corporate sector’s investment. However, the non-financial corporate sector has recorded a net lending position, as in most developed nations, a trend which became particularly pronounced after the financial crisis in 2008.
María Jesús Fernández. Senior Economist at Funcas