
Growth and competitiveness in Spain’s corporate sector: Recent trends and outlook
An analysis of Spanish firms’ financial data reveals that growth prior to the recent recession was based on decreasing input costs, but was not accompanied by efficiency gains. Post-recession, these firms, and in particular those in the manufacturing sector, have reduced their leverage and increased earnings, but as input costs and interest rates rise, attention will need to be paid to determine if current growth will be sustainable.
Abstract: In order to draw conclusions about the competitiveness of the Spanish economy, this paper analyses Bank of Spain data on Spanish firms prior, during and after the recession. Our analysis reveals that economic growth during the first period was based on decreasing costs of inputs, labour and capital, as total factor productivity was also decreasing. During the recession, many firms disappeared and both employment and output dropped. However, since 2015, the Spanish economy has overcome the worst phase of the crisis that took place from 2009 to 2014. Activity growth is recovering and, in contrast to what happened in the first years of the period, exports and manufacturing are growing strongly, productivity increasing and incomes growing in real terms. Currently, the corporate sector has reduced its debt ratio to pre-recession levels and has experienced moderate growth and earnings momentum. Also worth noting is the fact that the growth impetus has shifted in recent years towards the manufacturing sector. But the sustainability of this growth may be called into question as labour and capital costs, at historically low levels, begin to increase. Going forward, in an environment of increasing real wages and interest rates, sustainable corporate growth may only be achieved through efficiency gains.
Introduction
This paper analyses the performance of the Spanish economy between 1999 and 2016 based on the information published by the Bank of Spain’s Central de Balances. The aim is to provide relevant conclusions about the breakdown of Spain’s competitiveness derived from aggregate information about its firms. The analysis focuses on the prior phase of growth, the subsequent financial crisis, and Spain’s recent recovery. First, it is important to understand which was the growth model among Spanish firms before the economic crisis beginning in 2008. Second, it is worth observing how the financial crisis, with remarkable duration and intensity, has affected the structure of Spain’s firms. Lastly, this paper describes the growth model that Spanish firms have adopted during the most recent period of expansion in employment and aggregate output. Based on this analysis, it is possible to gain some insight into the growth model we can expect to see in the coming years.
The analysis presented in this paper focuses on the decision-making process and results obtained by firms. Firms’ investment or growth decisions are conditioned to maximise their present value. Under certain simplified scenarios, these kinds of decisions are equivalent to those of an enterprise that maximises its profits. Thus, this methodology enables us to read and interpret the firms’ accounting information in economic terms, thereby simulating a similar analytical approach used to track macroeconomic data. In addition, it allows for the use of economically significant concepts derived from the companies’ accounting records, such as the cost of capital and profits. This analysis is applied to the entire sample of firms that report to the Bank of Spain and to the manufacturing segment. Manufacturing companies have a higher degree of exposure to foreign competition, thereby making it easier to observe the effects of their competitiveness.
Methodology
The Bank of Spain’s Balance Sheet Data Office (hereinafter, the CBBE for its acronym in Spanish) mainly collects information that firms provide for financial statement purposes (Bank of Spain, 2017). The primary information compiled by the Data Office relates to individual companies; however, the information, which is publicly disclosed, is aggregated and then broken down by economic sector, company size and ownership structure (public vs. private).
The use of data reported directly from the firms themselves ensures greater analytical consistency. This is especially true when the assets on the companies’ balance sheets are used as a proxy for the firms’ stock of capital. The CBBE data is also useful for analysing economic aggregates for different groups of companies and sectors. This allows us to focus on segments that tend to get lost in macroeconomic studies. In analysing the firms’ data, this paper distinguishes between the manufacturing sector and the whole sample. The manufacturers represent the group of companies most exposed to foreign competition and act as a good benchmark for analysing the competitiveness of Spain’s firms, and by extension, the Spanish economy. The sample of manufacturing firms (industry, excluding energy) represents around 6% of Spanish GVA but around 30% of the manufacturers’ GVA.
Earnings performance
Economic theory holds that firms which maximises their value will take growth decisions (usually investment decisions) when the returns on their current investments exceed their opportunity costs. Under these circumstances, it is expected that growth will create value (Tobin, 1969). The opposite will occur (disinvestment or contraction) when their return on assets is lower than their opportunity cost. We analyse in this section companies’ returns and in the following section their growth.
Accounting profit excludes important implicit costs such as the loss of the purchasing power of monetary assets, debt due to inflation, and the opportunity cost of equity. The incorporation of those costs into the accounting figures would generate many errors as it would have to be done manually and individually for each company; however, it is feasible to do it at the level of the major aggregates for which the economy’s deflators and the average risk premium are more representative.
Exhibit 1 presents the rates of return on operating assets obtained exclusively from firms’ non-financial income and expenses, proportionately discounting assets reported as financial in nature. At over 15% of equity between 1999 and 2007, the rates of return measured using accounting criteria were consistently high. Expressed in economic terms they were also positive at over 2.5% of equity. Returns fell sharply in 2008 but remained positive in economic terms at around 1%. From 2009 to 2014, this aggregate indicator dipped into negative territory and did not top the 1% mark again until 2016. While the average return measured using accounting criteria in 2016 is lower than that of 2008, in economic terms it is somewhat higher, namely 1.4% in 2016 versus 1.15% in 2008.
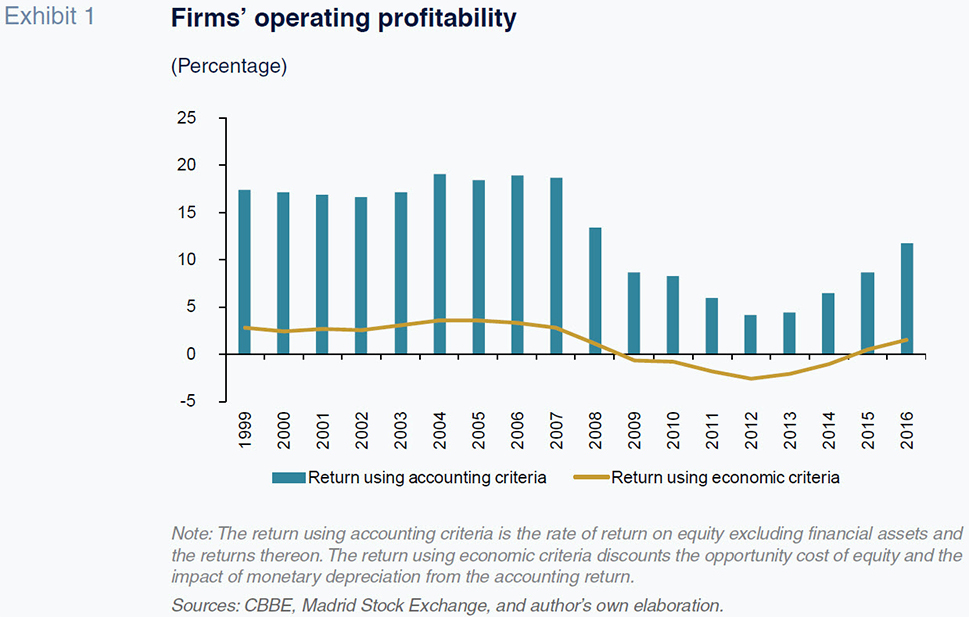

When the rates of return are calculated for manufacturing firms, the results are relatively higher throughout the entire period, which may mean that they compensate for a somewhat greater degree of risk than the one reflected in their costs of opportunity. At any rate, the returns during the last three-year period would appear to be approaching those recorded by manufacturers prior to the recession. These firms’ recovery may be ahead of companies in other sectors since they are well-positioned to tap foreign demand (exports) as an avenue for growth.
In 2016, Spain experienced positive economic and employment growth, which coincided with an increase in corporate earnings (profit). Nevertheless, these earnings have yet to recover to pre-crisis levels. However, the inflation trend needs to be considered when measuring these firms’ earnings performance in economic terms. Between 2014 and 2016, product prices were largely stable, with the inflation rate close to zero. Unlike the previous period of growth, firms haven’t benefited from the monetary depreciation of their borrowings, nor, seen from the standpoint of their assets, have they enjoyed the value gains on their capital goods. Consequently, this may explain the differences in earnings returns.
Growth in output and demand for the factors of production
Table 2 outlines the rates of real growth in value added, growth in employment, and growth in fixed assets, calculated in all instances for companies surviving from one year to the next. The sample’s real growth in value added was on average below 2% between 1999 and 2008, which is less than GDP growth during the same period, suggesting an element of bias in the sample. One of the industries under-represented in the sample is construction, particularly the real estate segment, which registered a sharp growth during that period. This bias becomes more obvious when analysing data from the manufacturing sector. Specifically, manufacturers’ output growth had an annual average rate of -0.5% between 1999 and 2008. Thus, while the construction and property sectors were expanding rapidly, the manufacturing firms were virtually stagnant.
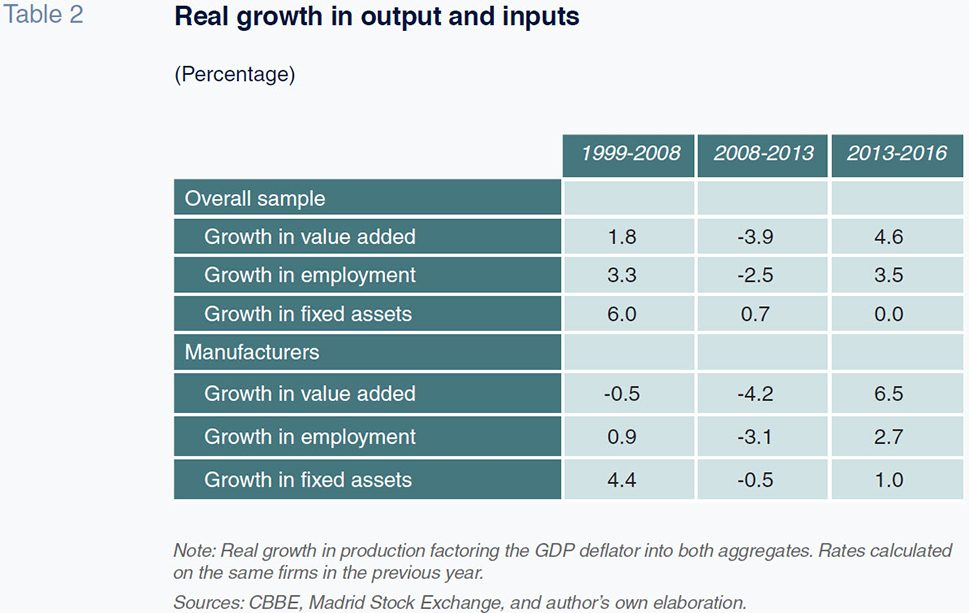
Elsewhere, Spain’s firms significantly stepped up their hiring during those years. Growth in employment increased by 3.3% on average until 2008 and coincided with a period of wage contention, as we will see later on in this section. At a rate of 6%, Spanish firms also substantially increased their asset bases (fixed assets).
Spain fell into recession between 2009 and 2013. The contraction observed in the Spanish economy’s growth was more evidently driven by the disappearance of firms than by those that survived.
During the last three years for which there is information available, growth in value added and employment has been upbeat, with manufacturers’ indicators standing out in particular. Specifically, growth in value added was nearly 7% compared to very modest growth during the decade of expansion prior to 2008. In contrast, there was scant growth in fixed assets during these last three years, suggesting companies had sufficient idle capacity and that the growth via the capital factor has come from higher rates of capacity utilisation. Comparing the growth in the number of employees (not affected by prices and already adjusted for full-time equivalents) between 1999 and 2008 for all companies versus the manufacturing subset, manufacturing firms contributed to a lower proportion of total employment in Spain, with the two rates of growth several percentage points apart. From 2009 on, however, this gap narrows significantly.
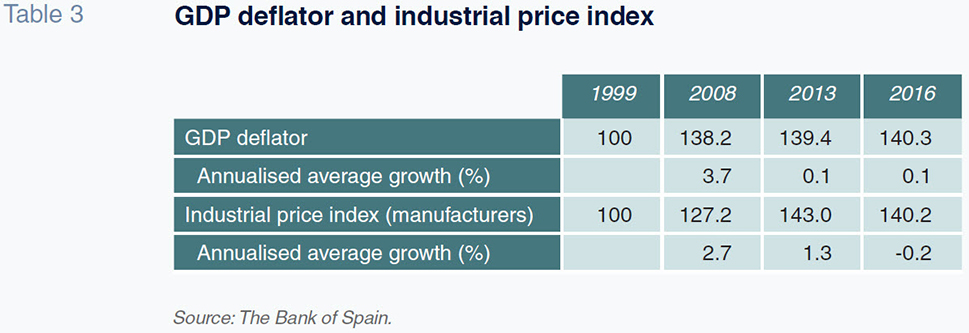
Estimating firms’ real growth or productivity inevitably comes up against the problem of the prices at which output is measured. When analysing corporate aggregates, the use of a deflator (
i.e., GDP deflator) is a good proxy for the composition of the sample’s output. Between 1999 and 2008, as shown in Table 3, the GDP deflator increased at an annual rate that was one percentage point higher than the growth in the industrial price index. In contrast, between 2013 and 2016, the GDP deflator barely budged during the entire period (+0.1% in annualised terms); nor did the industrial price index move much (-0.2%). If the real growth figures for the manufacturing sector are recast using the industrial price index rather than the GDP deflator during the first sub-period (1999-2008) contemplated in Table 2, the real growth in the manufacturers’ output is one percentage point higher (+0.5% versus -0.5%). During the years of recession, the contraction in real terms sharpens in comparison with the figures in Table 2 (-5.4% versus -4.2%).
Calculations in Table 2, deflated using just the one index, permit direct observation. By comparing the rates of growth in value added for all firms to that of manufacturing firms, in nominal terms, the manufacturing industry contributed proportionally less to Spain’s productivity between 1999 and 2008 (a decade during which its average rate of growth is more than two percentage points below the total). Their share of output remained constant throughout the recession (they contracted at the same pace as the sectors as a whole). However, between 2014 and 2016 manufacturing firms began to increase their share of Spanish productivity, registering growth that was 2 percentage points higher than the entire business sector. That said, this trend has persisted for just three years thus far.
Productivity and unit costs
Table 4 provides estimated measures of the productivity rates and unit costs of firms’ factors of production and shows the trend in total factor productivity and total unit costs. The latter is the most comprehensive means of measuring the competitiveness trend of Spain’s companies as the trend in productivity is influenced by the trend in factors’ prices and their rates of utilisation. Again, these estimates have been made for firms as a whole as well as for the manufacturing sector.
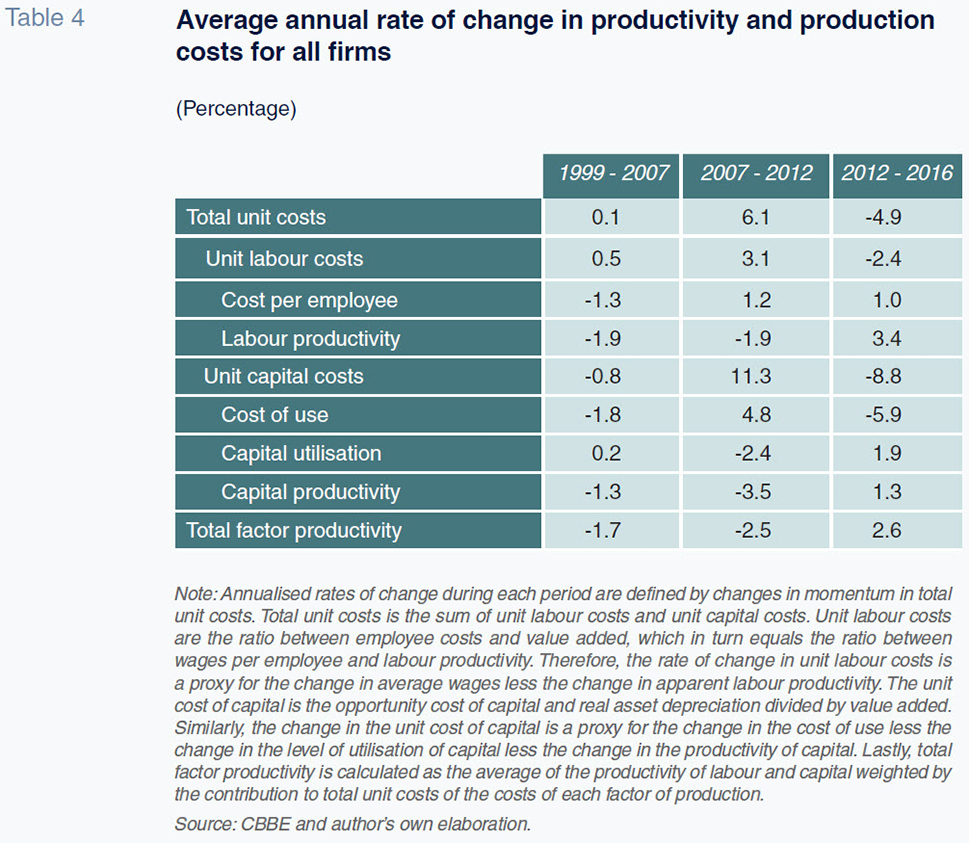
Unit labour costs are calculated as real average wages divided by labour productivity. As a result, the rate of change in unit labour costs is a proxy for the change in real wages less the change in labour productivity. Similarly, the cost of the capital factor is the cost of capital used divided by the productivity of the assets used plus the cost of unused assets. In terms of rates of change, the change in unit capital costs is a proxy for the change in the cost of use less the change in the productivity of capital less the change in the level of capital utilisation (operating assets). Lastly, the table’s bottom row presents the rate of change in total factor productivity, which can be summed up as the average of the partial productivities of both factors of production weighted by the contribution of each factor to total output.
Between 1999 and 2007, total unit production costs increased at an average annual rate of 0.1%. This means that the competitiveness of the overall sample of firms was virtually flat in terms of total production costs. Unit labour costs increased during that period at an average annual rate of 0.5%, offset by an average annual decrease in unit capital costs of 0.8% (the weight of labour costs in total unit costs is higher than that of capital). However, it is noteworthy that the increase in unit labour costs was not attributable to real growth in costs per employee (real wages); rather costs per employee decreased and at the same time labour productivity registered a more pronounced decline. Using the GDP deflator as the benchmark for the trend in overall company prices, the figures suggest that the growth in output observed during this period was achieved by hiring employees whose costs were less than the average and whose productivity was similarly below average. The trend in the capital factor during the years of growth between 1999 and 2007 is similar: the cost of using capital fell at an annual rate of 1.8%, driven mainly by the decline in real borrowing costs. However, capital productivity also declined, contracting at a rate of 1.3%. This means that the decline in the unit cost of capital was shaped more by the drop in the cost of use, which offset the reduced productivity of this factor. Total productivity between 1999 and 2007 decreased at an annual average rate of 1.7%, due to the drop in the productivity of both labour and capital during the period. It is plausible that the composition of the overall sample tracked by the CBBE may penalise the estimated trend in productivity. It is impossible to determine the price deflator applicable to this sample and the GDP deflator may overestimate the impact on account of the weight of the construction and real estate sectors in the economy relative to the sample. Even assuming that the trend in the correct deflator was between GDP and the industrial production deflators (compared in Table 3), the average loss of productivity during those years would still stand at around 1% per annum. The firms’ growth picture painted by the figures for those years was based on the incorporation of factors of production with diminishing marginal returns and also diminishing marginal costs. The growth in output sought by the companies during that period was achieved in the absence of growth in production costs (total unit costs barely budged during the entire period) despite the overall fall in efficiency.
The next period runs from 2007 to 2012, the latter year being when total unit production costs peaked (and economic profits bottomed). In 2007, Spain’s firms were in reasonably good health in economic terms: their profits were high and their production costs remained low. However, that same year the cost of capital began to increase as real rates rose. This trend occurred across Europe but was especially intense in Spain where the risk premium on the country’s sovereign bonds increased dramatically in subsequent years. The sharp drop in demand as a result of the financial crisis prompted Spanish firms to rein in their use of the factors of production, which had the effect of sending unemployment soaring during this period. Over the five-year period, firms’ total unit costs rose sharply (over 6% per annum), driven mainly by the strong growth in the cost of capital. The productivity of both capital and labour fell sharply so that total factor productivity decreased at an annual rate of 2.5% from 2007 to 2012. Those were years marked by a historically deep recession which drove companies’ earnings into record loss territory.
The last period analysed runs from 2012 to 2016. Because 2012 was an exceptionally poor year in terms of corporate profitability, the rates of change shown for this four-year period should be interpreted with caution. Nevertheless, they provide a glimpse into the growth model most recently pursued by Spain’s firms. During this last period, total unit costs have fallen considerably, driven to a greater degree by the drop in unit capital costs (-8.8% per annum). This decline is undoubtedly due to a drop of nearly 6% per annum in the cost of using capital. However, it can also be attributed to annual growth of nearly 2% in asset utilisation and, to a lesser extent, growth in asset productivity. Labour costs also play a role in the decline in total unit costs, more so due to the growth in labour productivity (average annual rate of 3.4%) than the decline in real wages (which was the case during the growth period to 2007). In fact, total factor productivity (the sum of labour and capital productivity) registered average annual growth of 2.6% between 2012 and 2016. This growth in productivity is one of the defining characteristics of this last sub-period into which our analysis of costs and productivity has been divided. It is important, however, to be cautious when drawing any conclusions as we may be witnessing a correction in the under-utilisation of factors that is not captured in the statistics that track the rate of productive capacity utilisation.
This analysis, based on samples that change over the years, has the advantage of reflecting fluctuations that occur across a number of firms, such as the advent or disappearance of companies, the change in the economy’s sector make-up or a change in the relative sizes of Spain’s companies. However, it also raises questions as to whether the year-on-year changes are truly representative of Spain’s firms. Table 5 presents the productivity estimates for the manufacturing companies within the common sample subsets of years, using the industrial price index as a deflator.
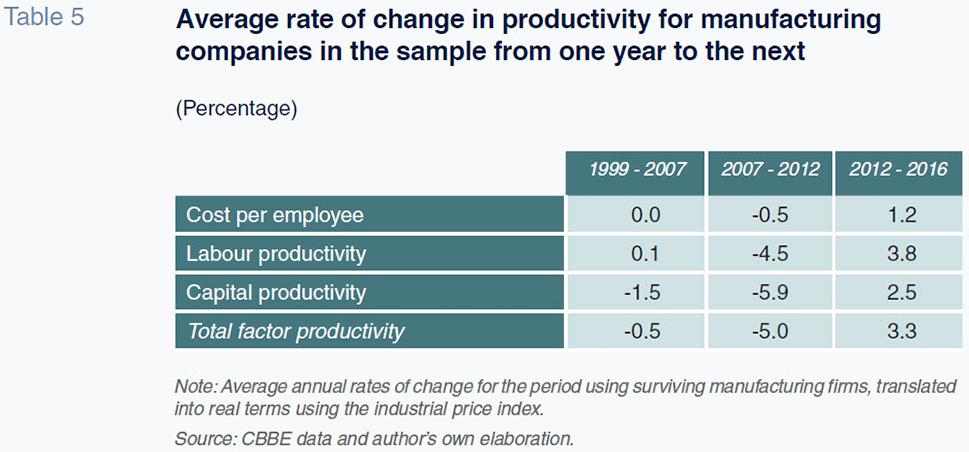
These estimates complement some of the results obtained in the previous table. Real wages (cost per employee) between 1999 and 2007 barely change in average annual terms on this basis, whereas in Table 4 they showed an annual contraction of over 1%. The difference, as explained earlier in this article, is largely due to the deflator used. The same phenomenon occurs with estimated labour productivity, which is virtually flat during the early years. The differences compared to the Table 4 estimates is again attributable to the choice of deflator. It is therefore the productivity of capital that falls during
the period, which may be a logical response to the increase in demand for a factor that presented a diminishing marginal return in the context of a downtrend in its cost (sustained and pronounced decrease in the cost of capital in real terms). By these calculations, the loss of total factor productivity between 1999 and 2007 averages 0.5% per annum. Using the sample of surviving manufacturing firms, the estimates show no growth in real average wages per employee between 2007 and 2012. Instead, real costs per employee actually decline. The fact that the sample of all manufacturing firms (and not just those that survived) showed real growth in this factor’s cost leads us to an interesting conclusion: the manufacturing companies that disappeared during the recession employed people who earned below-average wages, creating the apparent increase in real average wages in the sample. The loss of productivity between 2007 and 2012 is greater in the sample of surviving companies. As for the final four-year period, although the broad trends are the same for both samples, the growth in real wages is somewhat lower in the sample of surviving companies only. The rate of growth in the productivity of labour is also a little lower, though at 3.8% it is well above the growth in real wages. The annual growth in total factor productivity during this last period averages 3.3%.
Productivity gains have proven compatible with sharp growth in employment and real wages during this last period. However, once again these numbers should be read with caution. The depth of the crisis unleashed in 2008 was such that in order to recover the productivity lost between 2007 and 2012 (surviving company sample) it will be necessary to maintain the rate of productivity growth observed between 2012 and 2016 until 2019. It is also possible that these estimates still fail to fully correct for the effect that the underutilisation of the factors (via the average capital utilisation rate) has on the total productivity measures. As a result, the actual productivity gains and losses may have been somewhat narrower.
Despite all these caveats, there are positive takeaways from the recovery of firms’ output, particularly the manufacturers, such as: (i) the
well-documented fact that the growth in their exports is outpacing that of their peers in neighbouring countries; and, (ii) the fact that by 2016 corporate profits were in line with those of 2008. The latest data published by the CBBE (1Q2018) suggest that the trends observed in this analysis have generally persisted.
Borrowing costs and leverage
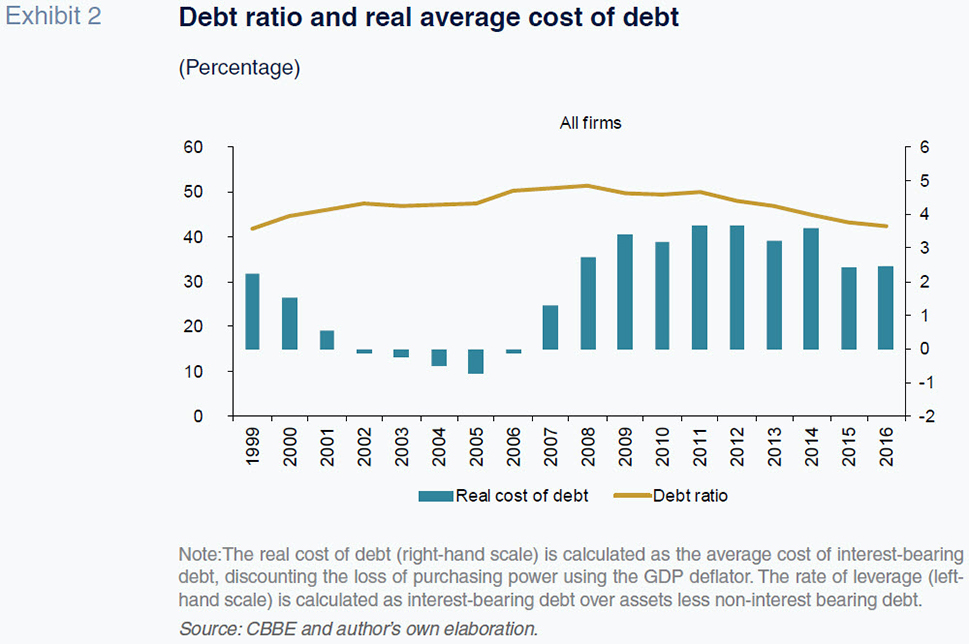
Exhibit 2 presents the average real cost of debt and the rate of leverage (defined as interest-bearing debt over net assets). The trend in the average cost of borrowing for all firms demonstrates a pattern that mirrors the trend in the real rates of interest on 10-year bonds. This trend has been mitigated by the fact that the companies have locked in some of their debt at historically low costs and their carrying amounts have not been restated for marginal costs. Between 1999 and 2005, the real cost of debt declined from over 2% to around -0.7%. Likewise, firms’ debt ratio also registered persistent growth, increasing from a little over 40% in 1999 to 50% by 2005. This trend continued until 2008 when the debt ratio peaked at over 50% of net assets. Meanwhile, the real cost of debt began to increase in 2006, a trend that lasted until 2009. This metric remained high from 2009 to 2014. During those years, the nominal average cost of debt was very close to the real cost as the GDP deflator between 2009 and 2014 averaged 0.1%. Real borrowing costs came down in 2015 and 2016, in part thanks to somewhat higher inflation (average GDP deflator in 2015 and 2016 was 0.4%) and a drop in average nominal costs. This left real borrowing costs below 2.5%, which in turn has boosted companies’ earnings within the last couple of years. Having peaked in 2008, leverage levels embarked on a virtually consistent decline. Indeed, at 42%, the level of leverage in 2016 was comparable to that of 1999.
Outlook for non-financial corporations
The financial and economic information compiled by the Bank of Spain provides an opportunity to better understand the state of the Spanish economy through an analysis of firms’ profit measures, use of capital and labour and financial structures in a manner that is easier than using national accounting statistics. This paper analyses the data for large groups of firms. The analytical approach seeks to interpret the companies’ financial variables in a manner akin to that used widely in macroeconomic analysis. The analysis focuses on comparing firms’ current state to their situation prior to the recession.
This paper identifies the divergent trend in Spanish prices relative to the rest of the eurozone as one of the factors shaping the growth model adopted by the Spanish economy during the beginning of this century. Just as nominal interest rates fell to unprecedented levels in Spain, inflation had the effect of implying negative real rates of interest. The attendant growth in the value of real estate assets meant that growth and resources were concentrated in the construction and property sectors. Moreover, the decline in the cost of capital, coupled with the availability of manpower, forged a growth model based on the incorporation of capital and labour which tended to present diminishing marginal costs across all firms. The growth observed prior to the recession was not accompanied by efficiency gains; rather, the firms’ competitiveness was predicated on the diminishing cost of their factors of production. However, it cannot be said that Spain’s firms behaved irrationally during that period. The downtrend in borrowing and labour costs paved the way for growth in output and competitiveness gains in parallel (costs per unit of production decreased) without having to take risks on uncertain innovations, add new technological capital or invest in their human capital. Obviously, this is not true for every firm across the board, but that is the trend observed on aggregate. Spain’s firms (the overall sample and the manufacturers alike) also increased their borrowings during those years, which were marked by a notable drop in real interest rates.
With the onset of the financial crisis in 2008, Spain’s firms began to downsize. This is evidenced by the sharp drop in employment (and the destruction of companies that cannot be singled out from the aggregate figures) as well as the decline in firms’ output. Their earnings deteriorated rapidly with companies reporting losses that peaked in 2012 and 2013. In terms of efficiency measures, partial and total factor productivity fell sharply and continuously for several years, while unit costs per euro of production shot up.
From 2014, the trend in earnings began to rebound. Companies continued to post losses on aggregate but earnings momentum improved, with aggregate profits reported by the end of 2016. That year, companies’ earnings expressed in terms of profitability were still significantly below the levels of 2007. This was true whether the figures were measured in accounting or economic terms. Growth in output has been positive for the last three years with the growth in employment and, to a lesser degree investment, standing out. These trends are even stronger in the manufacturing sector. This contrasts with
the period prior to 1999 when the sector’s growth lagged behind the overall population of firms. It is likely that manufacturers’ growth is being driven by exports, and that these firms act as an engine for growth at the other companies. The trend in corporate efficiency is very positive, as is the trend in unit costs. Meanwhile, growth in employment is proving compatible with growth in real wages, another phenomenon that had failed to materialise until recently. The corporate sector has reduced its debt ratio to pre-recession levels and is delivering still-moderate growth and earnings momentum. The primary driver of growth has shifted in recent years towards the manufacturing sector where pre-recession efficiency and unit costs levels are within target.
Of note is the fact that borrowing levels in 2016 came down to levels similar to those of 1999. As well, aggregate earnings were positive that year, too. As a result, the outlook for profit looks bright and companies’ capacity to self-finance from cash flow is improving. There are, however, a few remaining doubts whose resolution in the years to come will tell us whether the growth model has really changed from that observed during the pre-recession era. The fear is that the improvement in productivity indicators could simply be due to a post-recession readjustment that has led to enhanced utilisation of previously idle resources.
Currently, nominal borrowing costs remain historically low and inflation is showing signs of a slight uptick. This implies negative real rates, thereby enabling Spain’s corporate sector to borrow at a very low effective cost. Simultaneously, the credit crunch in this sector appears to be easing. The trend in real wages has been good for business in recent years, as this factor’s cost has remained relatively stable. Thus, a production factor price scenario that is very similar to that seen during the early years of this century has emerged, a phenomenon that has undoubtedly supported the recovery in corporate earnings.
However, analysts predict nominal interest rates will increase over the medium-term. This would nudge the marginal cost of capital up from current levels. In parallel, the outlook for stronger corporate profits and margins will influence a rise in the cost of other inputs such as labour. As a result, the current growth will only prove sustainable if Spain’s firms eke out productivity gains to offset the increase in the real prices of the factors of production. This would help Spanish firms remain competitive relative to firms in neighbouring countries. Otherwise, it is likely that the increase in the prices of labour and capital will cause firms to reduce their demand for these factors.
Corporate managers must take growth decisions today based not only on current labour and capital costs but also anticipated trends in the years to come. Beyond productivity measures, corporations must work towards adding more value to their products and ensure that they can continue to grow in situations where the productive factors are not underemployed (i.e., in which unemployment is not so high or the rate of capacity utilisation not so low). The incorporation of technological capital, investment in human capital, and innovation are widely-proven drivers of long-term corporate growth and earnings sustainability.
Policy makers must send the right signals to the corporate sector by promoting innovation in general and corporate R&D in particular. They should also aim to improve the education and skills of job-seekers and future generations. Measures already introduced to make the labour market more flexible and contain labour costs may be running out of steam. Their capacity to stimulate growth as profit margins recover and Spanish firms self-finance their operations in line with pre-crisis levels cannot persist indefinitely.
References
BANK OF SPAIN, CENTRAL BALANCE SHEET DATA OFFICE (2017), Annual results of non-financial corporations, 2016. Bank of Spain publications.
BANK OF SPAIN (2018), “Quarterly report on the Spanish economy”, Economic Bulletin, 2/2018.
TOBIN, J. (1969), “A General Equilibrium Approach to Monetary Theory”, Journal of Money Credit and Banking, 1.
Jorge Rosell Martínez. Professor at the University of Zaragoza. Research group Compete S52_17R Autonomous Community of Aragon