The dynamics of public debt and economic growth in Spain
Lessons from Spanish history teach us that there is a correlation between an increase in public debt and a reduction in growth prospects. Policy makers should consider this as part of the incentive for fiscal consolidation in their efforts to meet ambitious Stability and Growth Pact targets.
Abstract: Long term debt sustainability – and its relationship with growth – is one of the key issues facing the Spanish economy today and a pressing question in the minds of many investors. Despite progress made in fiscal consolidation in recent years, public indebtedness levels today are above 100% of GDP. In the case of Spain, it is not easy to clearly establish a particular threshold level in the relationship between debt and growth. However, looking at the dynamics and evolution of these two variables during two historical periods (1851-2000 and 1965-2013), some interesting findings emerge. Looking at both periods in their entirety, an increase of 10% in the public debt to GDP ratio has been associated with a reduction in GDP growth between 0.17%-0.38%. However, during the second sub-period of 1851-2000, an increase in the debt ratio of 10% has been associated with a drop in growth of 0.7%. These findings are particularly important to bear in mind for fiscal policy makers when assessing public debt sustainability and when pursuing the objective of achieving the 60% of GDP target adopted in the Stability and Growth Pact.
The financial crisis that began in the United States in the summer of 2007 rapidly spread throughout international financial markets to reach the EU. The euro area went into recession in 2008 and, somewhat overtaken by events, the European Commission established a Keynesian European Economic Recovery Plan (EERP) in December of that year with the aim of coordinating the national plans already under way.
Given that the short-term challenge for the European economy was to maintain the liquidity and solvency of the financial system to stave off economic collapse and that there was a strong international consensus on the need for expansionary economic policies (at the level of the G20, as well as that of the EU), the role of monetary policy became that of cutting interest rates to the minimum and injecting massive amounts of money to avoid a socially unacceptable economic contraction. Fiscal policies initially sought to stabilise financial markets (by means of injections of public capital, asset purchases and guarantee operations), and then aimed to allow flexible use of automatic stabilisers, before finally applying discretionary expansionary measures. The inevitable result was an increase in the deficit and public debt due to shrinking tax revenues (very closely linked, in countries such as Spain, to the property market and rising financial asset values) and higher spending. This fact was particularly critical in certain countries with substantial foreign debt, such as Greece, Ireland, Portugal and Spain. The Greek crisis demonstrated the capacity for market contagion through agents’ shifting expectations resulting from the debt accumulation dynamic in the absence of concrete reform and adjustment plans either nationally or collectively promoted, in this latter case by the EU. Although the fiscal policy measures referred to may have helped soften the economic cycle, the discretionary fiscal measures and bank bail-outs played a large part in the rapid rise in the public-debt-to-GDP ratio in many countries. In this connection, Reinhart and Rogoff (2010) have highlighted the negative effects on growth that high debt levels can have.
From the economic policy standpoint, an analysis of this relationship is a crucial factor at the centre of the debate over Europe’s current fiscal consolidation strategy. There is a broad consensus that most European countries need to undertake significant fiscal consolidation to improve their fiscal position and thereby stabilise and reduce levels of debt, given the risks to their budgetary sustainability (IMF, 2013). However, there is less consensus over the pace of this consolidation process. Two main factors need to be taken into account when setting out an optimal path for fiscal consolidation. The first is the economy’s expected growth rate and the short-term fiscal multiplier, and the second is the sustainability gap, or the size of the medium-term fiscal adjustment needed. As regards the former, there is a certain amount of agreement that the fiscal multiplier depends on the fiscal variable, the country and the period considered. Ceteris paribus, multipliers tend to be higher in a context of a sluggish economy, lack of monetary support, and credit restrictions. In principle, the existence of non-linearities in terms of economic growth as a result of fiscal adjustments would imply extending the period for consolidation and deleveraging to avoid premature exit strategies, of which Japan at the end of the 90s is widely considered to be an example. However, although fiscal consolidation may have negative short-term impacts, the cost of not consolidating can be greater still, given the rising expectations of a default or liquidity crisis (Corsetti, 2012). As regards the second factor, the sustainability gap, simply a matter of arithmetic and current calculations, it seems to be at unusually high levels relative to historical data (European Commission, 2012).
Determining a credible and politically feasible path of fiscal adjustment means a delicate balance of forces needs to be achieved, depending on each country’s specific characteristics. It is therefore worth determining the nature of the relationship between the level of debt and growth over the long term in each case. Given the state of the Spanish economy, this study may be particularly timely, as there are fears that high levels of debt could harm economic growth, prolonging the time taken to recover from the crisis and leading to economic stagnation. What is more, an important implication of a fiscal austerity policy is that it can raise the debt ratio over the short term, as the fiscal gains may be partially outweighed by the drop in output. Even if this effect is only short term and debt levels gradually come down, it can nevertheless have a negative impact if financial markets focus on the short-term effect on the debt ratio or if economic policy-makers insist on fiscal tightening to achieve official targets for the debt ratio.
In Spain’s case, the way the economy has evolved has been a clear example of rising debt causing a turnaround in market expectations regarding the country, triggering a liquidity crisis that could easily have turned into a solvency crisis. The strategy pursued since then has led to a reduction in the deficit. This reduction has been considerable but remains insufficient to reverse the rate of debt accumulation, which has now reached one of its highest levels ever in Spain. It is therefore worth analysing how the level of debt has affected Spain’s growth in the past.
The foregoing describes the backdrop against which the topic addressed in this article is set. The first section therefore analyses the trend in Spain’s public debt. The following section completes the analysis with an estimate of the long-term relationship between Spain’s public debt and real economic growth using databases covering the periods 1851-2000 and 1965-2013. The final section offers some concluding remarks.
Evolution of public debt in Spain: State of play and outlook
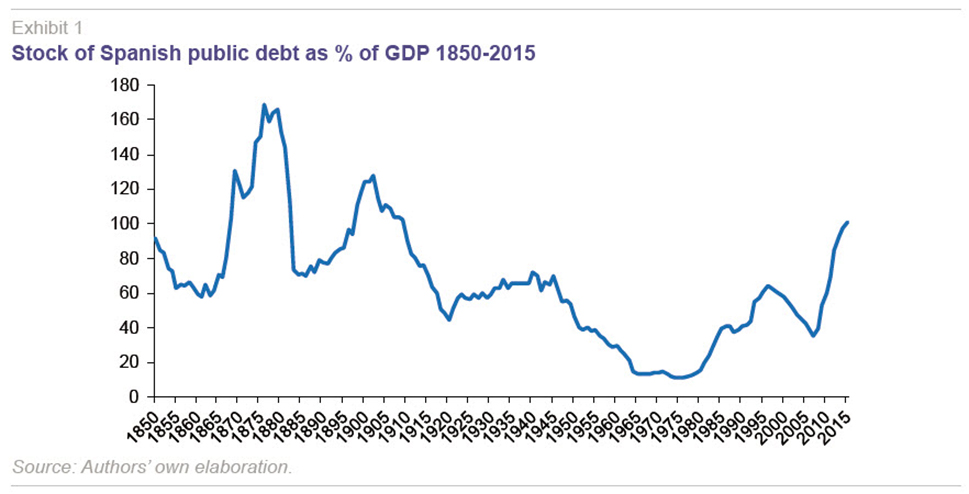
The government has expressed its satisfaction with the fiscal adjustment, while at the end of 2015 public debt totaled 1,081,190 million euros (99.2% of GDP), more than 63 percentage points of GDP higher than its level in 2007 (35.5% of GDP). The EU’s latest projections forecast the public debt stock stabilising in the next two years as a percentage of GDP (2016: 100.3%; 2017: 99.6%), but 40 points from the Stability and Growth Pact target (60% of GDP).
[1]
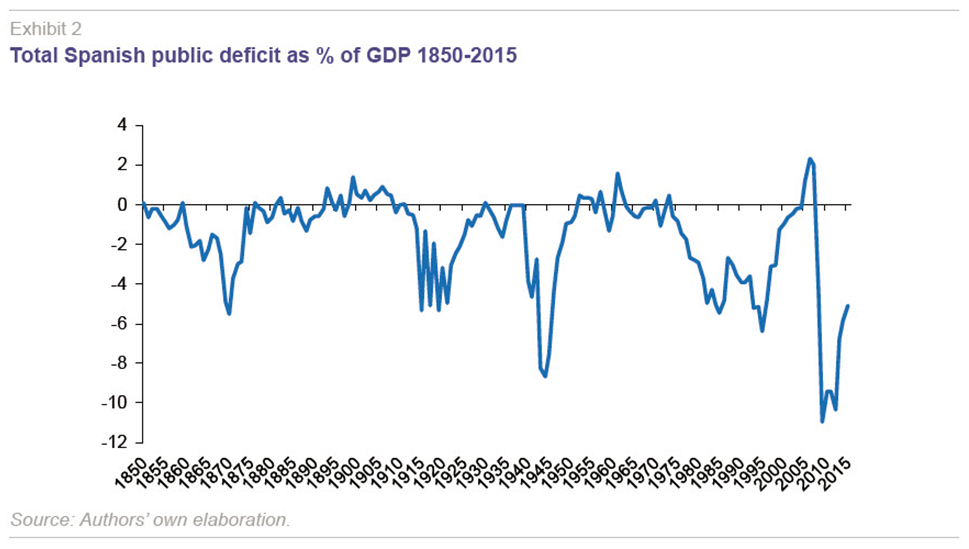
The total public deficit at the end of 2015 also remained high, at 55,136 million euros (5.1%), although the imbalance has been reduced by more than 6 percentage points since its peak in 2009 (11% of GDP). The public deficit registered in 2015 overshot both the EU’s autumn projections (4.7% of GDP, November 2015) and those of the Spanish government’s Stability Plan for 2015-2018 (4.2%, April 2015).
Such a large stock of public debt implies serious difficulties for fiscal policy. First of all, it makes it necessary to refinance large sums in national and international capital markets, exacerbating the Spanish economy’s vulnerability, as became evident during the euro area sovereign-debt crisis from 2010 onwards. To be more precise, each year, the Spanish general government has to borrow over 20% of GDP, making it highly dependent on capital markets.
Secondly, such a large volume of public debt means, despite the current low interest rates (underpinned by ECB monetary policy), substantial interest payments on the accumulated stock of public debt (35,676 million euros or 3.3% of GDP in 2015).
Thirdly, to compensate for these interest payments and balance the budget overall, while reducing or at least stabilising the stock of public deficit, the general government needs to produce a significant primary surplus (before debt servicing). However, this means raising taxes or cutting productive public spending, particularly public investment, which may have a strongly negative effect on economic growth and, ultimately, on employment.
Lastly, in the framework of Economic and Monetary Union (EMU), these high levels of public debt may significantly reduce the counter-cyclical effect of fiscal policy, as monetary policy is in the hands of the ECB and there is no option of devaluing the national currency.
It will be difficult to sustain public finances unless fiscal consolidation is pursued further, but this problem is not new. The Spanish economy has undergone recurrent episodes in which it has proven difficult to sustain budgetary equilibrium and the debt stock without extraordinary measures. The list of episodes includes: Philip II: 1557, 1560, 1575, 1597; Philip III: 1607; Philip IV: 1627, 1647, 1652, 1662; Charles II: 1666; Charles IV: 1798; Cádiz Cortes: 1812-1813; Ferdinand VI: 1814, 1817, 1823, 1825, 1828; Isabella II: 1835, 1841, 1844, 1851, 1867; Sexenio Democrático and 1st Republic: 1871; Alfonso XII: 1876, 1881; Alfonso XIII: 1900, 1915-1919, 1927-1928; 2nd Republic: 1935, 1939.
Exhibit 1 shows the trend over time in the stock of public debt relative to GDP (%) from 1850 to 2015. The current state of the public debt dynamics reveals an increase in line with other periods of historically high debt levels: 1
st Cuban War 1868-1878 during the reign of Alfonso XII and the Cuban Crisis of 1898 during the regency at the start of the reign of his son Alfonso XIII.
The current state of the public deficit in relation to GDP is no less important historically: as Exhibit 2 shows, it has not been at the present level since 1950. And these recent figures for the public deficit do not include
[2] the multitude of specific debt issues to cover the financing needs of various “special funds” the Spanish treasury has had to cover (the so-called “deficit-debt adjustment effect” which will be discussed below).
In order to assess the public debt stock over time in Spain as a percentage of GDP, we will use the following breakdown of the debt ratio dynamic into three components:

where bt represents the debt stock (as % of GDP), dt is the primary public surplus or deficit (as % of GDP, excluding interest on the debt), it implicit nominal interest rates on public debt, gt the nominal growth rate of the economy (real growth rate + inflation rate) and ddat is the “deficit-debt adjustment” component.
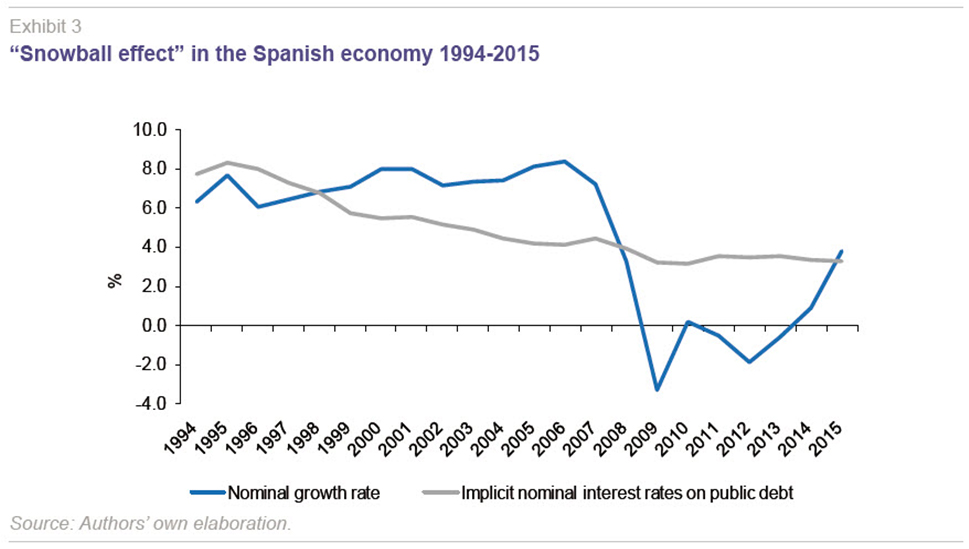
The above expression implies that in order to stabilise the public debt stock relative to GDP, three non-exclusive conditions have to be met: (1) nominal growth of the economy (note that deflation increases the debt) must be greater than the implicit nominal interest rate on the public debt (debt interest component or “snowball effect”); (2) a public primary surplus needs to be generated (“fiscal adjustment” component); and, (3) the “deficit-debt adjustment” has to be reduced or eliminated (ddat = 0).
The first component of the public debt dynamic is the so-called “snowball effect”. Exhibit 3 shows how this component progressed between 1994 and 2015. The implicit nominal interest rate on the debt has been obtained from the debt-service ratio and the public debt stock. The snowball effect, which increases the stock of public debt (the interest rate on the debt exceeds nominal economic growth), appeared in 2008 at the start of the international financial crisis. It has been decreasing since 2012 and at the end of 2015 the gap had closed, such that if it remains at current levels from 2016 on, it will not have an effect on the public debt stock. It is therefore essential that the economy grow at faster nominal rates in order to turn the effect negative and put downward pressure on the volume of debt, either with growth outpacing real interest rates or through deflation, or both.
The second component in the public debt dynamic is the primary government deficit or surplus. Between 1964 and 2015, this progressed as shown in Exhibit 4. The primary surpluses during the property boom (1996-2007) turned into a primary deficit in 2008, reaching a maximum of -9.3% of GDP at the end of 2009. Moreover, despite the fiscal adjustments made, it has still not been possible to achieve a fiscal surplus, such that at the end of 2015 there was still a deficit of 1.6% of GDP. The European Union’s latest forecasts suggest a small primary deficit of 0.6% of GDP in 2016 and a small primary surplus in 2017 (+0.2% of GDP).

The third component of the public debt dynamic is the so-called “deficit-debt adjustment” effect. This component includes all public debt issues that are not classed as public deficit (they do not arise out of the difference between government revenues and expenditure) but are classed as public debt. They arise out of the State’s need to borrow in order to pay for financial assets not directly related to the public budget. These items include (but are not limited to):
[3]
- EFSF (European Financial Stability Facility), loans for the bail-out of Ireland, Greece and Portugal.
- Fund to support the Hellenic Republic (bilateral).
- Participation in ESM (European Stability Mechanism), which replaces the EFSF for future bail-outs.
- FROB (Fund for Orderly Restructuring of the Banking Sector).
- FAAF (Financial Assets Acquisition Fund).
- Supplier payment finance fund (FFPP).
- FADE (Electricity-system deficit amortisation fund).
- Possible bail-out of the toll motorways going into receivership in 2016 (2400-5000 million euros).
- Possible third bail-out for Greece in 2016 (disbursements this year of the total of Spain’s 10.5 billion euro share).
It should be borne in mind that net acquisitions of financial assets to finance the funds listed above led to an increase in public debt between 2008 -2015 (unrelated to the public deficit funding needs) of 33,270 million euros (3% of GDP), equal to 50% of the public deficit adjustment made between 2009-2015 (5.9 percentage points of GDP).
Lastly, the public debt statistics leave out the general government’s “contingent debt,” which comprises guarantees on debt contracted by other institutional sectors. These guarantees are not registered as liabilities on the general government accounts, given that the guaranteed debt is registered as a liability for the agent receiving it.
Nevertheless, these guarantees are contingent liabilities for the public finances, such that if the guarantee were to be executed in whole or in part, the general government would assume the whole debt. The balancing item would be a capital transfer paid to the original debtor, therefore, representing an increase in the general government deficit and debt.
In late 2015, the volume of contingent liabilities was slightly over 10 percentage points of GDP (107,913 million euros), as a result of the various guarantees granted to the banking system (guarantees for medium-term issues of bank debt, 2008-2009), to the European Financial Stability Facility (EFSF), the management company for the assets deriving from bank restructuring (SAREB) in the framework of the process of banking restructuring, the Electricity System Deficit Securitisation Fund, and issues of SME Financing Securitisation Funds, etc.
Taking all of these factors into consideration, the levels of sovereign debt, not only in Spain, but across the euro area, clearly imply a future flow of public primary surpluses that may slow the possible recovery of the most heavily indebted economies, risking driving them into a process of “secular stagnation” from which it will be difficult to escape. To understand the mechanisms making this scenario possible, it is worth taking a closer look at the economic consequences of high debt levels.
The economic consequences of over indebtedness: Empirical evidence for the Spanish economy over the period 1851-2013
In this section we present the results of our analysis of the Spanish economy over an exceptionally long period of time: 1851 to 2013. Unlike other studies, which use panel data and short time intervals, our approach has been to look at just one country’s time series data using advanced cointegration techniques that allow us to detect possible breakpoints, and the existence of parametric instability without imposing any functional form a priori. We also estimate elasticities for the various different regimes found.
[4]
In this study, we used time-series data on the Spanish economy for two periods: 1851-2000 and 1964-2013. The data sources for the first period are Comín and Díaz (2005) and Carreras, Prados de la Escosura and Rosés (2005) and that for the second period the Bank of Spain (2014).
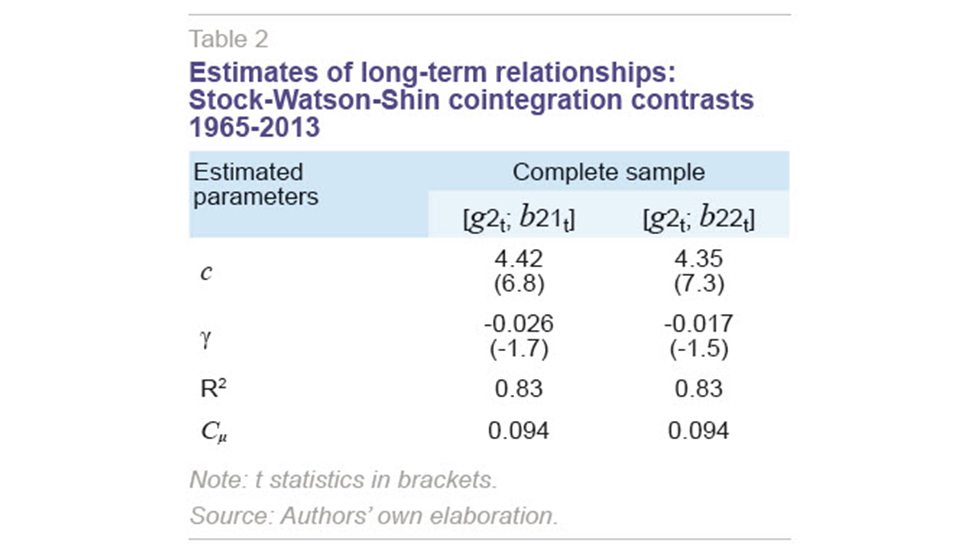
The results of the estimation are shown in Tables 1 and 2 for the full sample period, 1851-2000 and 1965-2013, respectively. The results imply that the null hypothesis for the deterministic cointegration between
gt and
bt cannot be rejected in the three cases put forward, with a 1% significance level, where
gt is the real GDP growth rate and
bt represents the debt stock as a percentage of GDP. Moreover, the estimated value of the long-term elasticity,
γ, is always negative and significantly non-zero. This estimation provides empirical evidence that public debt has a negative effect on real growth of the Spanish economy. For example, over the period 2007-2013, the stock of public debt measured as total liabilities relative to GDP,
b21t, grew by 84 percentage points, which, according to our estimates would be associated with a cumulative drop in the rate of real growth of 2.18 percentage points.
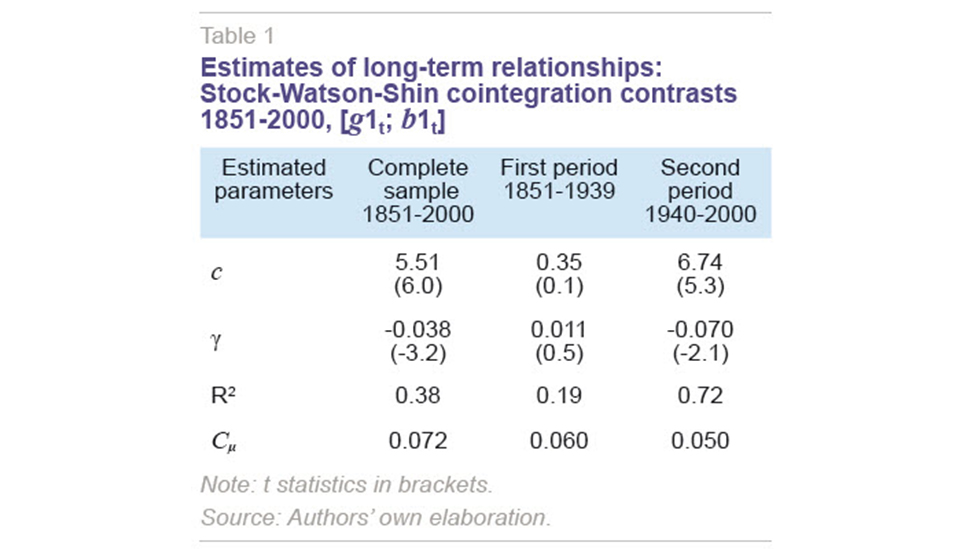
In order to see how the elasticity has developed over the long term, Table 1 again estimates this parameter in the two sub-periods of the 1851-2000 sample.
[5] The results show that in neither case can the null hypothesis of deterministic cointegration between
gt and
bt be rejected with a 1% significance level. Moreover, the coefficient in the first regime (1851-1939) is positive, but very low and of limited significance. By contrast, in the second regime (1940-2000) the long-term coefficient is negative and significant. From the economic point of view it implies that an increase of 10 percentage points in the stock of debt relative to GDP would cause a drop of 0.70 percentage points in the real economic growth rate. This value is more than twice that estimated for the full 1851-2000 sample (0.38 percentage points).
Thirdly, we analysed the possible existence of a non-linear relationship between public indebtedness and real economic growth using the methodology proposed by Hansen and Seo (2002).
[6] The cointegration contrasts allow linearity to be rejected in favour of a non-linear regime with two periods. These findings are consistent with the existence of non-linear behaviour in Spanish fiscal policy, such that fiscal policy-makers only reduce the deficit (and cumulative debt) when so high as to bring the long-term sustainability of public finances into question. However, it is not easy to clearly establish a particular threshold level in the relationship between debt and growth.
Concluding remarks
Despite the progress made on the process of fiscal consolidation, as of late 2015, public indebtedness had not yet begun to drop. The priority of fiscal policy must remain, firstly, through stabilisation, and then, a gradual reduction in the ratio of the stock of public debt to GDP, to bring it down to levels closer to the 60% target. This means the fiscal consolidation process will need to continue over the coming years.
First of all, we analysed how Spain’s public debt changed over time and the variables that will be key to determining debt sustainability in the future.
Secondly, we have presented the main findings of our study analysing the long-term relationship between public indebtedness and real growth in the case of the Spanish economy, based on data from the periods 1851-2000 and 1965-2013.
The findings make it possible to establish a relationship of linear cointegration between the public debt to GDP ratio and real GDP growth with a vector (1, -0.038) for the whole sample period analysed (1851-2000). For the more recent period (1965-2013) we have used two different definitions of gross public debt, depending on whether the Excessive Deficit Procedure or total general government liabilities methodology is considered. In the first case, the vector is (1, -0.026), while in the second it is (1, -0.017). These results imply that an increase of 10% in the public debt to GDP ratio would be associated with a reduction in GDP growth of between 0.17% and 0.38%. The level of public debt therefore has a significant effect on GDP growth. For example, public debt in the period 2007-2013 rose by 84%, such that, according to our estimates, this increase could be associated with up to 2.18 percentage points less long-term GDP growth.
Moreover, our results suggest that cointegration relationships have changed over this period. The long-term elasticity estimate in the model incorporating a structural change shows a downward trend over the long term, indicating the presence of a fiscal “fatigue” or “saturation” process (from a non-significant 0.011 to -0.07). This would indicate that in the second sub-period, there has been an increase in the debt ratio of 10% associated with a drop in growth of 0.7 percentage points. This value is twice that estimated for the period as a whole (-0.038). Indeed, for the first sub-period, we find the existence of a “decoupling” (where the debt does not affect growth significantly but does have a positive coefficient) or “saturation” (where the elasticity of growth relative to debt drops over time, less than proportionally, but with a positive coefficient), while in the second sub-period the long-term elasticity again becomes negative and significant.
Finally, the cointegration comparisons instead support the hypothesis of a non-linear regime with two periods for the more up-to-date sample range. These findings are consistent with the existence of non-linear behaviour in Spanish fiscal policy, such that fiscal policy-makers only reduce the deficit (and cumulative debt) when it becomes so high as to jeopardise the long-term sustainability of the public finances. However, it is not easy to clearly establish a particular threshold level in the relationship between debt and growth.
Notes
This article is based upon the projections of the European Commission (2016a, 2016b and 2016c).
These are included in the case of public debt stock figures.
But not the FLA (Regional Liquidity Fund) covering debt maturities or to meet the autonomous regions’ authorised borrowing requirements in the year. (This does not increase the consolidated general government debt.)
For more details of the technical aspects of the econometric estimation, see Esteve and Tamarit (2016).
The data in the sample for the period 1965-2013 are insufficient to perform the DOLS estimate in the first regime (1965-1971).
The results can be consulted in Esteve and Tamarit (2016).
References
BANK OF SPAIN (2014), Cuentas Financieras de la Economía Española 1980-2013, Bank of Spain, Madrid.
CARRERAS, A.; PRADOS DE LA ESCOSURA, L., and J. ROSÉS (2005), Chapter 17 in CARRERAS, A., and X. TAFUNELL (eds.), Estadísticas Históricas de España: Siglos XIX y XX, Fundación BBVA, Bilbao, second edition.
COMÍN F., and D. DÍAZ (2005), Chapter 12 in CARRERAS, A., and X. TAFUNELL (eds), Estadísticas Históricas de España: Siglos XIX y XX, Fundación BBVA, Bilbao, second edition.
CORSETTI, G. (2012), “Has austerity gone too far?,” VoxEU, 2 April.
ESTEVE, V., and C. TAMARIT (2016), “Public debt and economic growth in Spain, 1851-2013,” Working Paper, No. 779/2016. Funcas.
EUROPEAN COMMISSION (2012), “Fiscal sustainability report 2012,” European Economy, No.8, December.
— (2016a), Cyclical Adjustment of Budget Balances, Spring.
— (2016b), General Government Data, Spring
— (2016c), Statistical Annex of European Economy, Spring.
HANSEN, B. E., and B. SEO (2002), “Testing for two-regime threshold cointegration in vector error-correction modelsm,” Journal of Econometrics, 110: 293-318.
IMF (2013), Global Prospects and Policy Challenges, Note for the Group of Twenty, February.
REINHART, C. M., and K. S. ROGOFF (2010), “Growth in a time of debt,” American Economic Review, 100(2): 573-78.
SHIN, Y. (1994), “A Residual-Based Test of the Null of Cointegration Against the Alternative of No Cointegration,” Econometric Theory, 10(1): 91-115.
STOCK, J. H., and M. W. WATSON (1993), “A Simple Estimator of Cointegrating Vectors in Higher Order Integrated Systems,” Econometrica, 61(4): 783-820.
Vicente Esteve. Joint Research Unit on Economic Integration (Inteco), University of Valencia and IAES, University of Alcalá
Cecilio Tamarit. Joint Research Unit on Economic Integration (Inteco), University of Valencia