Recent trend in leverage across Spain´s institutional sectors
Spanish households and firms have made a considerable deleveraging effort since the beginning of the crisis. Conversely, growing public debt levels have kept overall leverage ratios high, and remain the weakest link in the country´s deleveraging process.
Abstract: The credit boom in Spain in the run-up to the crisis translated into private borrowing rates which amply exceeded those of Spain’s main economic peers. These levels have fallen considerably in recent years, very significantly in the case of the corporate sector. Spanish household leverage has fallen from 135% of their gross disposable income (GDI) in Q2008 to 106% at year-end 2015, although still above the Eurozone average. Corporate deleveraging has come down over the past three and a half years by 28% of GDP and currently stands below Eurozone levels. However, the growth in government borrowing, which closed 2015 at 99.2%, means that the leverage ratio presented by the resident sectors as a whole continues to constitute a source of vulnerability for the Spanish economy.
The net lending or borrowing position, the net international investment position and external borrowing
The Spanish economy’s net lending position amounted to 22.7 billion euros in 2015. This was an exceptional performance relative to the historical series and was shaped by the trend in oil prices, strong service sector readings and a reduction in the investment income deficit compared to prior years.
The improvement in the net lending position in 2015 (2% of GDP vs. 1.4% in 2014) was driven mainly by the reduction in the energy bill, from 3.8% of GDP in 2014 to 2.5% last year. This mitigated the adverse impact of the growth in imports (a sign of renewed domestic demand strength) and the slight deterioration in the services trade surplus.
The improvement in Spain’s net lending position coupled with nominal GDP growth has driven a 5.3 point improvement in its net international investment position (NIIP) to -90.5% of GDP. Although this level remains high in the European context and is significantly conditioned by valuation effects, it is showing signs of gradual improvement.
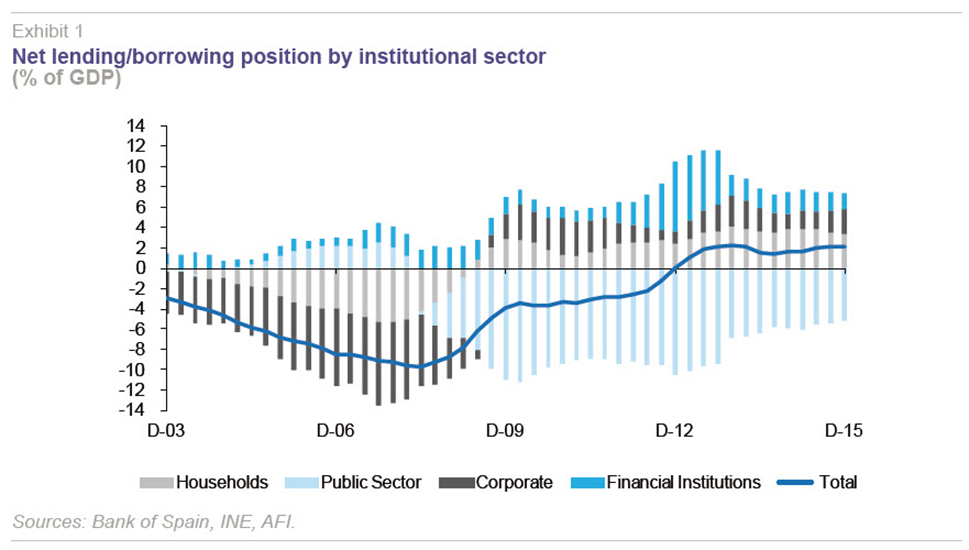
The breakdown of the NIIP by institutional sector shows the deterioration in the public administrations’ debtor position, which increased by 2.8 points to 46.4% of GDP, whereas the debtor position of Spain’s households and non-financial corporates declined. The public administration alone accounts for nearly half of the economy’s total NIIP debtor position. Stripping out the Bank of Spain (whose debtor position relative to the Eurosystem increased in 2015), the Spanish economy’s NIIP would stand at -79.9% of GDP.
Unlike the NIIP, which reflects the difference between the residential sectors’ external assets less their liabilities with the rest of the world, gross external debt only accounts for claims by non-residents “which imply the realisation in the future of principal or interest payments, or both (all financial instruments except equity interests and financial derivatives)” (Bank of Spain, 2016). The Spanish economy’s external debt is currently equivalent to 167.9% of its GDP, which is higher than the German equivalent but lower than the French ratio. Excluding the Bank of Spain’s liabilities (which are not subject to refinancing risk), external debt stands at 140.1% of GDP, a ratio which ranks it along the middle within the European context (Bank of Spain, 2016).
Borrowing, the institutional sectors as a whole
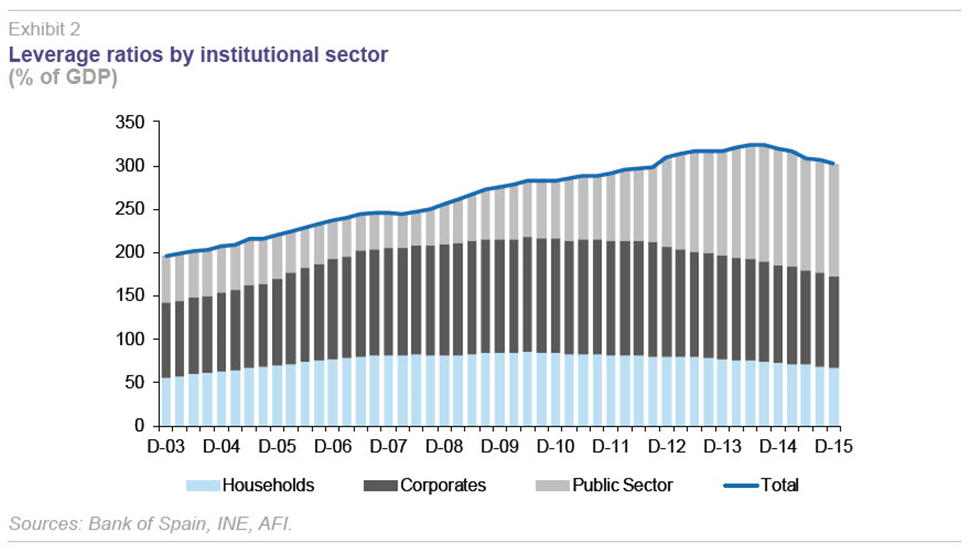
Overall borrowing by the Spanish economy’s non-financial institutional sectors peaked at 323% of GDP in the third quarter of 2014, some 80 points above the level registered at the onset of the economic crisis. Between 2008 and 2012, private borrowing barely budged, coming down only very slightly, whereas public borrowing embarked on a considerable upward trend, which continues today.
The role played by automatic stabilisers has been crucial in the transfer of debt between the sectors. In this respect, two factors stand out: the drop in tax revenue (from 40.9% of GDP in 2007 to 34.8% in 2009, since which time it has been gradually recovering, reaching 38.2% in 2015) and the increase in jobless claims, which doubled between 2007 and 2010.
These two factors were compounded by explosive growth in public debt service costs (from 17 billion euros in current 2008 euros to 35 billion euros in 2015) and the rise in pension costs (from around 98 billion euros in 2008 to some 132 billion euros in 2015), the latter driven by structural issues not directly related to the economic crisis.
In the past three years, particularly since the start of the economic recovery, the private sector has deleveraged significantly, to the extent that leverage across Spain’s non-financial corporates is now below the Eurozone average. Nevertheless, the leverage ratio of the non-financial resident sectors as a whole remains above 300% of GDP.
Household leverage
Spain’s households have deleveraged by around 30 points from the peak of Q2008 to 106% of their gross disposable income today. Although that is still 11.4 points above the Eurozone average, the gap between household leverage in Spain relative to the Eurozone average was over 40 points at one point. Against this backdrop, Spain’s households still have a long way to go in order to bring their leverage in line with that of their neighbours.
The household investment rate, however, is at an all-time low, suggesting that the deleveraging process has yet to run its course. Having gradually decreased in the first years of crisis, the investment rate would appear to have bottomed out at 4.3%, a level at which it has been stuck for the last two years and significantly below the levels observed during the pre-crisis years.
ECB monetary policy has been important in facilitating household deleveraging, considering the high percentage of floating-rate loans outstanding in Spain (according to the IMF, 98% of Spanish mortgages are floating-rate loans).
The drop in Euribor has driven a decline in the capital income paid by Spanish households, freeing up far more disposable income than would have been released by the deleveraging effort alone.
From the standpoint of the banking sector, this drop in capital income from households translates into a significant drop in interest income (from loans to households).
The decline in 12-month Euribor towards negative rates could release around 2.8 billion euros of extra income for households this year. However, from 2017, this phenomenon will cease to have any additional impact, reflecting the fact that the rates charged to borrow money in Spain are already extremely low (the second lowest among the European banks).
Non-financial corporate leverage
Whereas household deleveraging began when the credit bubble burst and has continued steadily since then, Spain’s non-financial corporates embarked on this process later, but with greater intensity.
This sector’s leverage ratio declined from a peak of 133% of GDP in Q212 to 104.8% by year-end 2015. In three and a half years, Spanish companies have deleveraged by an amount equivalent to 28 points of GDP to levels which are below those of their Eurozone counterparts on average.
Initially, corporate deleveraging was accompanied by sharp contraction in business volumes which in turn led to heavy job losses. Subsequently, the process gradually transformed into a virtuous circle in which debt has continued to come down, while investment has slowly picked up.

The corporate investment rate appears to have stabilised at around 90% of gross disposable income, a level which looks as if it might be the ‘new norm’ and is lower than the average registered during the boom years in the run-up to the crisis (above 150%, peaking at 203% in 2007).
Corporate deleveraging looks set to continue in the coming years, albeit perhaps with less intensity. There is no technical criterion for formally defining the optimal leverage ratio for non-financial corporates but economic theory points to levels slightly above those observed in the pre-crisis years when this ratio hovered around 80%.
Regardless, the numbers at hand point to a deleveraging effort by Spanish companies with benefits for their competitiveness and resilience vis-a-vis future shocks.
The ECB’s corporate bond buyback programme
Bonds account for a negligible percentage of the financial structure of Spain’s companies as a whole. And among SMEs, they are virtually non-existent. In companies with annual revenue of over 50 million euros, bonds account for just 6% of total borrowing. Logically, this percentage rises significantly – to 40% – in the case of the IBEX-35 stocks (excluding the banks).
The non-financial corporates included in Spain’s benchmark blue chip stock index owe around 150 billion euros of bank debt. Most of this is in the form of syndicated loans, a product to which foreign banks are significantly exposed. Assuming that 50% of this figure is held by Spanish financial institutions, this would be equivalent to close to 14% of all credit extended to non-financial resident corporates (540 billion euros) and represents the maximum amount of outstanding debt which could be replaced by bonds in the case of IBEX-35 corporates (a hypothetical maximum which would never be reached as bank financing will continue to play a meaningful role). Elsewhere, any such substitution process will necessarily be gradual, limiting its impact.
The above threshold needs to be grossed up by the loans extended by Spanish banks to other large-cap Spanish companies (those traded on Madrid´s general index, the IGBM in its Spanish initials), which could also replace bank financing with bonds. A good number of IGBM-listed corporates would also be able to tap the bond markets, making these companies candidates for participating in this source of financing substitution process.
Public sector leverage
The public deficit – at all levels of government – amounted to 5.0% of GDP in 2015 (without including financial aid), 0.8 points above the target of 4.2% established in the Excessive Debt Procedure (EDP). In other words, of the anticipated 1.6 point fiscal consolidation effort (the deficit registered in 2014 was 5.8%) only 0.8 points was achieved.
By sub-sector, the culprits were the regional governments (which presented a deficit of 1.66% of GDP vs. a targeted 0.7%) and Social Security, which registered a higher deficit than in 2014 (1.26% of GDP in 2015 vs. 1.04% in 2014) (Maastricht criteria).
In contrast, the state government outperformed its target by 0.2 points (deficit of 2.7% vs. targeted 2.9%) and the local entities continued to present a surplus, albeit narrower than in prior years (0.44% of GDP), only partially mitigating the slippage at the regional government and Social Security levels.
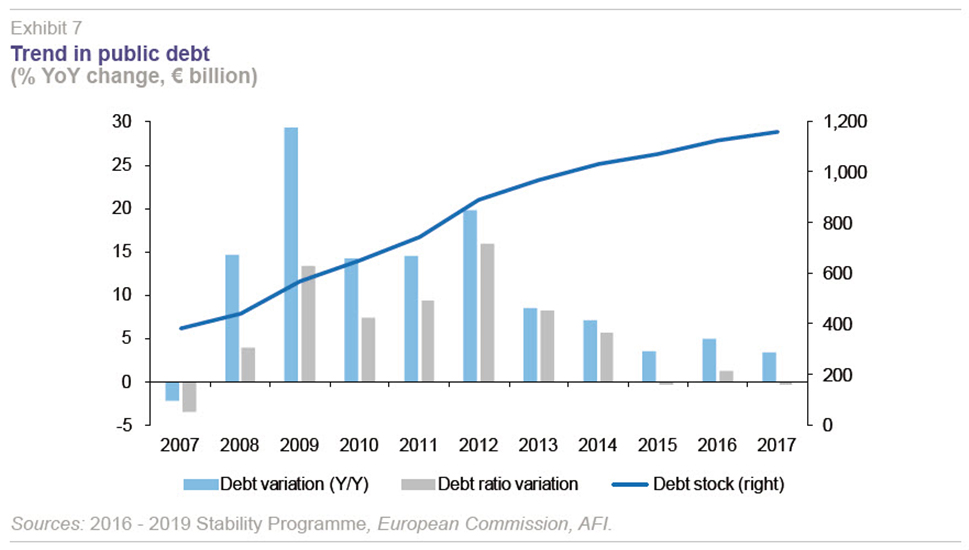
The stock of debt meanwhile climbed 3.5% higher year-on-year in 2015, albeit slowing from the growth registered in 2014 and 2013 of 7.0% and 8.5%, respectively. This trend in debt did not translate into a higher leverage ratio thanks to faster growth in nominal GDP (3.8%). In fact, for the first time since the start of the crisis, the public leverage ratio improved ever so slightly: 99.2% in 2015
vs. 99.3% in 2014.
However, there was another factor causing the debt-to-GDP ratio to stabilise rather than rise above 100%, as forecast, in spite of such a high deficit (5% of GDP). Although the state registered a deficit of 28.2 billion euros, its net debt only increased by 8 billion euros. This phenomenon is mainly attributable to the difference in the prices at which government debt was issued and redeemed in 2015.
The drop in the public leverage ratio is not therefore attributable to an improvement in the primary deficit, which amounted to 2% of GDP in 2015, but rather to nominal growth and the impact of valuation effects.
Consensus forecasts point to continued growth in the Spanish stock of debt in 2016 and possibly 2017, pushing the leverage ratio above 100% of GDP. Conventional public debt sustainability analysis suggests that Spain would have to register a primary surplus of around 1.5% of GDP and nominal annual growth of at least 3% to bring the leverage ratio to 60% within a 20-year time horizon (Maastricht criteria).
Towards a new public deficit roadmap
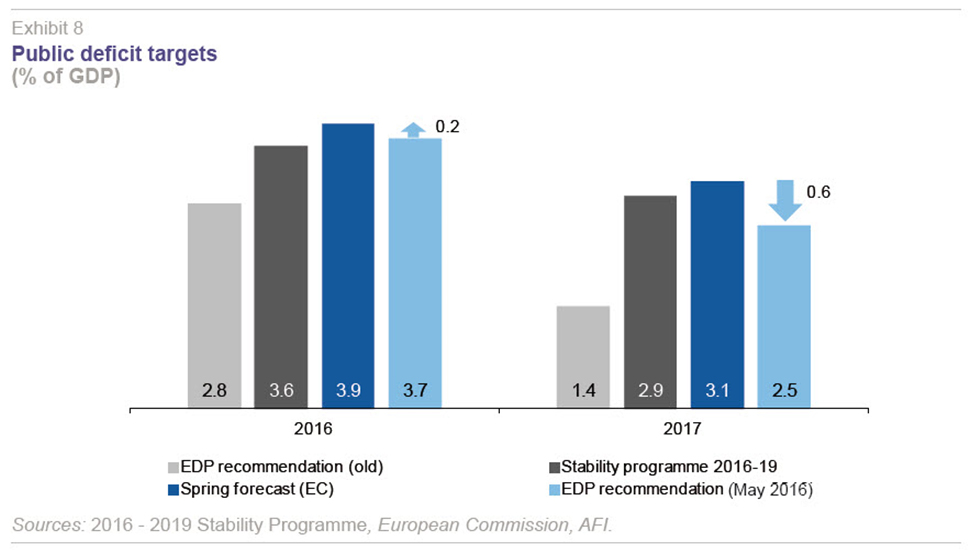
In terms of the new public deficit targets, insofar as the 2015 slippage makes it impossible to slash the deficit to 2.8% in 2016 or 1.4% in 2017, as initially forecast, the 2016 - 2019 Stability Programme is targeting a deficit of 3.6% in 2016 and 2.9% in 2017 (Spanish Government, 2016). This means pushing back the 3% target, necessary for abandoning the corrective arm of the Excessive Deficit Procedure, by one year.
The Stability Programme also calls for a reduction in the primary deficit to 0.8% in 2016, and a further 0.6 percentage points correction in 2017. Spain is expected to present a primary surplus in 2018, a surplus projected to increase to 0.9% of GDP in 2019 (European Commission, 2016).
As for the targets for the various levels of government, the austerity requirement imposed on Social Security has been relaxed, although it will still have to reduce its deficit by 0.6ppt of GDP to 0.7% by 2019. The regional governments are required to balance their budgets by 2019, while the state is expected to register a deficit of 0.9% of GDP in 2019.
There have been no changes to fiscal policy on either the revenue or expenditure fronts. The target is still to keep the revenue-to-GDP ratio “slightly above 38%” and to drive “the ratio of expenditure-to-GDP down by over three points of GDP, from 43.2% of GDP in 2015 (excluding financial aid) to 40.1% in 2019.”
The European Commission, meanwhile, is estimating a public deficit in Spain of 3.9% in 2016 and 3.1% in 2017 so that without additional measures the deficit will not hit the 3% target until 2018. The Commission believes however that with additional tightening equivalent to 0.2ppt of GDP in 2016 and 0.6ppt in 2017, Spain could achieve a deficit of 3.8% this year and 2.5% next year.
This diagnosis coincides with the crux of the report released by AIReF (2016), Spain’s so-called independent fiscal responsibility authority, on May 10th. In a nutshell, the AIReF believes that a deficit of 3.6% is feasible in 2016 albeit conditional upon additional fiscal consolidation equivalent
to 0.4ppt of GDP.
Conclusions
The ECB’s monetary policy has been important in facilitating household deleveraging, considering the high percentage of floating-rate loans outstanding in Spain. The drop in Euribor has driven a decline in the capital income paid by Spanish households, freeing up far more disposable income than would have been released by the deleveraging effort alone. Despite the progress made, Spain’s households still have a long way to go in order to bring their leverage in line with that of their neighbours.
In three and a half years, Spanish companies have deleveraged by an amount equivalent to 28 points of GDP to levels which are below those of their Eurozone counterparts on average. Corporate deleveraging looks set to continue in the coming years, albeit perhaps with less intensity, presumably settling at levels that are slightly higher than those observed before the crisis, when this ratio hovered at around 80%.
As for the outlook for stabilisation in the public leverage ratio, consensus forecasts point to continued growth in the stock of debt in 2016 and possibly 2017, with the leverage ratio already de facto above 100% of GDP. Conventional public debt sustainability analysis suggests that Spain would have to achieve a primary surplus of around 1.5% of GDP (deficit of 2% in 2015) and nominal annual growth of at least 3% to bring the leverage ratio to 60% within a 20-year time horizon.
References
AIReF (2016), Reports on the Macroeconomic Projections and Draft Update of the Stability Programme of the Kingdom of Spain for 2016-2019, Independent Authority for Fiscal Responsibility (AIRef), May 15th.
BANK OF SPAIN (2016), “Balance of Payments and International Investment Position,” “Quarterly report on the Spanish economy,” Economic Bulletin, May, Bank of Spain.
EUROPEAN COMMISSION (2016), “Spring 2016 Economic Forecast: Staying the course amid high risks,” Institutional Paper 025, May.
SPANISH GOVERNMENT (2016), Update of the 2016 - 2019 Stability Programme, April.
Daniel Fuentes Castro. A.F.I. – Analistas Financieros Internacionales, S.A.