The impact of fiscal consolidation on regional healthcare expenditure during the crisis
The autonomous regions´ healthcare spending cuts are a step in the right direction and reflect the central government´s decision to implement much-needed deficit reduction measures. Unfortunately, more could also have been done to improve the overall efficiency of national healthcare services.
Abstract: In terms of the volume of expenditure, healthcare is the largest function assigned to Spain’s regional governments. Consequently, the process of fiscal consolidation on the spending side over the last few years has had a particularly strong impact on public healthcare benefits and services provided by the regions. Over the four-year period from 2010 to 2013, costs were cut by 12% from 2009 levels, when they had reached a record high. However, not all autonomous regions, services or expenditure items have been affected by cuts in the same way. This paper aims to analyse the cost reductions, main challenges, and differences in the activities, functions and services across the seventeen autonomous regions. Overall, slightly more than three quarters of the spending adjustment between 2009 and 2013 took place in the two-year period 2012-2013, and almost a quarter in the preceding two-year period. The areas in which expenditure was cut back most were outpatient drug spending, staff costs (through cuts in both wages and hospital staff numbers), and investments. However, many of the measures adopted during the crisis can be characterised as simple cutbacks rather than adjustments, and it is therefore possible that once their immediate fiscal impact has worn off, additional measures will be needed to improve the efficiency of healthcare services at the national level.
In the context of ongoing fiscal consolidation in the Spanish public sector, the autonomous regions have considerably reduced public expenditure. Given the structure of their competencies, this has had a powerful impact on the main areas of social policy. In aggregate terms, the autonomous regions’ total non-financial expenditure peaked in absolute terms at 193.5 billion euros in 2011, 18.0% of national GDP. This ratio rose by another tenth of a percent to 18.1% in 2012 as a result of the contraction in nominal GDP. However, to understand the intensity of the consolidation process on the expenditure side, we have discounted interest payments (which have also been affected by the new extraordinary financing mechanisms adopted by the government in 2012) and current transfers to the central government, which correspond to the settlements of the regional financing system, and so are more closely related to the revenue than expenditure side (i.e., they represent a reduction in revenue). This gives a more complete picture of how the autonomous regions have behaved with regard to the provision of public goods and services within the competencies conferred upon them.
As can be seen from Table 1, current transfers to the central government rose sharply in 2011 and 2012. The fact that advance payments had been much higher than final revenues meant the regional financing system’s settlement payments were larger than usual. In turn, interest payments are linked to the debt stock, fluctuations in interest rates, and the government’s bail-out mechanisms implemented in 2012 in response to the difficulty many autonomous regions had in tapping financial markets. Eliminating both items leaves “net primary spending”, which more precisely mirrors regional public expenditure adjustments.
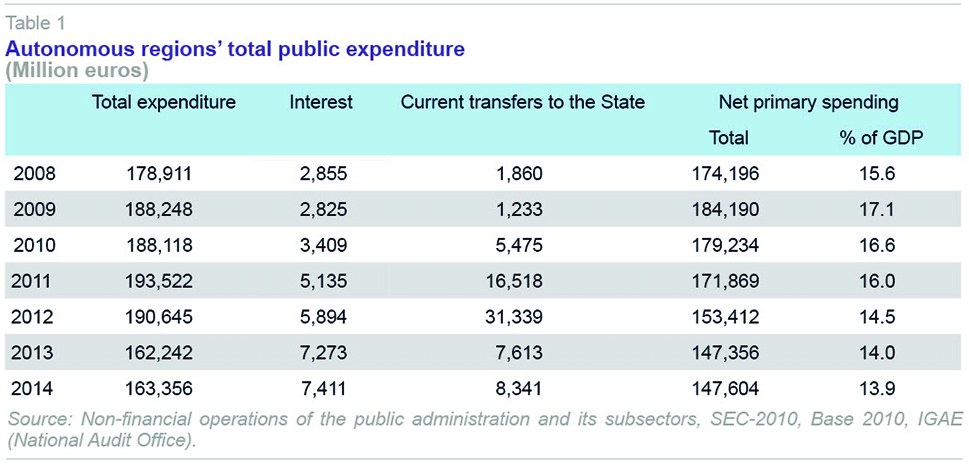
This shows that regional spending (excluding interest and current transfers to the State) peaked at 184.2 billion euros, or 17.1% of GDP, in 2009. The adjustment process has gone through two two-year periods, and its severity has differed in each.
[1] In 2010 and 2011, expenditure dropped by 12.3 billion euros, 6.7% of that in 2009, to 16.0% of GDP. Conversely, in the following two-year period, the reduction was practically doubled to 24.5 billion euros, 14.3% of spending relative to 2011, or 14.0% of GDP. The adjustment process seems to have been concluded in 2014, when spending stabilised at figures similar to those in the previous financial year. Overall, therefore, the reduction in autonomous regions’ spending between 2009 and 2013 came to 36.8 billion euros, a drop of 20% relative to spending in 2009.
Based on a functional classification of expenditure, the three items with the greatest weight in regional budgets are healthcare, education and economic affairs: overall representing three quarters of net primary spending. Consequently, the scope of the spending cuts between 2009 and 2013 was also concentrated in these three functions: a cut of 11.0 billion euros in economic affairs, mainly investments and capital transfers; 8.7 billion euros in healthcare; and 6.4 billion euros in education. As the regions are at the front line of the provision of essential services for the welfare state, the controversy over the spending adjustment process mainly surrounds healthcare, education and social protection.
Public healthcare spending cuts: Two stages
The culmination of the process of transferring healthcare services and functions from the central public sector (specifically, from the Social Security system) to the autonomous regions gave rise to the transfer of public healthcare spending to the regional government level, which accounted for 92% of the total in 2013. The provision of healthcare services in Spain is therefore basically a function of the intermediate level of government, namely the autonomous regions.
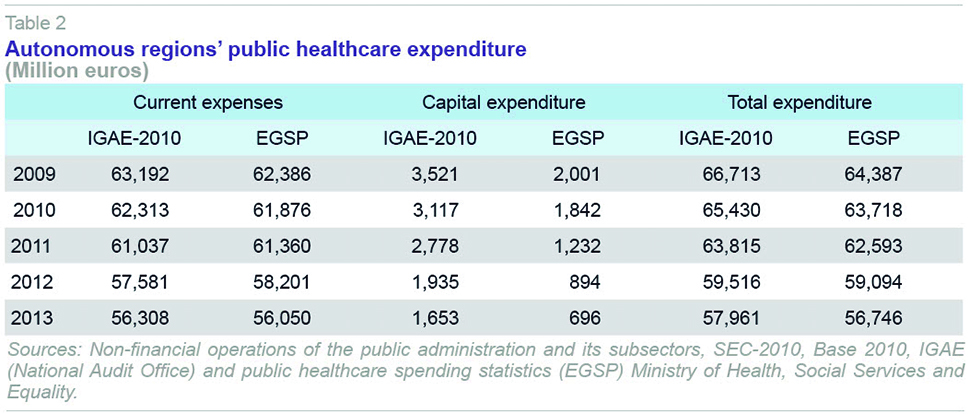
There are two main sources of information that can be used to examine regional governments’ healthcare spending: the reports prepared by the National Audit Office (IGAE) in national accounts terms, applying the valuation criteria of the European System of National and Regional Accounts (SEC-2010) and
Public Healthcare Spending Statistics (EGSP), based on the data in the satellite health accounts. Although the latter start out from a set of rules that are consistent with the national accounts framework (although in the period studied here the data are based on SEC-1995), as can be seen in Table 2, the figures from the two statistical sources are not entirely equivalent.
[2] The main differences are in gross fixed capital formation (GFCF) and, to a lesser extent, intermediate consumption. One of the changes introduced by SEC-2010 is precisely that it records government research and development (R&D) for its own use as GFCF, and in parallel reduces final consumption by the amount associated with R&D. In fact, as regards current expenditure, the differences between the two series are minimal. In what follows, the expenditure analysis will be based on the EGSP, as the satellite accounts allow a much more disaggregated valuation of the different expenditure items, and therefore give a more detailed interpretation of the scope of the adjustments made during the period under study.
[3]
Given that the aim of this article is to look at the components of the reduction in healthcare spending in the various different autonomous regions, we have worked exclusively with figures expressed in current prices. As we shall see, a major part of the decrease in spending is due to a reduction in the labour cost (i.e., wages) and intermediate consumption (pharmaceuticals and medical supplies). However, the aim here is not to make a valuation of real services provided, bearing in mind that price changes affect almost all the autonomous regions to the same extent.
Therefore, using the EGSP data from now on, we can also see how healthcare spending varied in the two sub-periods mentioned above for regional spending as a whole. In 2010 and 2011, the average annual drop in healthcare spending was just 1.4%, while in 2012 and 2013, the annual average drop was 4.8%.
The first spending adjustment measures were adopted in January 2010 when the government approved the update to the Stability and Growth Programme with a set of fiscal consolidation measures implemented through the 2010 Rapid Action Plan and the Central Government Austerity Plan, 2011-2013. Soon afterwards, in March 2010, the Fiscal and Financial Policy Council (CPFF in its Spanish initials) approved a Framework Agreement on the sustainability of public finances, 2010-2013, which was updated three months later. This agreement proposed a public deficit reduction commitment based on wage restraint, a strategy of limiting public-sector employment, and a policy of rationalisation of human resources. Additionally, in March, a drug spending rationalization plan was approved, aiming to save 1.5 billion euros by cutting manufacturers’ prices for generic drugs and simplifying the reference price system.
More far-reaching measures were adopted in May 2010, with the enactment of Royal Decree-Law 8/2014, which cut salaries by 5% throughout the public sector. To this end, since June 1st, 2010, annual compensation for all public-sector employees was reduced by this percentage relative to salaries on May 31st of that same year, except in the case of those earning less than 1.5 times the full-time minimum wage. The Royal Decree also envisaged drug spending reduction measures: a cut of 7.5% in the regulated price of pharmaceuticals, both those sold to the public and those purchased by hospitals or health centres; and other measures to rationalise consumption and centralised procurement of supplies.
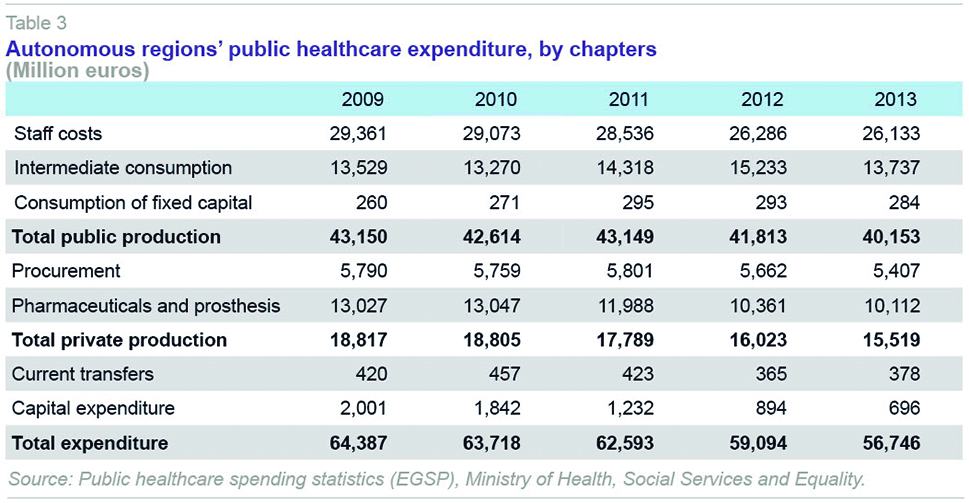
These measures were obviously reflected in autonomous regions’ spending as of mid-2010, although their ultimate effect was still limited. Indeed, in 2010 it would be more appropriate to talk of cost containment than reduction, probably because despite the stricter deficit targets, the advance payments made under the regional financing system compensated for the slump in tax revenues. In practice, in this first year, investment dropped sharply and the first cuts began to be made to staffing, intermediate consumption (hospital pharmacies, medical supplies) and administration. The moderate adjustment in staff costs continued in 2011. This was felt more in primary healthcare than in hospital services, but the increase in intermediate consumption in hospitals ended up leaving public healthcare production costs in virtually the same position as two years earlier: 43.1 billion euros in 2011, compared with 43.1 billion euros in 2009 (Table 3). Nor were arrangements with the private sector much affected in this first two-year period, with only spending on pharmaceutical services (-8.1%) and investment (-33.6%) affected, with overall spending in 2011 at 1.7% below its level a year earlier. Overall, therefore, in the two-year period from 2010 to 2011, although the path towards a certain degree of control over healthcare spending was begun, with cuts in staff costs, investments and drug spending, the increase in intermediate consumption in hospital services left total healthcare spending just 2.8 percentage points less than two years earlier.
Over the two years from 2012 to 2013, however, there was a much steeper drop in healthcare spending. The incoming government after the November 2011 elections rapidly took a series of measures to address the spending sustainability problems. Continuing the policy of staff cost containment, public employees’ salaries were frozen in 2012 and new public sector employment was halted, limiting the replacement rate in national healthcare system centres to 10% and setting strict restrictions on the hiring of temporary staff.
Royal Decree-Law 16/2012, April 20
th, 2012, amended the regulations on insurance coverage, excluding foreigners not authorised and registered as resident in Spain from publicly-funded healthcare, allowing only emergency and prenatal care. Similarly, the contribution criteria for beneficiaries of outpatient pharmaceutical provision (corresponding to drug prescriptions) were changed, including pensioners for the first time, and linking payments to income levels.
[4] Shortly afterwards, Royal Decree-Law 20/2012, July 13
th, 2012, eliminated the December extraordinary payment and public-sector employees’ entitlement to take days off, while extending the working week to 37.5 hours. And finally, the 2013 Budget Law again froze all staff compensation, even if it restored the December extraordinary payment.
The autonomous regions have taken various cost containment measures of their own that have had an uneven impact on health care professionals. These include freezing promotions or salary cuts, reducing allowances for staff while on call, or limits on the number of training days.
The comparative result of four years of adjustment, in terms of the economic classification of expenditure, can be summarised as follows: over the period 2010-2011 the cuts fell on staff costs (-2.8% over the two years), pharmaceutical costs (-8.0%) and capital expenditure (-38.4%); while in the period 2012-2013 the items most directly affected were the same, but the scale of the cuts much greater: 8.4% in staff costs, 15.6% in pharmaceuticals and prosthesis, and 43.51% in capital expenditure.
Differences between autonomous regions and distinctive features
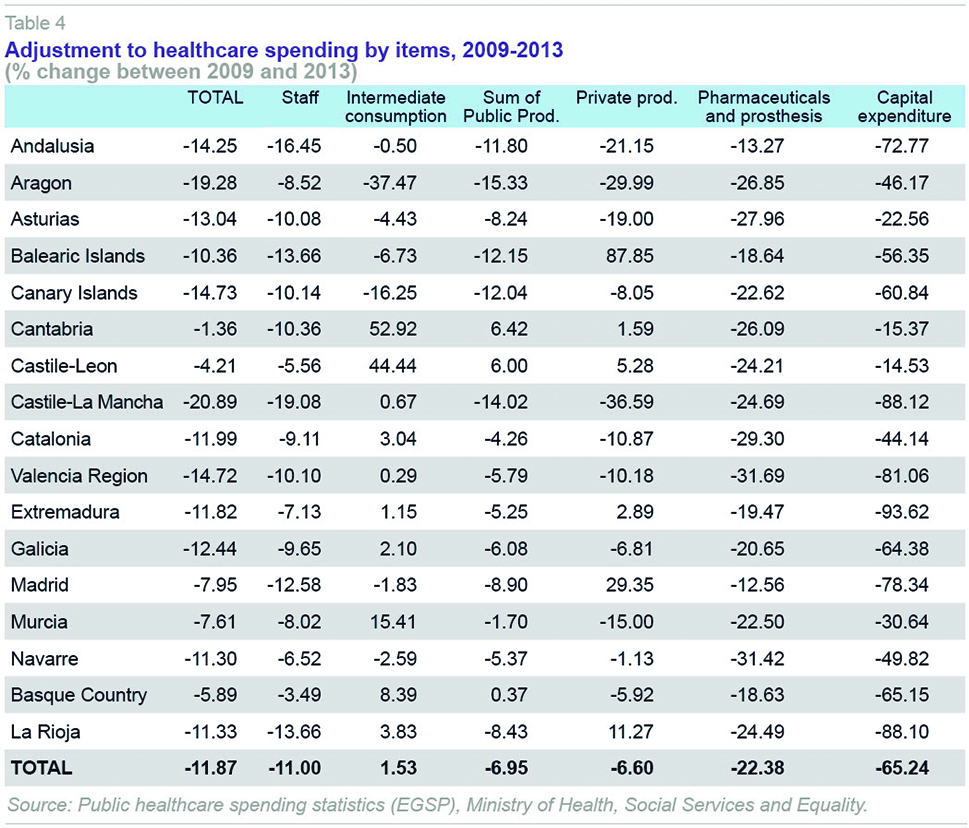
The pattern followed by the seventeen autonomous regions differed between the two sub-periods. Overall, just over three quarters of the spending adjustment between 2009 and 2013 took place in the last two years (2012-2013). However, three communities, Andalusia, the Canary Islands and Galicia, in particular, adopted an early cost reduction strategy, with 2010-2011 bearing the brunt of the cutbacks. Andalusia presented a more stable downward path, with fewer fluctuations. Indeed, Galicia and the Canary Islands were the only two regions with positive growth in 2013. At the other end of the spectrum, five regions, namely the Balearic Islands, Madrid, Valencia, Murcia and Aragon, maintained a level of spending in 2011 that was equal to, or even slightly higher than, that two years earlier. The other nine regions began adjustment processes that were similar in intensity to the national average.
There are also significant differences in the final outcome of the cost reduction process (Table 4). In 2013, compared with the situation prevailing four years previously, the autonomous regions had reduced spending by almost 12 percentage points, on average. Castile-La Mancha and Aragon led the cuts, with over 20 percentage points, followed by Valencia, the Canary Islands, and Andalusia, with 15 points. By contrast, in Cantabria and Castile-Leon, spending only dropped by 1.4 and 4.2 points, respectively. The Basque Country (-5.9 points), Murcia (-7.6) and Madrid (-8.0) also had a smaller than average drop. In the other regions, the final figures are very similar to the national total.In any event, some of the EGSP data referring to intermediate consumption differ from equivalent data from IGAE, especially in the cases of Aragon and Cantabria. This could be due to difference in the processes of recording budgetary expenditure data corresponding to other years, which could lead to over or undervaluation of the figures in a given year. This factor merits consideration as regards to analyzing the results of these two regions.
[5]
Adjustments in service costs
There are three major components to autonomous regions’ healthcare spending: public production of healthcare services, comprised mainly of hospital and specialised services and primary healthcare services; the purchase of private services under agreements, aimed mainly at specialist and hospital care; and finally, outpatient pharmaceutical services. Together, these three items account for 97% of healthcare spending by the autonomous regions, with primary care accounting for more than 13%, specialised and hospital care 49%, the purchase of private services 9% (of which over 7% is for hospital and specialised services), and drug prescriptions 21% (Table 5).
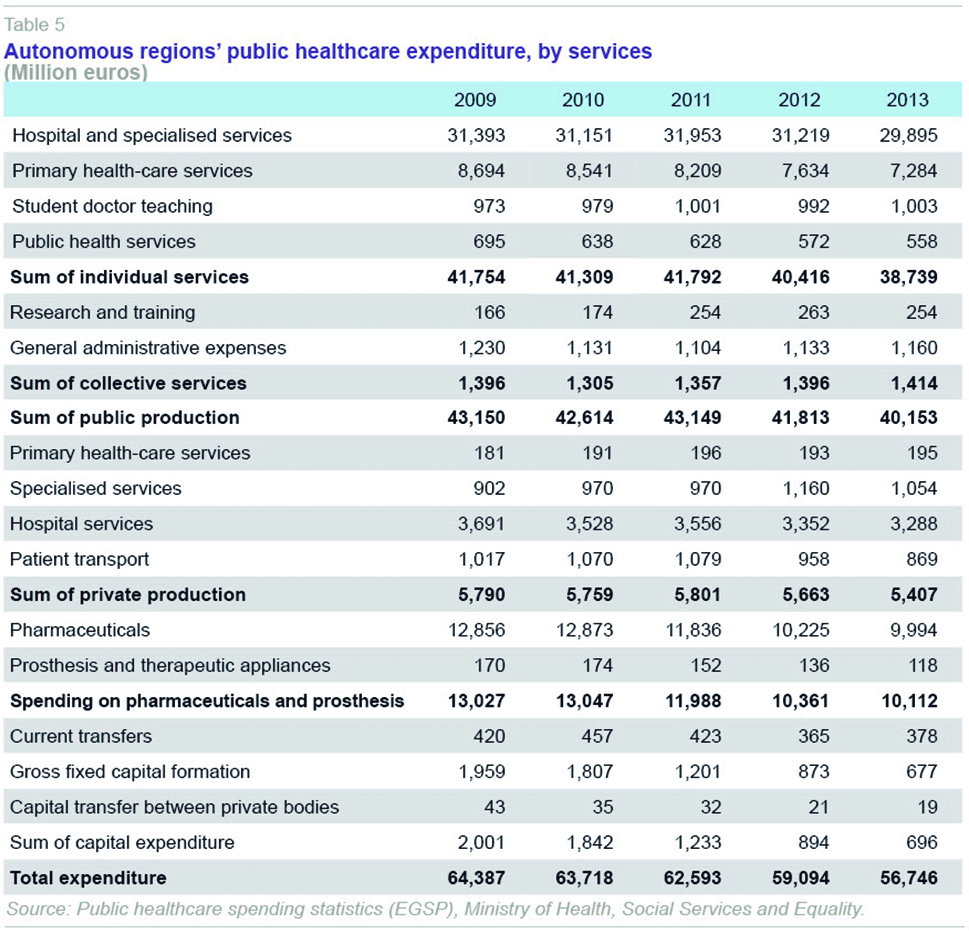
The reduction in expenditure on the public production of healthcare services was particularly intense in the case of primary healthcare services, in which there was a continual drop between 2010 and 2013, ending the four-year period with a cumulative decrease of 16.2%. In the case of hospital and specialised care, the drop was smaller (4.8%), particularly due to the difficulties stabilising intermediate consumption expenditure, which in fact rose over the course of the period.
Procurement was barely affected until 2012, when there was a slight drop in spending on hospital services and patient transport. The final adjustment in private production over the four-year period is therefore slightly lower than that applied to publicly-produced individual services: -6.6% and -6.9%, respectively.
However, the biggest adjustment in absolute terms was in spending on outpatient drugs, prosthesis and therapeutic devices, which dropped by 22.4% between 2009 and 2013, mainly as a result of the measures taken regarding regulated prices of medicinal products and the reduced consumption of prescriptions, following the increase in the share of prescription costs paid by users.
Cost-cutting measures have included closing surgeries and ongoing care facilities, limiting opening hours at healthcare centres, reducing the number of hospital beds, doctor´s offices and operating rooms, etc. Thus, for example, the number of beds in operation in national healthcare system hospitals went from 115,418 in 2010 to 109,484 in 2013, a reduction of 5.2%. The decrease relative to the peak year in each region was proportionately higher in Castile-La Mancha (-13.6%), Catalonia (-8.2%), Cantabria (-7.3%) and Navarre (-6.8%), and much more limited in the Canary Islands (-1.6%), Murcia (-2.1%), Asturias (-2.3%), Extremadura (-3.3%) and Andalusia (-3.3%), increasing only in La Rioja.
[6]
However, in absolute terms, more than three quarters of the spending adjustment affected staff and drug prescriptions, two factors that will be discussed below.
Staff and human resource spending
The cut in staff costs relied partly on wage cuts and freezes dictated by the central government, and various control measures adopted by the autonomous regions, along with a cut in the workforce (temporary workers, retirement at 65). In the case of the former, there are no a priori grounds for deducing negative effects on healthcare, except possible impacts on productivity that are difficult to quantify. However, it is much more plausible that cuts in the workforce have had an impact on the quality of healthcare, waiting lists, etc., such that it is possible to detect the regions in which the cuts may have had a more negative impact.
Among staff associated with the national healthcare system, staff reductions have been concentrated in hospital and specialised care, with a lesser impact on primary healthcare, despite which, as we have seen, the effects in terms of spending were proportionately greater in primary than specialised care. The number of staff in primary healthcare was 85,267 in 2009 and, after a slight drop in 2010, it peaked at 85,852 in 2011, dropping to 84,651 in 2013. The changes were therefore relatively minor and mainly targeted non-medical personnel (the changes in general practitioners, pediatricians and nursing staff were minimal), although in some autonomous regions the adjustments were bigger. However, there is no common pattern for the change in healthcare personnel numbers over the period analysed. Only in the cases of Asturias, Castile-Leon, the Basque Country and La Rioja was a somewhat larger drop observed in the number of primary healthcare staff relative to the peak reached by each of them at various points during the period.
Conversely, in hospital and specialised care there was a significant reduction in staff in almost all the autonomous regions. Due to the break in the series in 2010, when the Estadística de Establecimientos Sanitarios en Régimen de Internado [In-patient Health Establishment Statistics] (ESCRI) was replaced by the Sistema de Información de Atención Especializada [Specialised Care Information System] (SIAE), it is only possible to make uniform comparisons taking the period 2010-2013 as the reference. Over this interval, the drop in total staff employed at public centres or similar in the national healthcare system was 21,011 people, 4.5% of those employed in 2010. Differences between the autonomous regions are apparent here too. Taking as a reference the year in which there was a peak in staff numbers (2009 in ten regions, and 2010 in the other seven), the biggest adjustments took place in Castile-La Mancha, Navarre, Madrid, Andalusia and Catalonia, while the smallest took place in the Basque country (where there was even an increase in staffing), La Rioja, Extremadura and Galicia.
A more detailed examination of the professional categories of hospital and specialised care staff yields interesting findings on where the staff cuts were concentrated. Thus, there has hardly been any reduction in the number of doctors, which went from 76,691 in 2010 to 76,481 in 2013, with the specific exceptions of Castile-La Mancha and Catalonia. Instead, the cuts have targeted nursing staff, medical technicians, and non-medical personnel. In the case of the former, from a maximum of 135,921 employees in 2010, there was a drop of 4,110 (3.0%) to 131,811 in 2013. The regions most affected relative to their peak staff numbers in 2010 or 2011 were Andalusia, Castile-La Mancha, Madrid, Catalonia, and Murcia. The least affected were the Basque Country, where there was growth, La Rioja, the Balearic Islands, Cantabria, and Extremadura. The cut in the number of medical technicians (auxiliary and higher technicians) was 5,936 (4.8%), with Castile-La Mancha, Valencia, Andalusia, and Madrid making the largest cuts, and Galicia, the Basque Country, the Canary Islands, and the Balearic Islands making the smallest cuts. In the case of non-medical personnel, the reduction was 8,898 staff (7.4%) relative to 2010, leaving a final total of 111,548 in 2013. In this case, the regions making the biggest cuts in relative terms were Navarre, Castile-La Mancha, the Balearic Islands, Madrid, Murcia, Andalusia, and Asturias, while the Basque Country, Valencia, La Rioja, and Galicia were least affected. It can therefore be concluded that in both primary healthcare and hospital and specialised care, the lower staff grades have borne the brunt of the autonomous regions’ staff cuts in the area of healthcare.
Outpatient drug spending
Outpatient drug spending was one of the items hardest hit by the adjustment process. Over the period studied as a whole, drug spending, including spending on prosthesis and therapeutic appliances, dropped by 22.4%, following a similar trajectory to overall expenditure: an initial drop of 8.0% in the period 2010-2011 (in reality the adjustment appears in the 2011 figures, as in 2010 there was barely any change) and then a subsequent, stronger drop of 15.6% in 2012-2013, mainly concentrated in 2012. The regions with the biggest drop in spending over the four years were Valencia (-31.7%), Navarre (-31.4%), Catalonia (-29.3%), and Asturias (-28.0%). The smallest drops took place in Madrid (-12.6%) and Andalusia (-13.3%).
The significant reduction in drug spending was linked to two factors: the number of prescriptions invoiced and the average cost per prescription. The number of prescriptions peaked in 2011 at 970.9 million, after
positive, but ever slower, growth in the preceding years. Between 2012 and 2013, there was a drop of close to 12% in the number of prescriptions invoiced, spread evenly over the two years. However, there were differences between the regions. Although the pattern was close to the national average in most cases, there was a bigger drop in Valencia (16.3%) and Catalonia (14.7%), while the Canary Islands (7.6%) and Extremadura (8.3%) experiences smaller drops.
The average cost per prescription also fell slightly in 2009, then falling more strongly in 2010-2011, with a drop of 1.95 euros/prescription, i.e. 14.6% in comparison with 2009. Subsequently, in 2012-2013, the cumulative drop was smaller (0.76 euros), 6.6% compared with 2011, practically all of which was concentrated in 2012. Overall, spending per prescription went from 13.39 euros in 2009 to 10.68 euros in 2013 (20.6%). The biggest drops from each region’s peak in 2008 or 2009 took place in the Balearic Islands (26.0%), Asturias (24.3%), the Canary Islands (24.2%), Castile-Leon (24.2%) and La Rioja (24.0%); the smallest, in the Basque Country (15.0%), Cantabria (16.7%) and Andalusia (17.4%). The final outcome is that the national healthcare system’s average spending per prescription invoiced in 2013 is above average in the Basque Country, Valencia, Galicia and Cantabria, and clearly below average in Andalusia and Catalonia.
Concluding remarks
To sum up, healthcare spending adjustments have been concentrated in four areas: wage cuts, staff cuts among the lower professional grades, cuts in drug prices, and the virtual elimination of investments. In general terms, the autonomous regions with the biggest deficit problems had to make the biggest cuts to their healthcare services: Castile-La Mancha, Valencia, Catalonia and Andalusia therefore had the biggest reductions on most of the indicators examined. By contrast, the Basque Country, Madrid, Castile-Leon, and Galicia were able to make much milder adjustments.
However, a simple analysis of the spending figures does not give any insight into possible organisational reforms or innovations that some regions may have put in place to improve the efficiency of their healthcare services. It is also true that, ultimately, the analysis here only accounts for the inputs, without addressing their effects on intermediate healthcare outputs, or more difficult still, the final output in terms of the population’s health. A simple description of the facts and figures, however, clearly reflects that the majority of the reduction in autonomous regions´ healthcare spending came from the central government´s decision to implement much-needed fiscal consolidation measures (salaries, public employment, pharmaceutical prices, etc.) Thus, unfortunately many of the measures adopted during the crisis can be characterised more as simple cutbacks rather than adjustments, and therefore once their immediate fiscal impact has worn off, additional measures will be needed to improve the efficiency of healthcare services at the national level.
Notes
For a review of regional treasuries during the crisis and the time sequence of adjustments, see Lago Peñas and Fernández Leiceaga (2013).
For a review of the methodological issues concerning public health spending statistics, see Ministry of Health, Social Services and Equality (2013).
For an examination of the relationships between health expenditure and regional finance, see Cuenca and González (2015).
For people in paid employment, the general contribution, which had been 40%, remained at this percentage only for people on an annual income of less than 18,000 euros, rising to 50% for anyone earning between 18,000 and 100,000 euros, and rising to 60% for those earning over 100,000 euros a year. For pensioners there are two brackets for contributions: 10% or 60%, depending on whether or not they have an income of 100,000 euros, but with a ceiling of 8 euros a month for those earning less than 18,000 euros a year, 18 euros a month for those between 18,000 and 100,000 euros, and 60 euros a month for those receiving over 100,000 euros. Finally, certain groups receiving social welfare benefits are exempted.
In the case of Aragon, the sum of intermediate consumption spending in the years 2012 and 2013 is practically the same according to both EGSP and IGAE data, but the distribution between the two years shows a sharp decline in 2013 on the basis of EGSP data, that nevertheless, is much smaller on the basis of IGAE data. In Cantabria, the difference is observable in 2012, with a figure much larger in terms of EGSP data, due to the recording in the budget of payments immediately made through the service provider payment mechanism, which was applied for the first time that year.
See Ministry of Health, Social Services and Equality (2015 a,b,c,d).
References
CUENCA, A., and R. GONZÁLEZ (2015), “Sistema de financiación autonómica y gasto sanitario en España,”
Papeles de Economía Española, 143: 75-93.
LAGO PEÑAS, S., and X. FERNÁNDEZ LEICEAGA (2013), “Las finanzas autonómicas: expansión y crisis, 2002-2012,”
Papeles de Economía Española, 138: 30-146.
MINISTRY OF HEALTH, SOCIAL SERVICES AND EQUALITY (2013),
Estadística de Gasto Sanitario Público, Metodología, http://www.msssi.gob.es/estadEstudios/estadisticas/docs/EGSP2008/egspMetodologiaGeneral.pdf— (2015a),
Sistema de información de atención especializada (SIAE). Dotación. http://pestadistico.inteligenciadegestion.msssi.es/publicoSNS/comun/Cubo.aspx?IdNodo=14036#no-back-button— (2015b),
Sistema de información de atención especializada (SIAE). Personal y formación. http://pestadistico.inteligenciadegestion.msssi.es/publicoSNS/comun/Cubo.aspx?IdNodo=14037#no-back-button— (2015c),
Sistema de información de atención primaria (SIAP). Recursos. http://pestadistico.inteligenciadegestion.msssi.es/publicoSNS/comun/Cubo.aspx?IdNodo=6407#no-back-button— (2015d),
Facturación de recetas médicas. http://www.msssi.gob.es/profesionales/farmacia/datos/home.htm
Eduardo Bandrés. University of Zaragoza and FUNCAS
Rosa González. FUNCAS