
Rental affordability in Spain: Trends and variations across regions
Residential rents have increased sharply over the past decade, with average household expenditure on rent increasing by 27.7% between 2015 and 2022- well above the growth in average household income – yet with notable differences across the Spanish regions. The rent control policies introduced in 2022 have kept growth in average spending on rent at 2.1% (compared to 11.2% in 2019), however, although there are no rigorous studies, some real estate portal reports suggest these policies have also led to an estimated reduction of 30% in the supply of rental housing.
Abstract: Residential rents have increased sharply over the past decade. Average household expenditure on rent increased by 27.7% between 2015 and 2022, which is well above the growth in average household income (16.6% in households with one earner and 22% in households with two or more earners). The situation deteriorated after the pandemic. Until 2020, around three of every 10 households earmarked over 30% of their total spending on rent. In the wake of the pandemic, that percentage has increased to approximately four out of every 10 households. In fact, in 2022, aggregate spending on rent plus utilities (water, energy and common services) accounted for over 30% of spending for 60.5% of tenants. Regionally, there are significant differences in the financial burden implied by renting, with Ceuta and Melilla, the Basque region, the Balearics, Madrid and Catalonia registering the highest burdens. La Rioja, Murcia and Extremadura are home to the lowest burdens. The rent controls introduced in 2022 kept growth in average spending on rent at 2.1% (compared to 11.2% in 2019). As far as we are aware, there are no evidence-backed estimates of how the latest regulatory changes may have affected supply. However, the real estate portals estimate a reduction of close to 30%.
Socio-economic profile of households that rent
Spain had 18.9 million households in 2022 (INE, 2022). According to the microdata provided via the Spanish Household Budget Survey (SHBS) (INE, 2023a), 76.4% lived in homes they owned, 17.7% in rented dwellings and 5.8%, in free tenancy, i.e., accommodation provided by friends or family. [1] Table 1 presents the shares of housing tenures for different socio-economic categories. The age of the breadwinner is a key determinant of whether a household owns or rents its home. 42.7% of households whose main earner is under the age of 35 rent. The incidence of rental tenure falls with age, the opposite to the trend in home ownership. From the age of 55-65, the percentage of mortgage-free home owners jumps to 62.1%. It reaches 83.0% in the over-65 category, where rental tenure is at its low, at 7.5%.
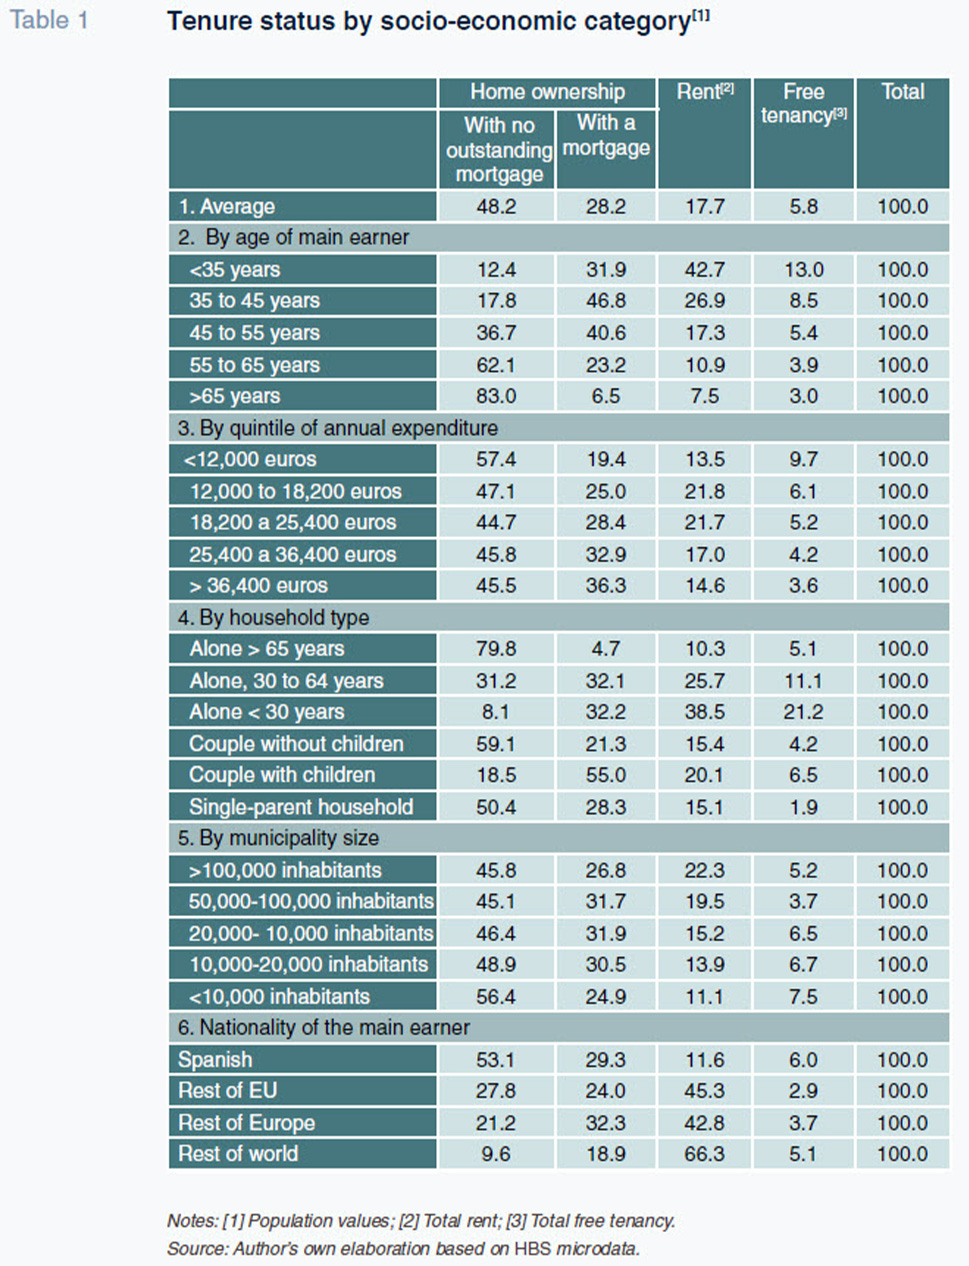
The youth-rent binomial is particularly pronounced for young adults under the age of 30 who live alone, at 38.5%. Affording rent is a major handicap for young Spaniards as a result of the situation in the labour market, which is characterised by a high incidence of temporary work, unemployment rates well above the OECD average and low salaries (OECD, 2023). Tougher conditions for getting a mortgage help explain the differences observed in access to owned or rented housing. Indeed, the higher incidence of free tenancy in youths under the age of 30 (21.2%), is masking and mitigating the housing affordability issue. The snapshot for 2022 shows that the predominant tenure status is home ownership, albeit trending lower since 2015.
Rent is more prevalent among households with medium- or medium-low income levels (annual expenditure of between 12,000 and 25,400 euros, or between 1,000 and 2,100 euros per month). The percentage of households in these two expenditure quintiles (second and third) that rent oscillates around 22% in both cases. It is probable that some of these households are living in shared dwellings, particularly in the case of the youngest households and those living in cities where rents are particularly tight, including Palma de Mallorca, Barcelona, Malaga or Madrid. For households that spend under 1,000 euros on rent a month, the use of free accommodation is at its highest, at 9.7%, which is nearly twice the national average, of 5.8%.
By household type, rental tenancy varies significantly between households comprising young adults living alone – nearly 40% of those under the age of 30 – and households with children, whether in couples (20.1%) or single-parent households (15.1%). Also, rent is more prevalent in urban areas than rural areas, accounting for 22.3% of tenancy in cities with over 100,000 inhabitants, which is twice the incidence in towns with fewer than 10,000 inhabitants (11.1%). Lastly, rent is at its highest intensity in immigrant households. Here the incidence ranges from 42% to 45% if the main earner is European, rising to 66.3% in the case of immigrants from outside Europe.
Rising rent burden dynamics
In the rest of this paper, we use two complementary affordability measures to quantify the financial burden implied by rent. The first is the traditional measure of the rent burden, which expresses the amount spent to rent a primary residence over total household expenditure. [2] A burden of 30% has long been considered a red line (for both rent and debt servicing in the case of home ownership) past which households’ financial risk and risk of social exclusion increase. Spain’s Housing Law of 2023 reformulated how it calculates this measure of the financial burden to include in the numerator spending on basic utilities (common services, water, and energy) [3] (rent + utilities financial burden). [4], [5] The backdrop for this redefinition was sharp inflation in energy costs in 2022: electricity (26.8%), natural gas (16.5%), LPG (27.0%) and heating fuels (72.5%).
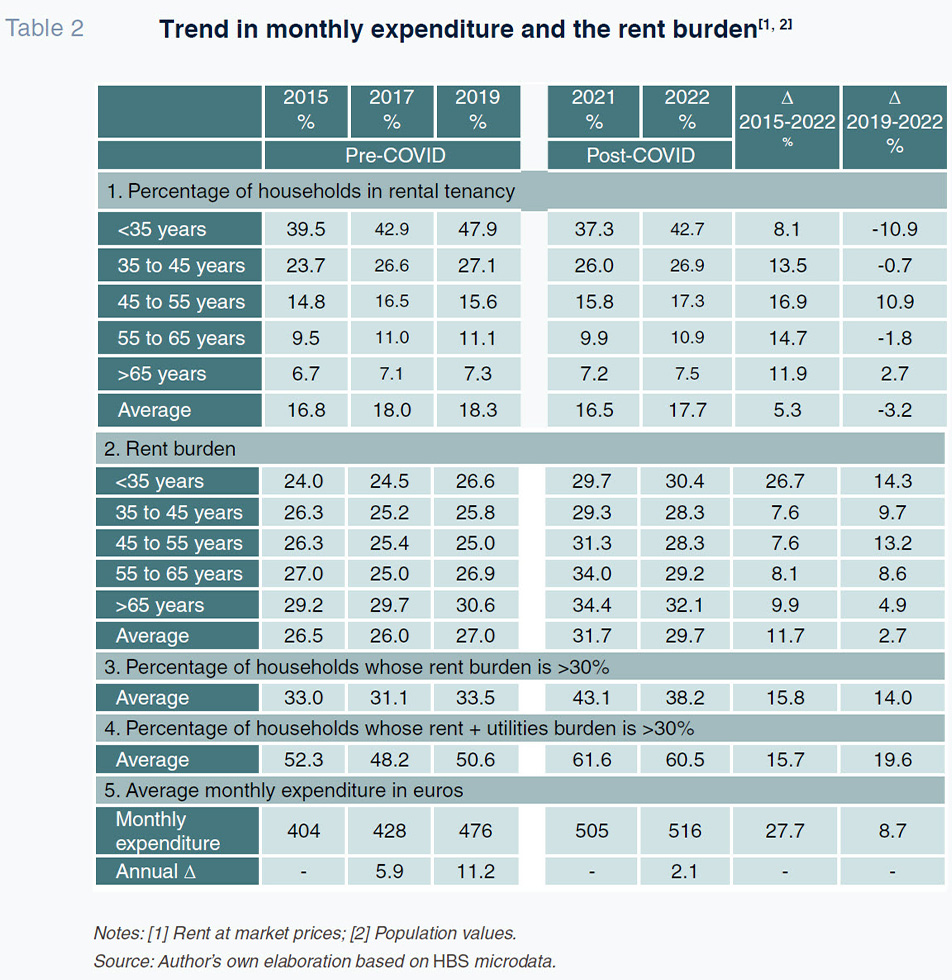
Table 2 presents the trend in the percentage of households that rent and in the rent burden since 2015. For comparative purposes, the table presents the figures before and after the COVID-19 pandemic to enable an analysis of the trend in both periods. The results yield the following conclusions:
- Between 2015 and 2019, the percentage of households living in rented dwellings increased in all age categories. That number also increased in absolute terms, as shown by Caixabank Research (2023). During that period, the number of households renting at market prices reached 610,000, compared to net new household creation of 385,000. The pandemic came along and reduced the share of rent tenure in 2022 to a similar level to that of 2017.
- The age group that rents more intensely is the under-35 category. Around four out of every 10 of these households were renting in 2015, a figure that was approaching five out of 10 by 2019. The incidence of rental tenure in this category decreased by 5.2 points (-10.9%) between 2019 and 2022, compared to an average decrease across all households of 1.8 points (-3.2%). That decrease is largely attributable to the drop in the percentage of young adults living outside the parental home, from 20.6% in 2019 to around 17% in 2020 and 2021.
- Average monthly spending increased from 404 euros in 2015 to 516 euros in 2022, an increase of 27.7%. The increase in average spending on rent has outpaced the growth in average household income. The latter increased by 16.6% in the case of households with a single income earner and around 21% in households with two or more earners (INE, 2023b). That gap in the rates of growth is undermining tenants’ real financial wherewithal. It is a phenomenon that is having a bigger impact on households with just one income earner, where the gap stands at 11.1 points, compared to those with two or more earners, where it is around 7 points. Indeed, households with just one earner face a higher risk of social exclusion, a risk Caixabank Research (2023) estimates at 44.8%.
- As we will see in the next section, there are significant differences in rents per square metre between the various regions and cities. In 2021, the last year for which the so-called State Reference System is available, the highest prices were found in Madrid, at 10.7 euros, and the lowest, in Extremadura, at 4.4 euros. [6], [7] Using the average prices and apartment sizes gleaned from the System, we arrive at an average rental expenditure in 2021 of 550 euros. That is, therefore, in line with the 505 euros shown in Table 2 using the SHBS microdata.
- The financial burden implied by rental tenancy has been increasing since 2015. In the pre-pandemic years, the burden ranged between 26% and 27%. After the pandemic, the rent burden climbed above the threshold of 30%, which, as mentioned earlier, marks the risk zone for not being able to pay rent. [8] The increase in the rent burden between 2015 and 2022 has been most pronounced in young adults, under the age of 35: at 26.7% compared to under 10% for all other age categories.
- Before the pandemic, around three of every 10 households earmarked over 30% of their total expenditure to rent. In the wake of the pandemic, that percentage has increased to close to four out of every 10 households. The cost of basic housing costs, particularly energy, has increased the financial burden borne by tenants. Before the pandemic, around 50% of all households bore a financial burden of over 30% including utilities, a figure that has risen to around 60% since the pandemic. It is likely that the drop in energy costs will drive a reduction in this percentage in 2023.
A number of measures have been introduced since 2022 to curb the growth in rents. Between April 2022 and December 2023, rent increases were capped at 2%, a figure that has been increased to 3% in 2024.
[9] As shown in Table 2, the government appears to be meeting its goal of limiting the growth in prices, as average spending increased by just 2.1% in 2022, compared to 11.2% in 2019.
[10] The evidence available for cities such as San Francisco or Berlin shows that price controls tend to reduce supply (OECD, 2023). As far as we are aware, there are no well-substantiated studies measuring the effects of the latest regulatory changes on the supply of rental housing. Taken with due caution, the market studies of some of the main real estate portals suggest that supply contracted by around 30% in 2022 (Servihabitat, 2023; Fotocasa, 2023). At any rate, the scale of this problem in Spain is significant. The contractions in supply in the private market, even if not of that magnitude, are far from being mitigated by the minuscule size of the social rent market in Spain. Social rental housing in the total housing stock in Spain is 1%, compared to an average of 7% in the OECD (2023).
The rent burden snapshot in 2022: Geographic differences
Next, we delve deeper into the pressure rent placed on households’ financial wherewithal in 2022. To do that we need to know: (i) the levels of financial burden (rent and rent + utilities) (Table 3); and (ii) the percentage of households in which rent plus utilities absorb more than one-third of their total expenditure (Table 4).
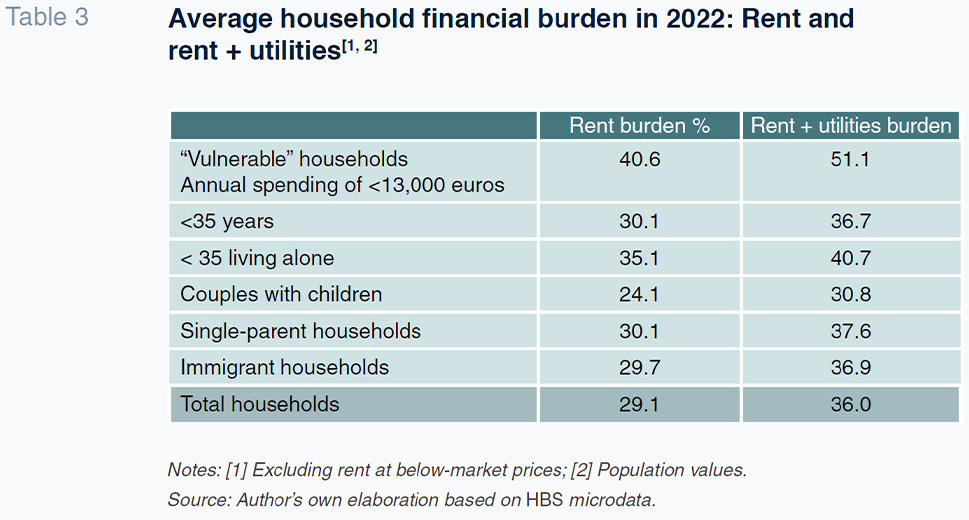
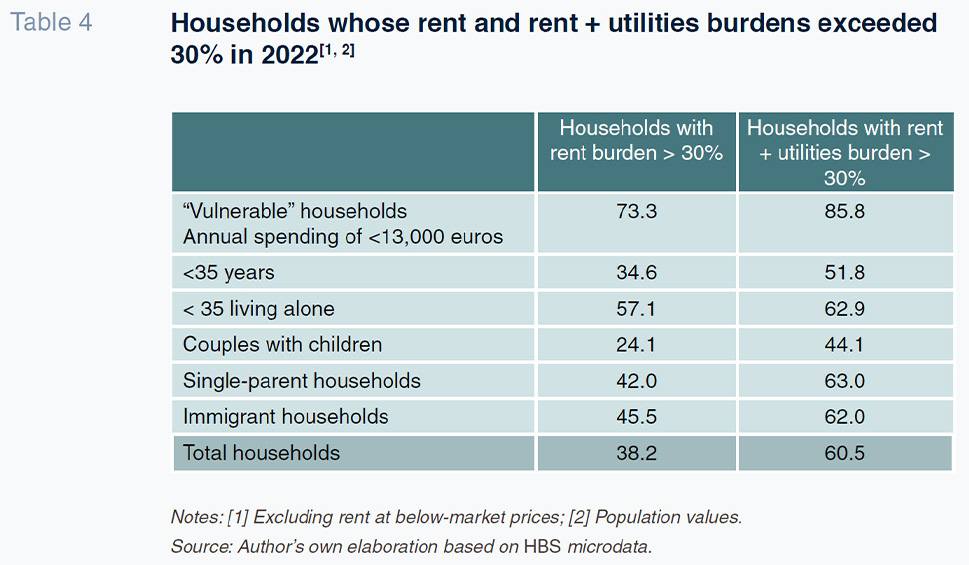
Table 3 reveals an average rent burden of 29.1% in 2022, a figure which rises to 36.0% adding in basic utilities. Of the latter, energy costs accounted for around 5.5 points on average, expenditure on water accounted for 0.9 points and shared services, 0.5 points. Households with higher rent burdens have been termed “vulnerable” households. Those whose annual expenditure is less than 60% of the national median (around 13,000 euros per annum). On average, households earning 1,000 euros a month (mileuristas) devoted 51.1% of their monthly budgets to rent and utilities. Of that excess burden, 8.4 points corresponded to spending on energy and 1.4 points to water, in both cases, 1.5 times the average for all households. The average level of spending available for other goods, including food, was just 530 euros per month.
In general, calculations confirm that the rent burden is much higher in the case of single-member households. In households with children, the financial burden (rent + utilities) averages 30.8% in the case of couples and 37.6% in the case of single-parent households. It is safe to say, therefore, that spending economies of scale are significant to the financial health of households that rent. For young adults under the age of 35 who live alone, the financial burden is close to 41%. That is slightly above the level of 36.9% recorded for immigrant households.
Elsewhere, as shown in Table 4, 60.5% of households earmarked more than one-third of their spending budgets to rent and utilities. In the case of households that earn 1,000 euros per month, the percentage of households whose rent plus utilities represented more than the 30% threshold was 85.8%. In other words, in the large majority of vulnerable households, rent plus utilities cross the 30% red line. Lastly, the percentage of households spending more than 30% of their income on rent and utilities ranged between 50% and 60% in the case of households under the age of 35, single-parent households and immigrant households.
To wrap up, we focus on the regional differences. Table 5 provides monthly expenditure and the related financial burdens by Spanish region, ordered by the latter metric. We identify three groups: (i) regions where the burden is high, at over 30; (ii) regions where the burden is medium, at 25% to 30%; and (iii) regions where the burden is low, at under 25%.
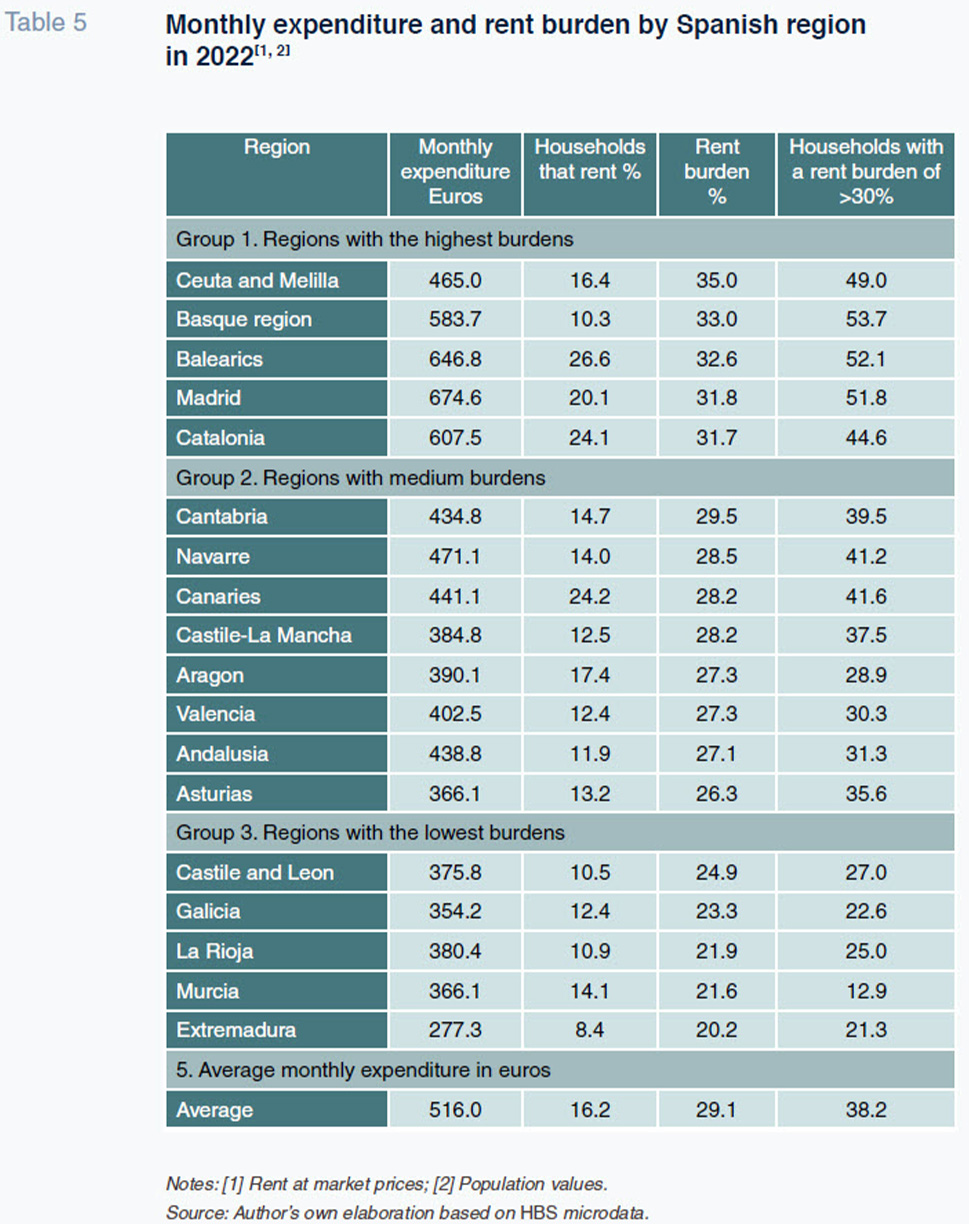
The first group includes, in order, Ceuta and Melilla, the Basque region, the Balearics, Madrid and Catalonia. The last four have in common overall and youth (<25) unemployment rates that are below the national averages. In addition, the Balearics, Madrid and Catalonia are among the regions with the highest incidences of rental tenancy. These findings show that rents are, generally, higher in regions where the supply of employment is higher (OECD, 2023). That constitutes a significant barrier for young adults keen to move out of the parental home. All six of these geographies present higher population densities than the national average (92 inhabitants per km2), adding pressure to demand for rental housing. In Ceuta and Melilla, the population density exceeds 4,000 and 7,000 inhabitants per km2, respectively.
The second group is made up of eight regions dotted around Spain. Many of them include provinces that are part of what is known as ‘Empty Spain’, including Castile-La Mancha, Asturias, Aragon and Valencia. Average expenditure in these regions is moderate, ranging from 366 euros in Asturias to 471 euros in Navarre. Except for the Canary Islands, where the incidence of rented tenure is higher, the percentage of renting households ranges between 12% and 17%. Lastly, group three includes the six regions reporting lower monthly expenditure, lower percentages of rented dwellings and lower financial burdens, with and without utilities. Extremadura ranks last, with average monthly expenditure of 277.3 euros and a financial burden of 20.2%.
Table 5 illustrates the significant differences in burdens. On average, renting in Madrid, the Balearics and Catalonia is 1.8 times more expensive than living in the group three regions: Castile and Leon, Galicia, La Rioja, Murcia and Extremadura. Madrid and Extremadura lie at either extreme of the table, with average monthly expenditure on rent of 674.6 euros versus 277.3 euros. In group one, over 45% of all households presented a burden of over 30%, a figure that rises above 50% in the Basque region, the Balearics and Madrid. In contrast, in group three, less than 30% of households presented a burden of over 30% and in La Rioja, Murcia and Extremadura, the average was under 22%.
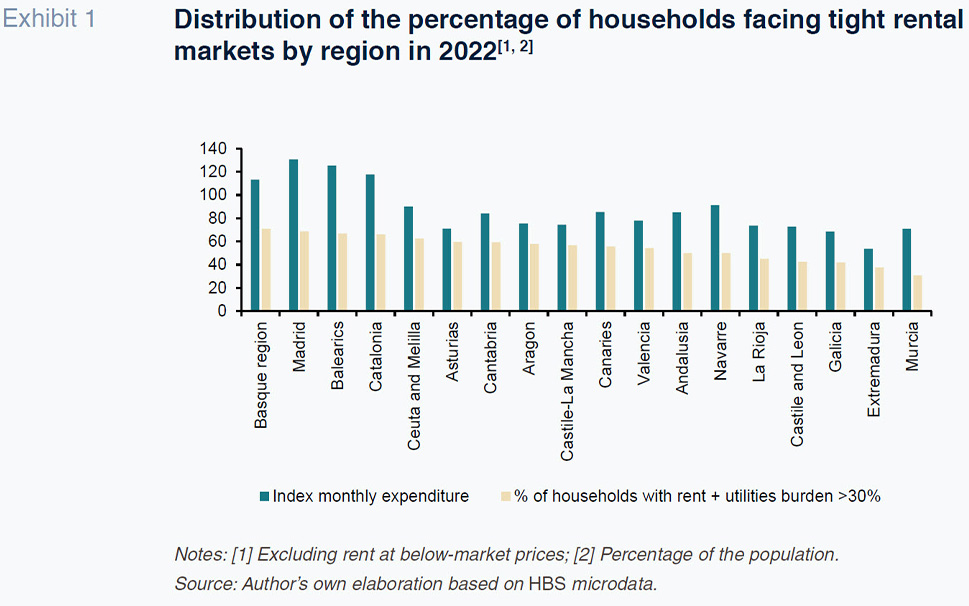
By way of conclusion, Exhibit 1 shows the percentage of households in each region of Spain that spend more than 30% of their income on rent plus utilities. They are the regions that qualify as tight rental markets under the Housing Law of 2023. [11] Exhibit 1 likewise provides average monthly expenditure indexed to the national average (rebased to 100). As that exhibit shows, on average, all regions presented tight markets in 2022 as they all presented rent plus utilities burdens of over 30% (with Murcia reporting the lowest burden). In the Basque region, Madrid, the Balearics, Catalonia and Ceuta and Melilla, over 60% of all households spent more than 30% of their total budgets on rent plus utilities. The Basque region, Madrid, Catalonia and the Balearics are also the regions where monthly rental expense is highest.
Notes
Similar percentages to those extracted from the microdata gleaned from the Living Conditions Survey (INE, 2023b).
Spanish Law 12/2023 of 24 May 2023 on the right to housing (Official State Journal: 25 May 2023).
Alternatively to the 30% threshold so calculated, the financial burden is likewise considered excessive if rents have increased by at least three points more than CPI on a cumulative basis during the five years prior to declaring a rental markets as “tight”.
Indeed, this is one of the criteria used to identify areas where rents are stretched or tight. It allows the regional governments to intervene in the rental market by establishing maximum and minimum prices for each property. Declaration of a tight market must be applied for by each region. So far, only Catalonia will apply this mechanism to a current total of 140 “tight” municipalities, from March 2024.
Does not include figures for the Basque region or Navarre.
The prices publicised on the leading real estate portals are significantly above these figures. However, the prices displayed on those portals are ask prices for current offers and not the contractually agreed rents. That information should therefore be treated with caution.
By the same token, loan applications are rejected when the repayment instalments are more than 30-35% of income (Bank of Spain, 2021).
Royal Decree-Law 6/2022 of 29 March 2023.
This figure is higher than the rent price growth of 1.3% estimated by Spain’s National Statistics Office (INE).
The Housing Law refers to income and not spending. Therefore, the use of the income variable in the calculations could result in certain differences, assuming the existence of positive average savings.
References
Desiderio Romero-Jordán. Rey Juan Carlos University and Funcas