The internationalisation of the Spanish economy: Progress, limitations and best practices
Spanish exports of goods and services over recent years grew at a rate comparable only to Europe´s leading major exporters. However, the level of concentration in just a few exporting companies suggests smaller companies at the base of Spain´s exporting pyramid still face considerable constraints, leaving significant room for growth and improvement.
Abstract: In aggregate terms, Spanish businesses have improved their internationalisation markedly in recent years. However, the Spanish economy is still a long way from presenting net exports comparable with those of Germany, the Netherlands or Italy. This is partly due to the serious constraints faced by many businesses at the base of the pyramid of exporting firms (small and medium-sized firms that export sporadically in an ad hoc way) when seeking to start, continue or scale up their process of internationalisation. This is demonstrated by the extremely high concentration of Spanish exports in a small group of companies. This article includes a review of some international best practices in helping businesses at the base of the pyramid overcome these hurdles.
Introduction
In order to recover fully, and achieve more stable and sustainable growth that minimises the risk of future crises, the Spanish economy needs to become more open to foreign markets. The weight of the various different sectors needs to be balanced, reducing the non-tradable sectors’ share of the economy, while at the same time making a concerted effort to sell more goods and services abroad. This is the prescription followed by comparable countries that have recovered more quickly from the crisis.
In this context, this article aims to analyse recent trends in the level of internationalisation of the Spanish economy and its firms. Firstly, from a macroeconomic perspective, it examines evidence in support of the Spanish economy´s reorientation towards foreign demand in the wake of the crisis. Spain´s position is analysed in comparative terms relative to the four other large economies of the euro area.
Businesses, of course, play a fundamental role in this process of opening up to the exterior. This article therefore approaches the question from a microeconomic perspective, analysing the latest data available on Spanish exporting businesses. The aim is to deepen our understanding of the business demography that has supported growth of Spanish exports, and in particular, analyse what role small and small to medium businesses play, as these are the firms that face the most difficult competitive conditions.
The article concludes with a short review of some international best practices that have been adopted to support the internationalisation of these types of firms.
Macroeconomic analysis
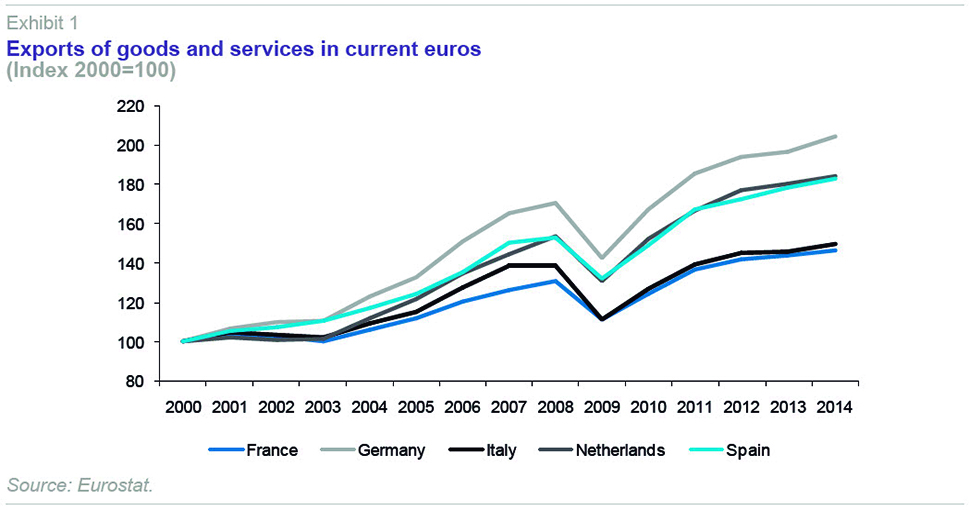
Spain’s exports of goods and services grew between 2000 and 2014 at a rate comparable only with the leading exporters among the euro area’s five major economies: Germany and the Netherlands. Measured in current euros, Spanish exports have almost doubled in value over this 15-year period (Exhibit 1).
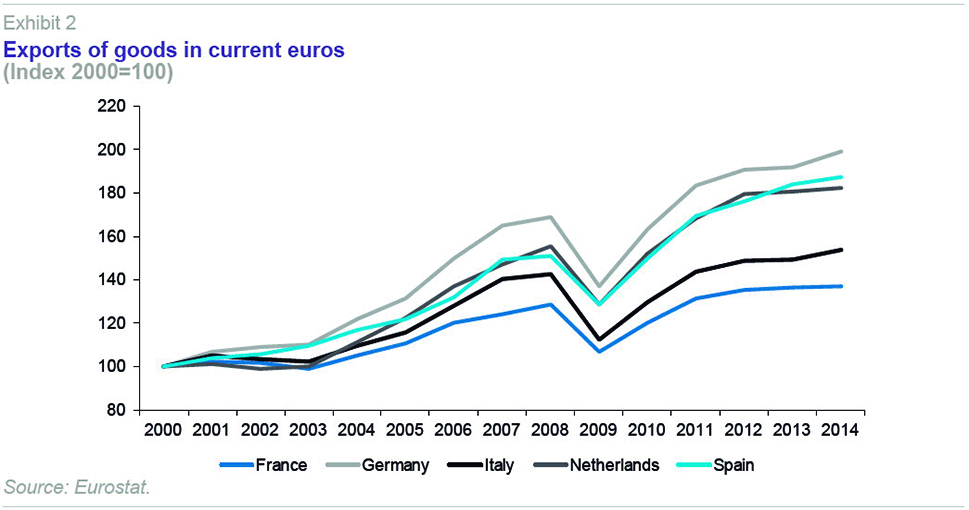
As is well known, services exports include expenditure by foreign tourists in Spain. However, even excluding this item, and analysing only goods exports, the Spanish external sector’s performance has been robust – as previously described. Spanish goods exports virtually doubled between 2000 and 2014. Growth in goods exports therefore exceeds that of the Netherlands and is only behind that of Germany when comparing with the top five euro area economies (Exhibit 2).
However, despite the more than satisfactory performance of exports, Spain’s process of internationalisation is also being held back by some significant limitations.
According to the work of Myro (2013), the Spanish economy’s internationalisation suffers from three types of structural weaknesses: (i) a productive structure with a pattern of specialisation that is narrowly focused on low and medium-low technology intensive manufacturing, (ii) a business structure with an excess of small firms; and, (iii) a geographical structure of exports and international activity as a whole that is still very much focused on EU destinations. Moreover, García-Canal (2013) points to additional weaknesses, such as declining Spanish investments (FDI) abroad.
On top of this are a number of complementary traits characterising the Spanish export model.
Exhibit 3 shows Spain’s net exports of goods and services as a percentage of GDP, together with the total balance,
i.e., the sum of the individual goods and services balances. Exhibit 4 represents the same series for the other four largest euro area economies (Germany, the Netherlands, France and Italy). Table 1 shows the averages for these five countries over the period 2000-2014 as a whole and for the intermediate periods 2000-2008 and 2009-2014.
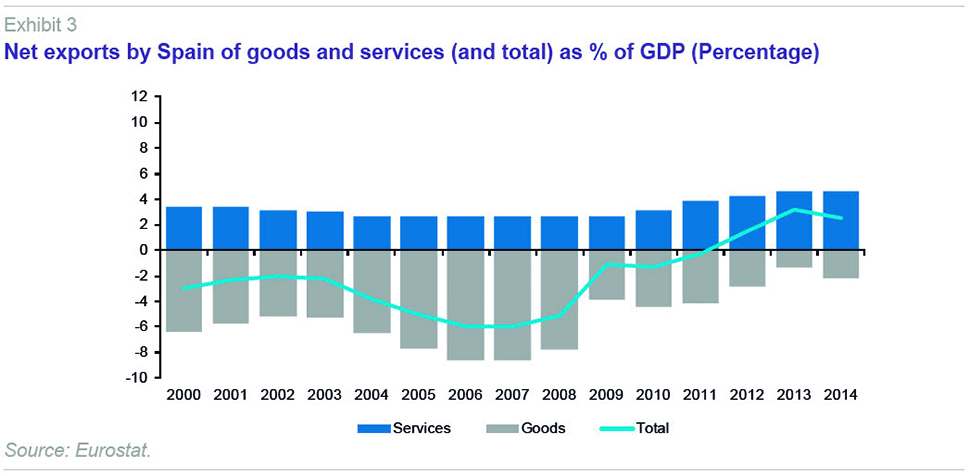
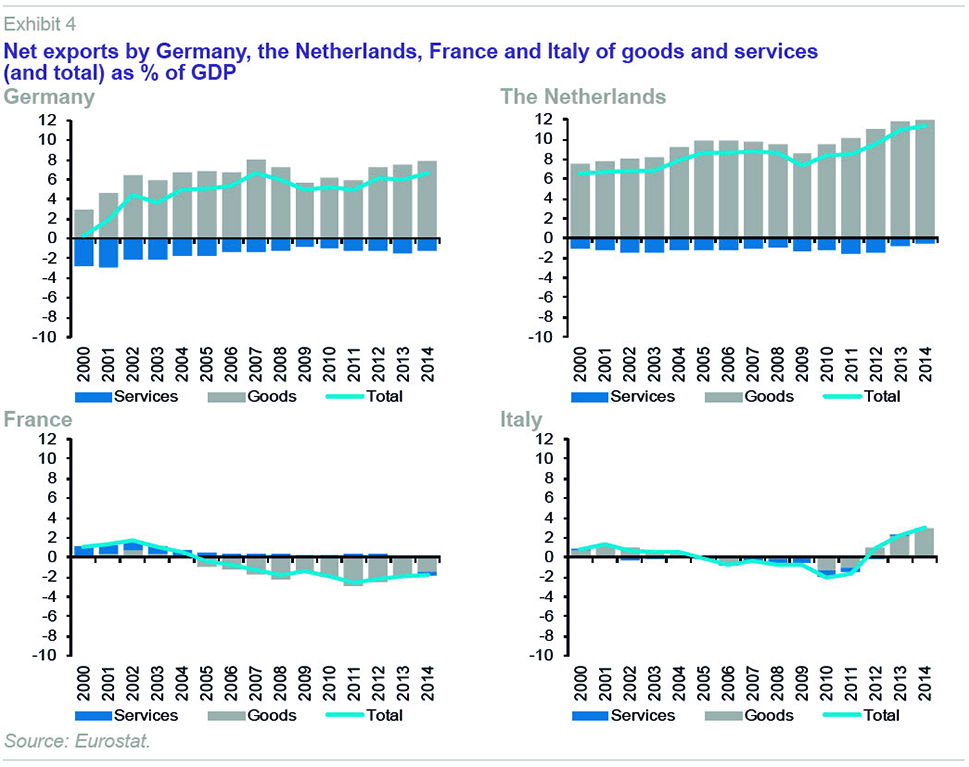
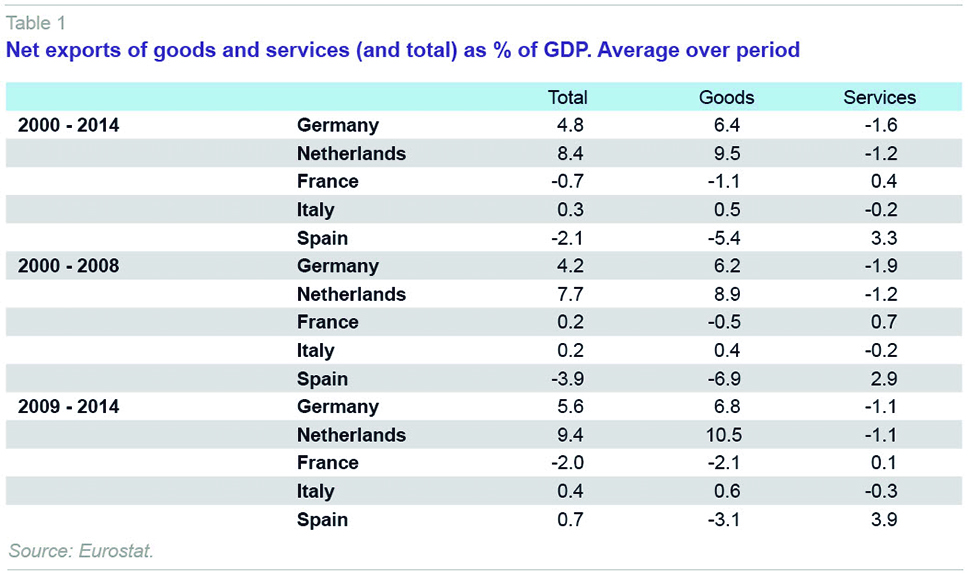
Spain’s trade deficit tripled between 2003 and 2007, rising from 2% to 6% of GDP. Since then, the balance has improved continuously; the balance was in equilibrium in 2011 and, according to the latest data, there was a surplus of 2% in 2014. This performance places Spain’s model mid-way between Germany and the Netherlands on the one side, both of which are exporting powers, with trade surpluses of 8% and 10%, respectively, and France, on the other, where the trade balance has been deteriorating since 2002. Italy is a case apart, with trade performance that is modest, but relatively stable and there has been a clear trend towards improvement since 2011.
To refine the analysis, we analyse the balance of goods exports, distinguishing between energy and non-energy goods (Exhibit 5 and Exhibit 6). This breakdown makes it possible to determine that the five economies examined have a structural deficit in energy products of around 3% of GDP (slightly less in the case of the Netherlands) as a result of net fuel imports. Apart from this component, which is unlikely to change significantly in the medium term, the really important issue for a country’s commercial competitiveness –and that of its businesses– is how net non-energy goods exports behave.
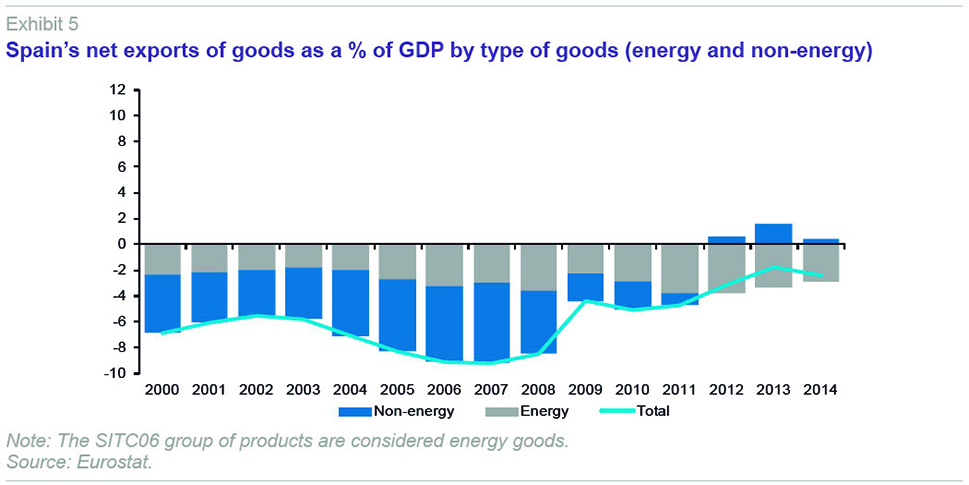
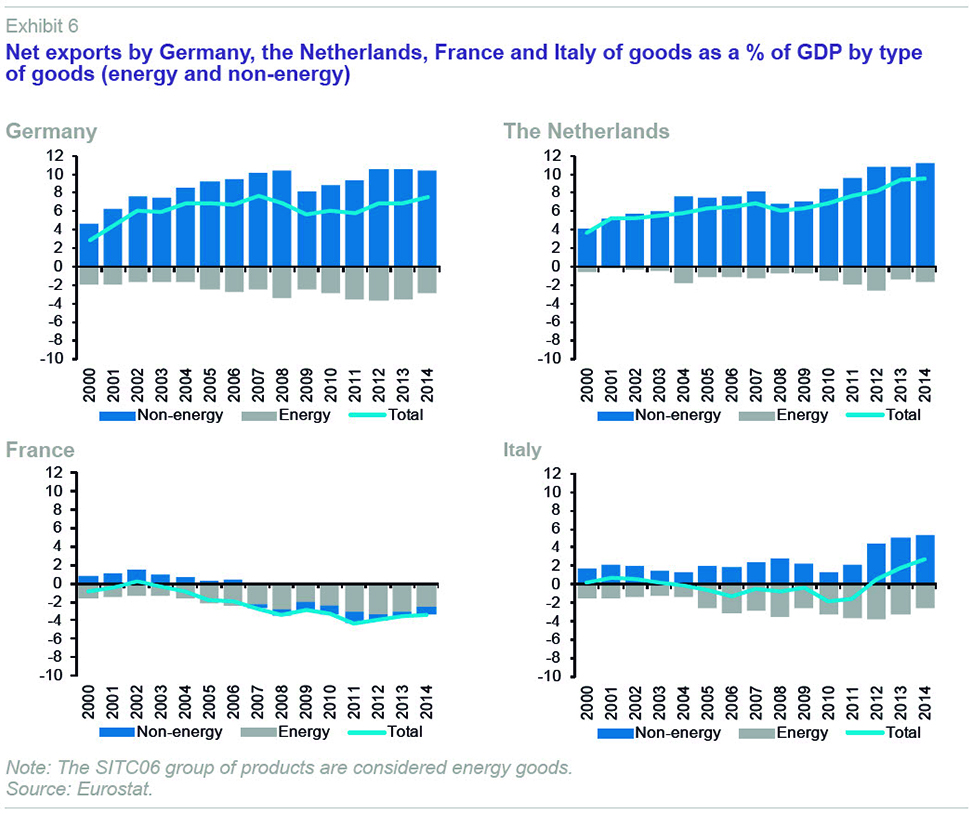
In this regard, Exhibit 5 and Exhibit 6 allow us to conclude that Spain’s situation is not only a long way from that of the leading exporters –Germany and the Netherlands– but also from that of Italy. In particular, from 2011 to 2014, Germany and the Netherlands had a non-energy trade surplus with the rest of the world of over 10%, Italy ran a surplus of around 5%, while Spain’s maximum was 1.6% of GDP in 2013, dropping to 0.5% the following year (the last in the series). The difference between these balances gives an idea of how far Spain has to go in order to obtain an external sector with a share of GDP comparable to that of the other large European economies.
Microeconomic analysis
In many ways, two small businesses from two different countries have a lot more in common than two businesses of very different sizes from the same country.
In particular, in the field of internationalisation, the analysis by Barba Navaretti et al. (2010) shows that the differences in intensity of foreign activity by Spanish and German firms are relatively small in the case of large firms (over 250 employees). However, in the case of smaller firms (fewer than 20 workers), German firms are much more active abroad than are their Spanish counterparts.
These findings are in line with those of Correa-López and Doménech (2012) based on the Encuesta sobre Estrategias Empresariales [Business Strategy Survey]. In particular, Correa-López and Doménech (2012) find that the percentage of exporting firms –another complementary measure of export activity– increases significantly with firm size. Thus, while approximately 25% of Spanish businesses with fewer than 20 employees export, more than 90% of firms with more than 200 employees do so.
It is therefore necessary to understand the business structure underlying the international expansion of the Spanish economy. Exhibit 7.a shows Spanish exporters grouped by size and type of export activity. Exhibit 7.b shows the concentration of Spain’s total exports according to these parameters. The exhibit divides exporting firms into three groups according to ICEX nomenclature: small exporters,
i.e., those with exports of less than 50,000 euros a year; large and frequent exporters,
i.e., those with exports of more than 50,000 euros a year and which have been exporting over the last four years; and, finally, large but occasional exporters,
i.e., firms with exports of more than 50,000 euros a year, but which have not exported continuously over the last four years.
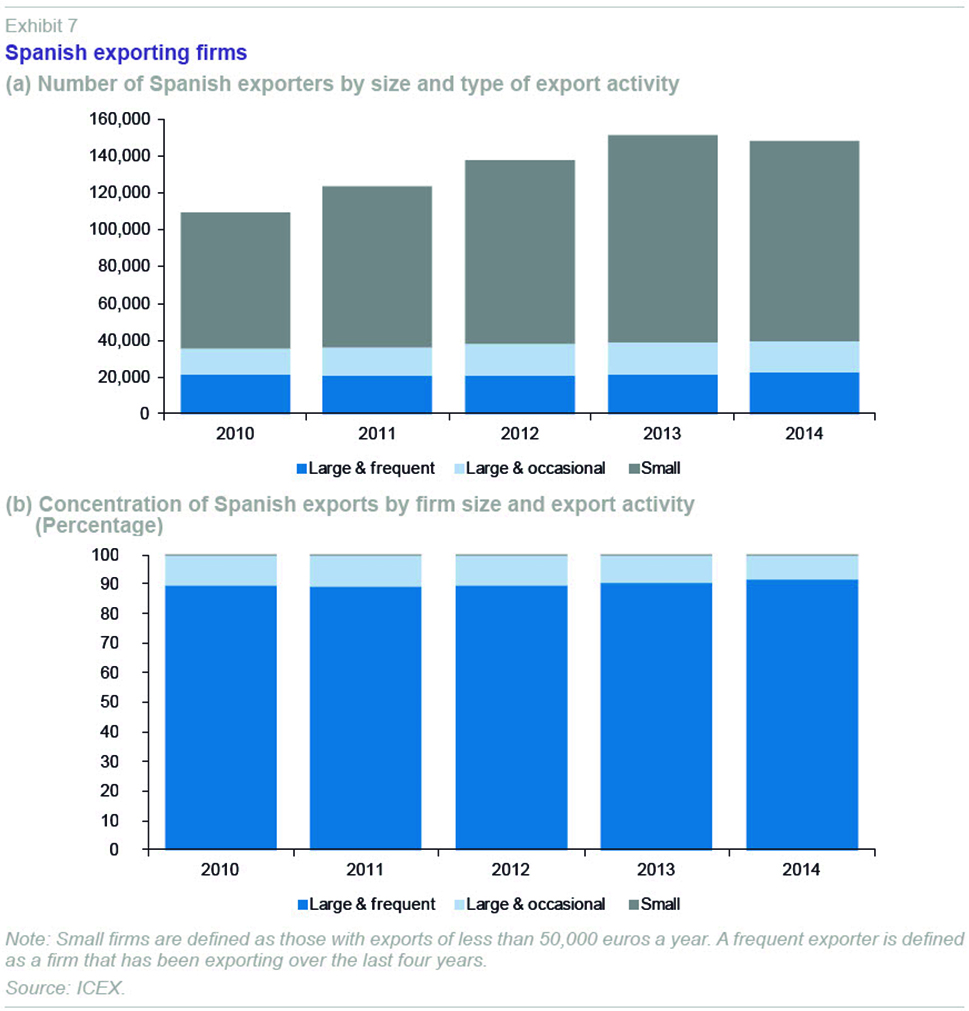
Firstly, the group gaining most firms between 2010 and 2014 was that of small firms, which grew by 46% from 74,000 to 108,000. This group of firms, referred to as the base of the Spanish business pyramid (Xifré, 2014), is important because in many cases these are firms with a sound business project that are starting to export, and may turn into regular exporters.
However, in terms of their contribution to total exports, as Exhibits 7.a and 7.b clearly show, although large, frequent exporters make up just 15% of all exporting firms, they account for 90% of Spain’s exports by volume. Indeed, the group of large, regular exporters grew by just 6.7% between 2010 and 2014, from 21,237 to 22,654.
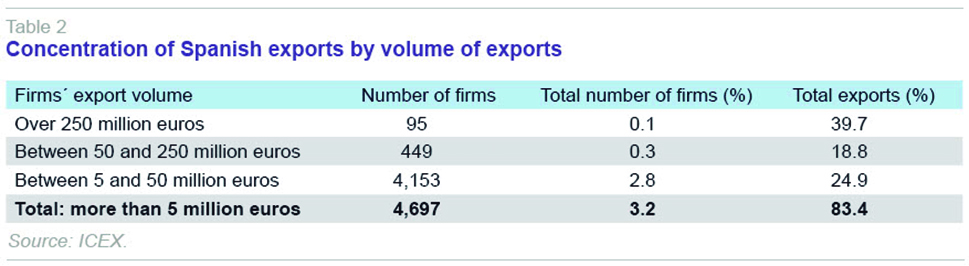
Table 2 gives additional information on the degree of concentration of Spanish exporters. At the tip of the export pyramid there are 95 firms with exports of more than 250 million euros a year. This select group of companies represents just 0.1% of the census of export businesses, but generates 40% of Spain’s total exports. Taking all the firms with exports of over 5 million euros into account, although the group comprises less than 5,000 operators, they are responsible for 80% of total exports.
Although in all countries export activity is usually concentrated in just a few companies (Bernard et al., 2012), and although there is no methodologically comparable information on concentrations in other economies, these data suggest that Spain’s export business base has considerable scope for growth and improvement. It is therefore worth studying specific measures to support it, based on an understanding of the specific features of the process of international expansion among small firms.
Conclusion: International best practices
A review of European Commission studies on the topic (European Commission, 2007 and 2008) and contributions from other sources (OECD, 1997; USAID, 2004; NESTA, 2011) allows for the identification of a number of international best practices on stimulating international expansion at the base of the business pyramid (for more information on the specific case of Spain, see Xifré, 2014).
- The most effective means of promoting internationalisation is through individually tailored support to firms. International studies clearly highlight that the most effective strategies for supporting international expansion are those tailored to each firm. This is largely due to the dynamic and highly specific nature of the obstacles each exporting firm has to overcome in order to expand internationally.
- It is advisable for firms to network and build alliances. This means the goods and/or services that firms offer can complement one another so as to offer the target market or customer a higher value product and service experience. This is also a way of achieving the commercial critical mass necessary to participate in certain international projects or invitations to tender.
- There is a strong link between internationalisation and innovation, and more generally, competitiveness. It is therefore preferable for firms to address the internationalisation process as part of a wider strategy aiming to boost business competitiveness. This idea is also relevant to the organisation of public activities to support firms’ internationalisation and suggests that multidimensional agencies are preferable to raise competitiveness, focusing on innovation, entrepreneurship, business growth, etc.
- Companies need to fully take advantage of the potential of information and communications technologies (ICTs) and other new technologies to stimulate internationalisation. Best practices examined show that ICTs can play two important roles in catalysing this process: they can support communications networks, and enable market prospecting, information and contacts with foreign partners. Technologies of this type have also been found to be highly cost effective.
References
BARBA, G.; BUGAMELLI, M.; OTTAVIANO, G., and F. SCHIVARDI (2010), “The Global Operations of European Firms,” Bruegel Policy Brief, 2010/05.
BERNARD, A. B; JENSEN, J.; REDDING, S. J., and P. K. SCHOTT (2012), “The Empirics of Firm Heterogeneity and International Trade,” Annual Review of Economics, 4: 283-313.
EUROPEAN COMMISSION (2007), Supporting the internationalisation of SMEs, Final Report of the Expert Group, DG Enterprise and Industry.
— (2008), Supporting the internationalisation of SMEs. Good practice selection, DG Enterprise and Industry.
CORREA-LÓPEZ, M., and R. DOMÉNECH (2012), La Internacionalización de las Empresas Españolas, BBVA Research, Documento de Trabajo 12/29.
GARCÍA-CANAL, E. (2013), “The international expansion of Spanish firms: Strengths and weaknesses,” Spanish Economic and Financial Outlook, 2(6).
MYRO, R. (2013), “La política de internacionalización de la empresa española,” Economía Industrial, 387 (2013): 119-130.
NESTA (2011), Barriers to growth. The views of high-growth and potential high-growth business, Research summary, November 2011.
OECD (1997), Small Business, Job Creation and Growth: Facts, Obstacles and Best Practices.
USAID (2004), Best Practices in Export Promotion, Technical Report submitted by Nathan Associates Inc. to USAID.
XIFRÉ, R. (2014), “La internacionalización en la base de la pirámide empresarial española: análisis y propuestas,” Documento de Trabajo 189/2014, Fundación Alternativas.
Ramon Xifré. ESCI – Universitat Pompeu Fabra and Public-Private Research Center, IESE Business School