Changes in the structure and composition of public-sector employment during the crisis
Following a period of growth from 2007-2011, public sector employment cuts, in part driven by fiscal consolidation efforts, brought employee levels back in line with pre-crisis levels. The reduction, however, was mainly achieved through job losses affecting staff on temporary contracts, while the number of open-ended contracts actually increased, posing future policy challenges related to the cyclical or structural nature of the policies implemented and also related to securing an adequate provision of public services.
Abstract: This article analyses the evolution of public-sector employment in Spain during the crisis, taking into account the impact of recent fiscal consolidation measures. Specifically, changes in the structure and composition of public-sector employment between 2007 and 2014 are examined, broken down by level of government, branch of activity, and type of employment contract. Furthermore, the impact of recent legislative changes in this area are assessed. Our findings show that while there were public-sector employment cuts in 2012-13, these follow a period of growth in public-sector employment between 2007 and 2011, such that the number of public-sector employees in 2014 was similar to that in 2007. The impact of the cuts, however, was mitigated by the general increase in the working week, with an increase in the number of hours worked. In 2014 compared to 2007, there was an increase in the number of public-sector employees in the autonomous regions, the health and social services sectors, and in the number of employees on open-ended contracts. By contrast, the number of staff in other areas of the public administration fell, along with the number of staff in education and the number of employees on temporary contracts.
[1]
Introduction
Government is a major player in labour markets in OECD countries, employing an average of 15%-20% of the economy’s total workforce.
[2] The role of public-sector employment is particularly important in sectors associated with the provision of public goods and services that governments often supply to society quasi-monopolistically (such as justice or defence) and in relation to those public services traditionally associated with the welfare state (education, health, social services).
As part of the fiscal consolidation underway in recent years, many European Union (EU) countries, including Spain, have reviewed the function and structure of their general government expenditure. In particular, this has included measures affecting government salaries and staffing levels.
[3]
This article explores the trends in government employment in Spain
[4] over the course of the crisis and the recent process of fiscal consolidation. Our analysis of this process focuses in particular on the changes in the structure and composition of public-sector employment broken down by level of government, type of contract, and branch of activity. We also present evidence on the role the various measures approved to correct the government deficit may have played, particularly since 2011. The article does not, however, address other important issues, such as the links between government employment and the efficiency with which public goods and services are delivered. Nor does it discuss the public or private provisions of public goods and services, or the evaluation of the observed or desirable design of government salary and staff policies. There is abundant specialised literature focusing on analysing public sector efficiency, the management of public sector employment, and the broader question of the “quality of public expenditure” in general. See, for example, López Casasnovas (2010), González Páramo and Onrubia (2003), Afonso, Schuknecht and Tanzi (2005) or Hernández de Cos and Pérez (2015).
We have used data from the
Labour Force Survey (LFS), published quarterly by the National Statistics Institute (INE), to measure the number of employees working in the public administration in Spain.
[5] Despite the various changes in methodology and base, the INE provides uniform linked series since 1987, which allows this study to take a broader perspective. Additionally, the availability of individual LFS microdata enables the discussion and analysis to be enriched, particularly, as we shall see, when analysing the impact of recent budgetary consolidation measures. Other statistical sources exist for the number of government employees, in particular national accounts, published by the INE, and the central register of government staff, published by the Ministry of Finance and Public Administration. Compared with the national accounts, the LFS has the advantage that it is published quarterly rather than annually, and it is more up-to-date than the national accounts, which tend to be published with a significant time lag.
[6] The LFS also gives fuller coverage of employment in the public administration than does the register of government staff.
The main findings of our analysis are as follows. Firstly, the measures to curb public-sector employment implemented in 2012-2013 were implemented after a period of expansion in 2007-2011, such that the number of public-sector employees in 2014 was similar to that in 2007. The number of hours worked was greater in 2014 given the general increase in the working week, which was extended from 35 hours to 37.5 hours across government as a whole over the period examined. Over the period 2007-2014, there was an increase in the number of public-sector employees in the autonomous regions, the health and social services sectors, and those on open-ended contracts. By contrast, the number of staff elsewhere in the public administration fell, along with the number of staff in education and the number of employees on temporary contracts.
The remainder of this article is organised as follows. The next section analyses the characteristics of changes in public-sector employment during the crisis and in the recent period of budgetary consolidation. Subsequently, we focus on the impact of the main adjustment measures adopted regarding general government employment, which have driven these changes. Finally, we offer some concluding remarks.
Evolution of public-sector employment over recent decades and during the crisis
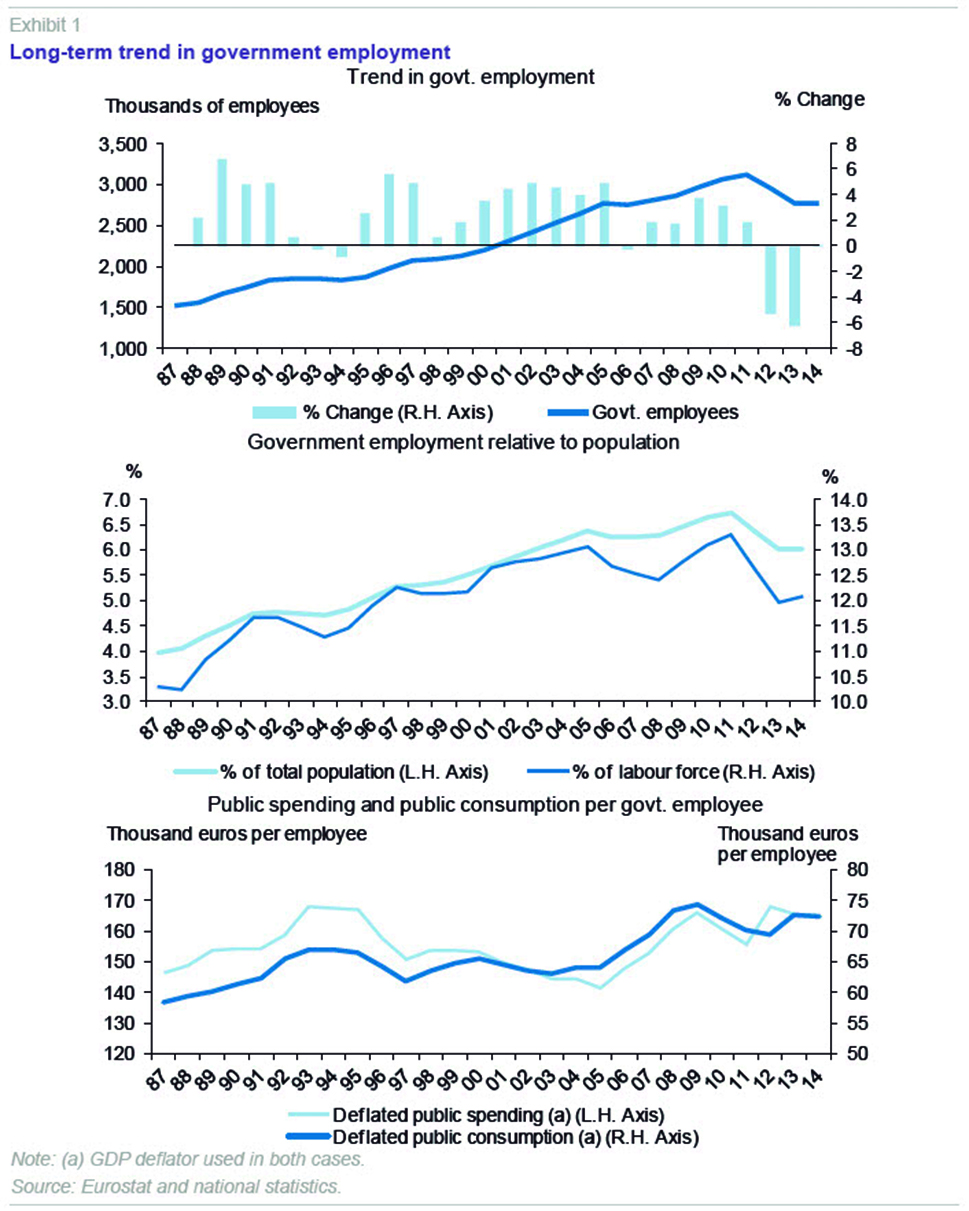
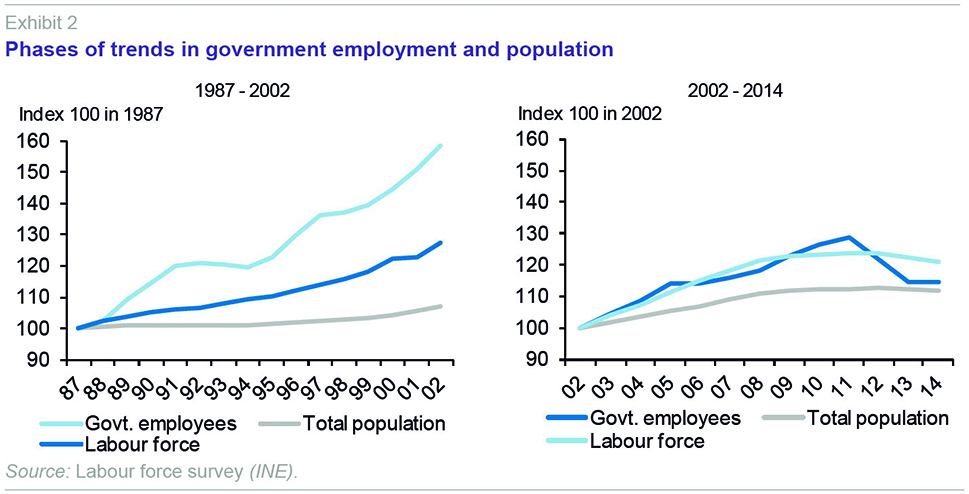
From a historical perspective, according to the LFS, the number of government employees grew almost continuously from 1987, outpacing growth in both the population and the labour force, with particularly rapid growth in the early 2000s (see Exhibits 1 and 2). Thus, the number of employees rose from 1.5 million in 1987 to 3.1 million in 2011, with a slight reduction in public-sector employment in just three years during this period (1993, 1994 and 2006). This process, associated in particular with the expansion of the welfare state, public services, and transfers of powers to the autonomous regions, began to be reversed in 2012, within a general process of consolidation of the public accounts. Therefore, between 2011 and 2014 the number of public-sector employees fell by around 345,000 and the share of the total working population employed in the public sector dropped from 13.3% in 2011 to 12.1% in 2014. This process brought the number of public-sector employees to close to 2.8 million in 2014, which is slightly (1.3%) below the level in 2007. It is worth noting that from an international perspective, the size of general government in Spain, in terms of direct employment, is similar to that in comparable countries, although below the average.
[7]
The recent period of public-sector employment restraint was preceded by a number of years of widespread increases. The expansion in government employment in the period 2007-2011 was led by the autonomous regions (see Exhibit 3), whose staff levels peaked in 2011 (1.8 million employees), with cumulative growth over the period exceeding 15%. Thus, the adjustment in 2012-2014 partly offset the increase in previous years, such that the number of employees working for the autonomous regions in 2014 was 1.7% higher than in 2007. In the case of the central government, the Social Security system and local authorities, the adjustment in employment between 2012 and 2014 led to a net reduction in staff levels of 1.3% and 4.5%, respectively, compared to 2007. Thus, over the three years as a whole, total public-sector employment fell by slightly more than 11%, the autonomous regions accounting for 70% of this reduction, the Social Security system 17%, and local authorities 13%. The drop was concentrated in the period 2012-2013, with zero growth in public-sector employment in 2014 in aggregate terms.
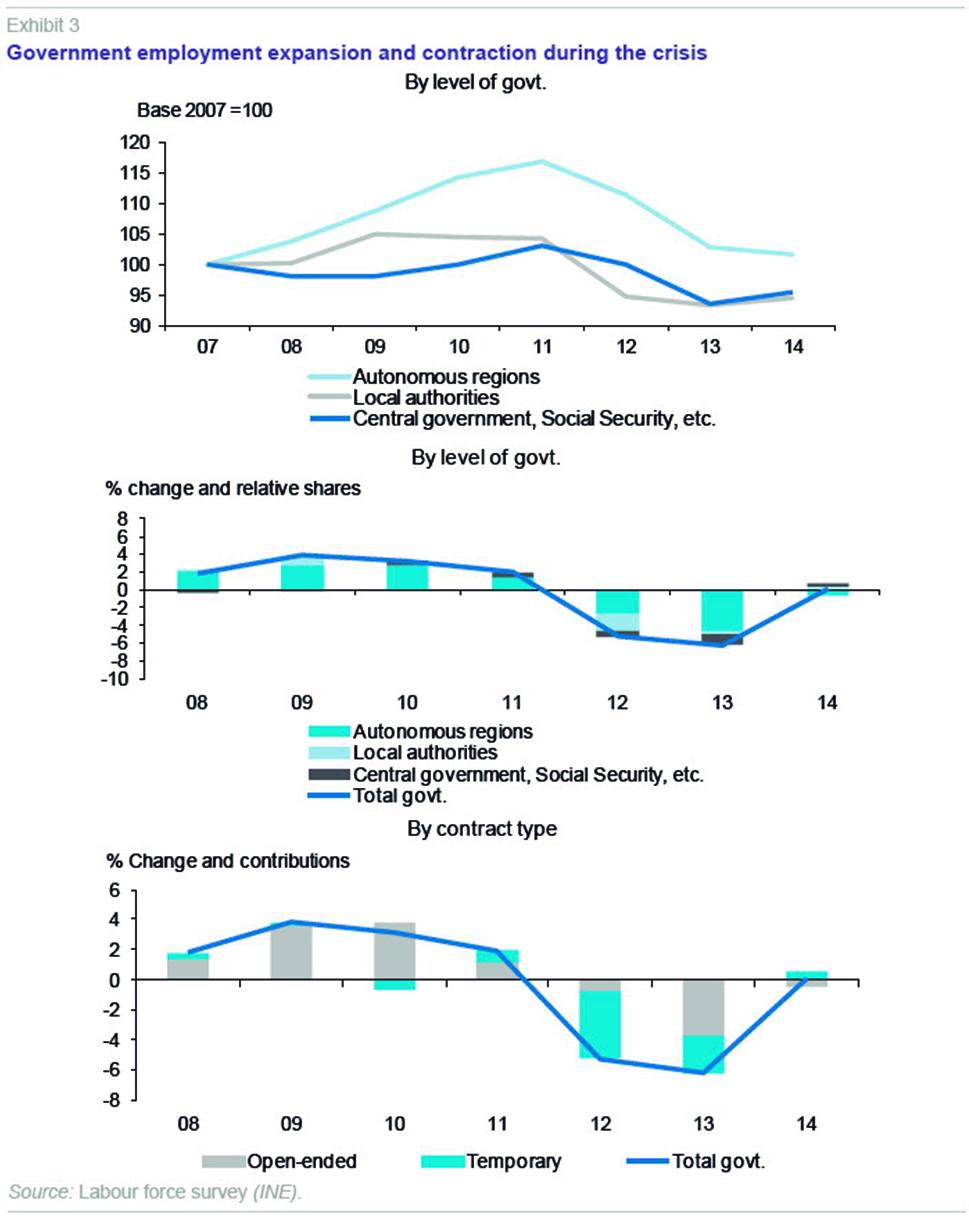
The sharp adjustment in employment seen in 2012 and 2013 mainly affected temporary workers, although the number of employees on open-ended contracts also contracted in 2013 (see Exhibit 3). Given that temporary employment accounted for slightly more than 25% of the total, this pattern of adjustment means caution is needed before interpreting it as irreversible, the reduction in public-sector employment during the crisis being cyclical as well as structural. Thus, there were more employees on open-ended contracts in 2014 than in 2007 (slightly more than 140,000 staff), while the number of temporary employees fell by almost 25% since 2007, equivalent to a reduction in the workforce of slightly more than 175,000 between 2007 and 2014.
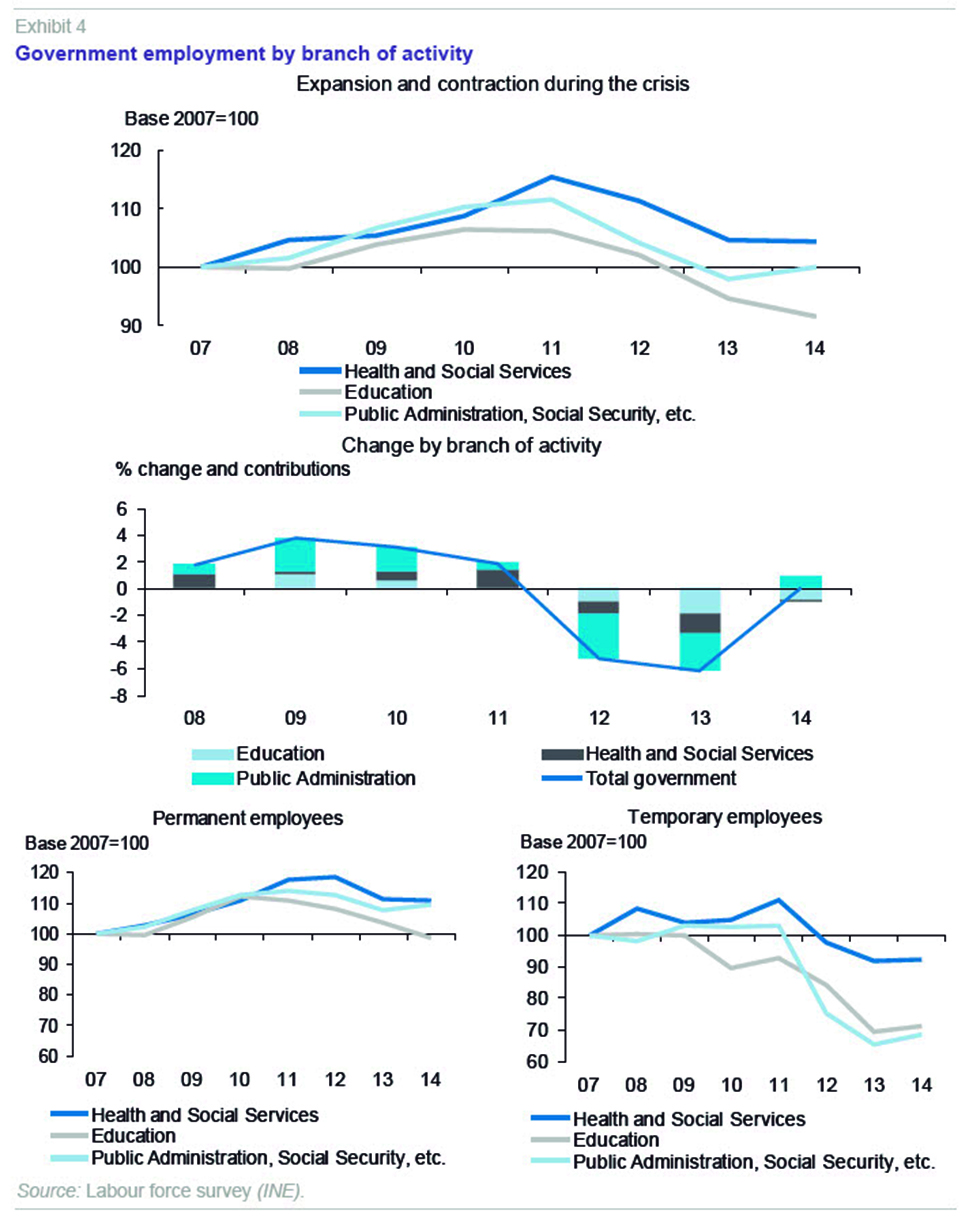
By sectors of activity, public-sector employment as a whole in all branches (education, health and social services, public administration and Social Security) fell in 2012 and 2013 (see Exhibit 4).
[8] The biggest contribution was from the public administration and Social Security branch, which, had increased considerably during the initial expansion phase (2007-2011), however, such that throughout the entire duration of the crisis, the number of employees remained practically constant. The number of employees in health and social services, on the other hand, increased in net terms in 2007-2014, given that the significant adjustment in 2012-2014 (-10%) was insufficient to offset the initial increase (15% between 2007 and 2011). Education was the only branch that experienced a reduction in the workforce during the crisis, losing slightly more than 8.5% of its employees.
Government channels the provision of certain goods and services through public-sector enterprises. In the national accounts, public-sector enterprises are classified as being outside the public administration sector, and are defined as legal entities owned or controlled by these administrations, and which produce most of their goods and services with a market orientation at economically significant prices. According to the LFS, public-sector enterprises in Spain employed approximately 150,000 people in 2014, mainly in the transport, postal services and communications branches. In recent years, employment in public-sector enterprises could, in general terms, be characterised as evolving in the opposite direction to employment in the public administration sector: net job losses of 14.0% between 2006 and 2010, followed by an increase of 11.5% between 2010 and 2013. In 2014, the 8.7% reduction in the number of employees brought employment in public-sector enterprises back to 2005 levels. Employment in public-sector enterprises as a share of total public sector employment (defined as the aggregate of public-sector enterprises and government), has remained around 5% throughout the period.
The impact of consolidation measures
The policies on staff serving the public administration are determined on a discretionary basis by the various levels of government within their areas of competence. Therefore, the change in the number of public-sector employees during the crisis and the process of fiscal consolidation we have described in the previous section has been determined by economic policy measures. As early as 2008, the various levels of government began to implement measures to restrict recruitment by the public administration, in particular by gradually curtailing the possibility of replacing staff and imposing tighter restrictions on temporary contracting. Since 2011, however, the need to control the public deficit led to the implementation of an even stricter package of measures.
[9] In 2013, in parallel, the report on public administration reform (CORA report) established improving public administration efficiency, including a set of measures on public employment, as one of its three pillars of action.
[10]
Although the aggregate impact of the corrective measures is visible in the evolution of the main public administration employment aggregates in 2012 and 2013, it is difficult to isolate the specific effects of each of the particular measures.
[11] For this reason, we set out below some additional anecdotal evidence on the impact of two measures affecting public-sector employment taken in late 2012: the restrictions on new recruitment, and the extension of the working week to thirty seven and a half hours.
Restrictions on new recruitment
The measures in Royal Decree-Law 20/2011 of December 30th, 2011, on urgent budgetary, tax, and financial measures to correct the public deficit, included a ban on the public administration’s recruiting new staff, except in exceptional circumstances, and a freeze on filling posts left vacant by staff retiring, except in those cases where a replacement rate of 10% was set. This tightened up the conditions for replacing staff, beyond the restrictions already introduced by the legislation in previous years. It is therefore to be expected that this new measure would mean that there would be less recruitment of government employees than in previous years, assuming that the number of people retiring remained similar. It is worth asking, therefore, whether these restrictions implemented since 2009, although with varying degrees of intensity, had an effect on the age profile of government employees.
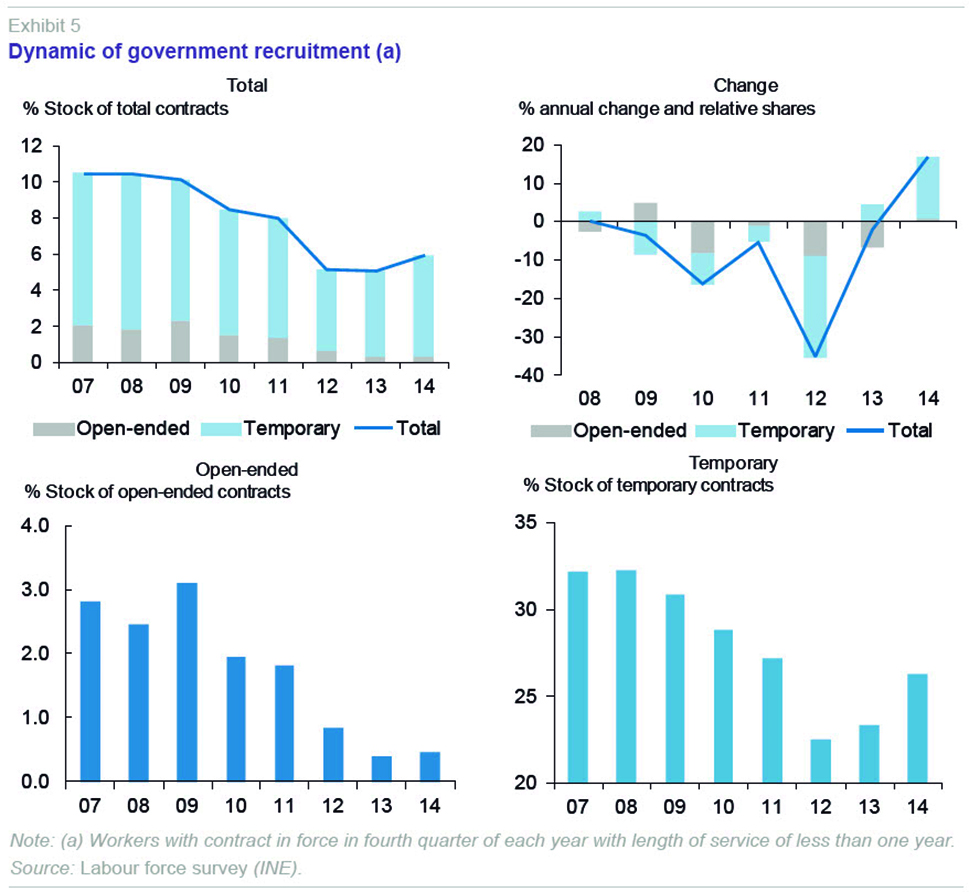
The number of employees in the last quarter of each year who have been working for the government for less than 12 months was used as a proxy for government recruitment (see Exhibit 5). The share of the total these new contracts represent in the fourth quarter has declined considerably since 2010, in the case of both open-ended and temporary contracts. This trend gained pace in 2012, with a year-on-year drop of more than 35%. In 2013 and 2014, on the other hand, recruitment of temporary workers recovered, while the number of new open-ended contracts fell in 2013 and remained stable in 2014.
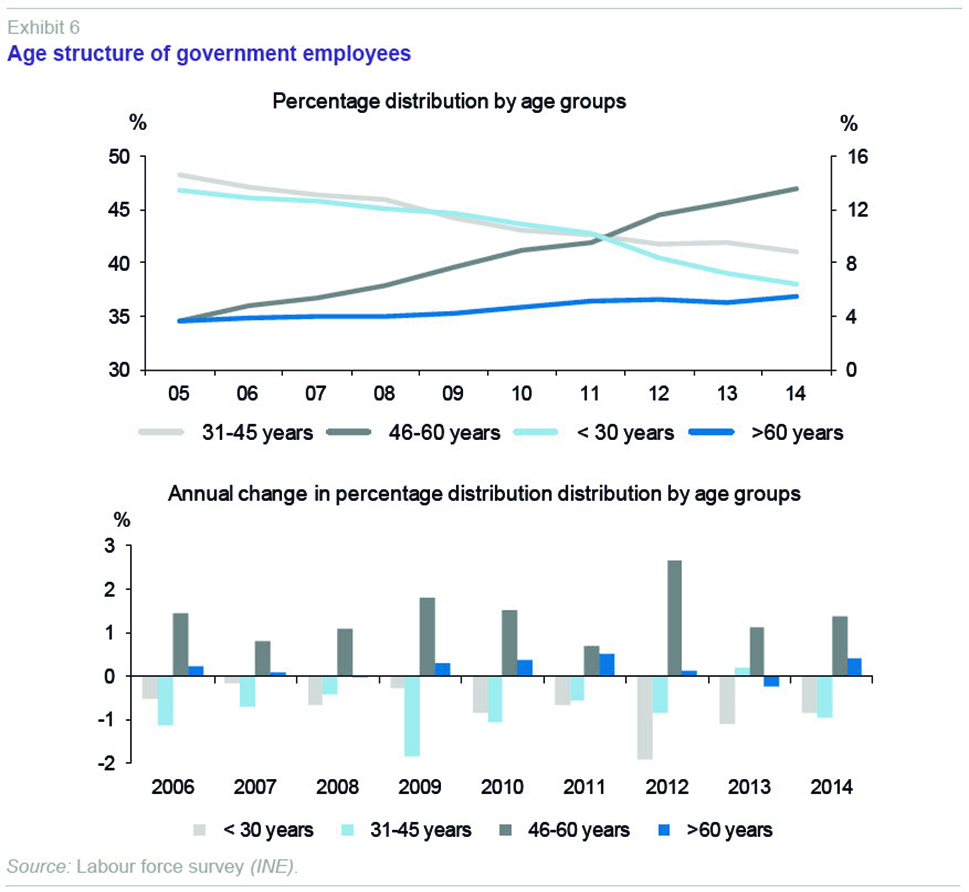
It could therefore be argued that it is likely that the tighter restrictions on recruitment have accentuated the existing trend towards a higher average age of public-sector employees, as new recruits tend to be younger than the stock of government employees. Indeed, over the years, a decline in the percentage of employees aged under 45 has been observed, with the 46-60 year old group increasing. However, this phenomenon seems to form part of a longer-term trend (see Exhibit 6). This issue requires more thorough analysis, in particular considering the transitions of workers between age brackets and towards retirement, and its determinants.
Measures to increase the number of hours worked
Together with tighter restrictions on recruitment, Royal Decree-Law 20/2011 extended state public-sector working hours from thirty-five to thirty-seven and a half hours a week, on an average annualised basis. Subsequently, Royal Decree-Law 20/2012, of July 13th, 2012, enacted a series of additional measures relating to the hours worked by public-sector employees.
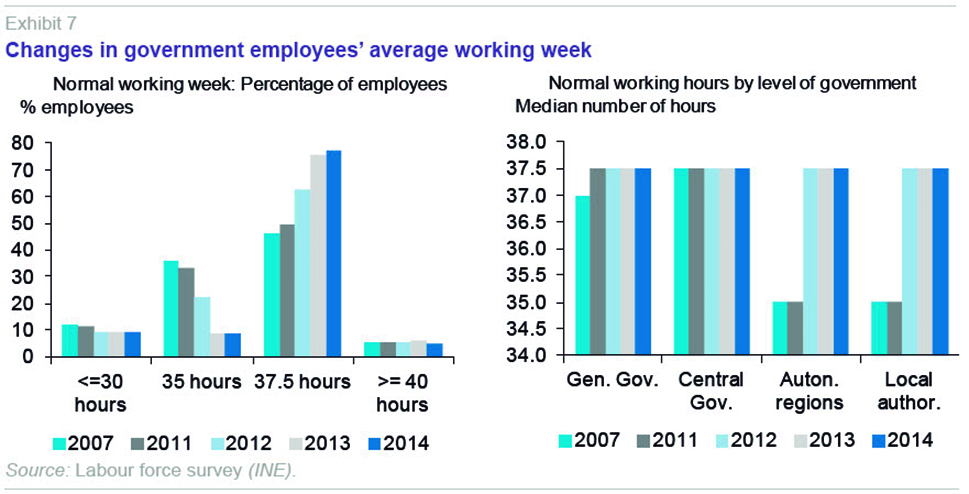
These measures have had a visible impact on the normal working hours of public-sector employees, where there has been a genuine change in the working week from thirty-five to thirty-seven and a half hours (see Exhibit 7). The number of employees with a normal working week of thirty-seven and a half hours represented approximately 45% of total in 2007. This share rose to 75% in 2014, while the share of employees with a normal working week of thirty-five hours has fallen from 36.1% in 2008 to 8.6% in 2014. These changes have affected employees on both open-ended contracts and temporary contracts. Broken down by levels of government, the normal working hours at the central government level were already thirty-seven and a half hours before the crisis, while the autonomous regions and local authorities have converged to this figure since 2012.
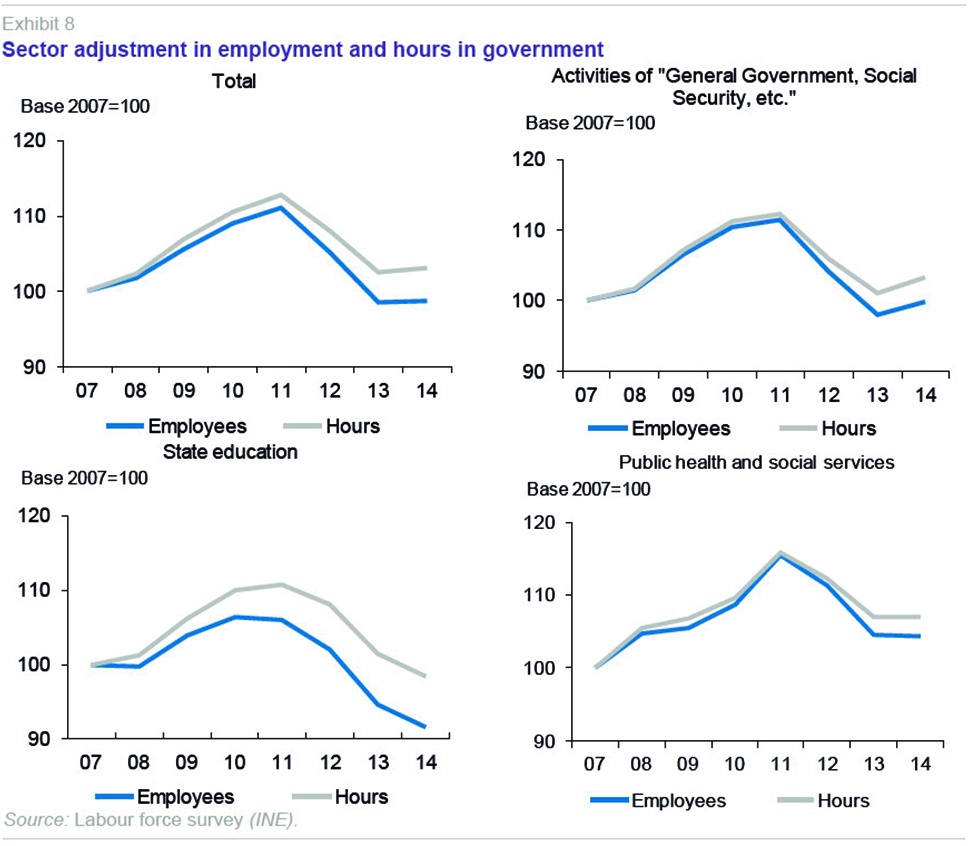
The increase in the number of hours per worker has made it possible to mitigate the effects of the reduction in the total number of government employees observed in 2012 and 2013 (see Exhibit 8). Thus, the total number of hours worked by government employees in 2007-2014 (calculated as the number of hours worked per employee multiplied by the number of employees) has remained above 2007 levels, although between 2011 and 2013 it dropped by 9.1%, and then remained fairly stable in 2014. By sectors, the effect has been particularly significant in public education, given that the total number of hours worked by employees in the sector was 1.6% less in 2014 than in 2007, a significantly smaller drop than the 8.5% reduction in the number of employees.
Concluding remarks
Two phases can be distinguished in the evolution of public-sector employment in Spain during the recent crisis. Firstly, between 2007 and 2011, the government as a whole increased its workforce in both absolute terms and relative to the population and the labour force. In the second phase, starting in 2012, the fiscal consolidation process led to a significant correction in public-sector employment, such that between 2007 and 2014 the number of employees working for the public administration was reduced by approximately 35,000.
This reduction was mainly due to net job losses affecting staff on temporary contracts, as there was an increase in the number of staff on open-ended contracts of 140,000. This poses challenges for the future as regards the cyclical or structural nature of the policies implemented, in particular if bottlenecks or shortcomings are detected in the provision of certain public goods and services.
It is also worth noting that, in aggregate terms, the number of hours worked by government employees increased between 2007 and 2014, as the average working week went from 35 hours before the crisis to 37.5 hours after the crisis. Over this period, moreover, there was an increase in the share of public-sector employees in the autonomous regions, the health and social services sectors, and those on open-ended contracts.
Notes
The opinions in this article are solely those of the authors and do not necessarily reflect the views of the Bank of Spain or the Eurosystem. This article updates and complements the work done in Montesinos, Pérez and Ramos (2014).
See Montesinos, Pérez and Ramos (2014) for a cross-country comparison of levels of public-sector employment in the OECD.
See, for example, Pérez et al. (2015), Gaudillat (2014) or Demmke and Moilanen (2010).
Title II of Law 7/2007 of April 12th, 2007, on the Basic Statute of Public Employment establishes the categories of government employees. These are: (a) career civil servants; (b) interim civil servants; (c) contract staff (whether permanent, open-ended or temporary contracts); and (d) temporary staff.
See Montesinos, Pérez and Ramos (2014) for a discussion of the various different statistical sources available in Spain to study the role of government as an employer.
At the time of writing, the most recent data available refer to 2009.
On this point, see Montesinos, Pérez and Ramos (2014).
The education branch includes wage earners in section 85 of the 2009 National Classification of Economic Activities (CNAE) and the health and social services branch in sections 86, 87, 88 and 75. Other public administration employees are included in the public administration and Social Security branch, which primarily includes section 84 of CNAE 2009. For data prior to 2008, a comparable classification (CNAE 1993) was used.
In particular, the measures contained in Royal Decree-Law 20/2011 of December 30th, 2011, on urgent budgetary, tax, and financial measures to correct the public deficit, and Royal Decree-Law 20/2012 of July 13th, 2012, on measures to ensure budgetary stability and stimulate competitiveness.
See Montesinos, Pérez and Ramos (2014) and Ministerio de la Presidencia (CORA report, 2012) for a description of the main measures affecting government employment enacted in recent years, with particular emphasis on measures enacted since late 2011.
The CORA report offers some estimates of the fiscal savings deriving from the various measures taken from 2012 onwards. However, it does not give any details about the methods used in its preparation and to obtain these budgetary impacts. See also Montesinos, Pérez and Ramos (2014) for a discussion and simple estimate of the impact on public-sector employment of the limitation on the staff replacement rate based on microdata from the Muestra Continua de Vidas Laborales [Continuous Working Lives Sample] (MCVL).
References
AFONSO, A.; SCHUKNECHT, L., and V. TANZI (2005), “Public sector efficiency: An international comparison,” Public Choice, 123: 321-347.
DEMMKE, C., and T. MOILANEN (2010), “Civil Services in the EU of 27. Reform Outcomes and the Future of the Civil Service,” Ed. Peter Lang GmbH, Frankfurt am Main.
GAULLIAT, P. (2014), “Spending reviews in the EU: methodologies and objectives,” presented in the 8th Meeting of the Network of Public Finance Economists in Public Administration, organised by the European Commission (DG ECFIN), 11 February, Brussels.
GONZÁLEZ PÁRAMO, J. M., and J. ONRUBIA (2003), “Información, evaluación y competencia al servicio de una gestión eficiente de los servicios públicos,” Papeles de Economía Española, 95: 2-23.
HERNÁNDEZ DE COS, P., and J. J. PÉREZ (2015), “El impacto de los salarios y el empleo público. Una perspectiva macroeconómica”, Presupuesto y Gasto Público, forthcoming.
LÓPEZ CASASNOVAS, G. (2010), “La calidad del gasto público y su influencia en el desarrollo económico: una validación empírica para los países de la OCDE 1970-2005”, Hacienda Pública Española, 193: 9 - 48.
MINISTERIO DE LA PRESIDENCIA (2012), “Informe sobre la Reforma de las Administraciones Públicas (CORA).”
MONTESINOS, A.; PÉREZ, J. J., and R. RAMOS (2014), “El empleo de las Administraciones Públicas en España: caracterización y evolución durante la crisis,” Documentos Ocasionales, Bank of Spain, No 1402.
PÉREZ, J. J.; RAMOS, R.; AOURIRI, M.; CELOV, D.; PESLIAKAITÉ, J.; CAMPOS, M. M.; DEPALO, D.; PAPAPETROU, E., and M. RODRÍGUEZ-VIVES (2015), “The government wage bill and the crisis in the EU,” mimeo, WGPF-ESCB.
Antonio Montesinos, Javier J. Pérez and Roberto Ramos. Bank of Spain