
Analysing differences in bank profitability: Europe versus the US
The trend in US and European bank profitability has diverged over the last few years, with US banks consistently more profitable and better capitalised than their European counterparts. While financial institutions on both sides of the Atlantic are becoming more resilient, it is not certain whether 2019 stress tests will help boost confidence in the banking industry.
Abstract: Financial institutions in both the US and eurozone have had to contend with challenges including a flattening yield curve and more stringent capital requirements. In 2009, the spread between long- and short-term government bond yields stood at four percentage points in both the eurozone and the US. That spread has since narrowed to within one percentage point in the US and two percentage points in Europe, making it hard to generate net interest income. Nevertheless, US banks have proven more resilient, with average RoE virtually twice that reported by EU financial institutions. These differences can be attributed to a multitude of factors including a more robust economic recovery in the US and an uptick in US banks’ M&A activity, which has not been mirrored by EU banks. While European banks have improved their overall capital and NPL ratios, their lower levels of profitability should remain a concern. Going forward, with the next round of stress tests scheduled for this year, it remains to be seen whether new data will inspire greater confidence in the banking industry on either side of the Atlantic.
Introduction
The banking sector continues to face challenges as it makes its way back to pre-crisis profitability levels. However, the analytical timeframe used to assess banks’ progress must be taken into consideration. Specifically, bubbles and incipient markets that no longer exist may have inflated the margins posted prior to 2007.
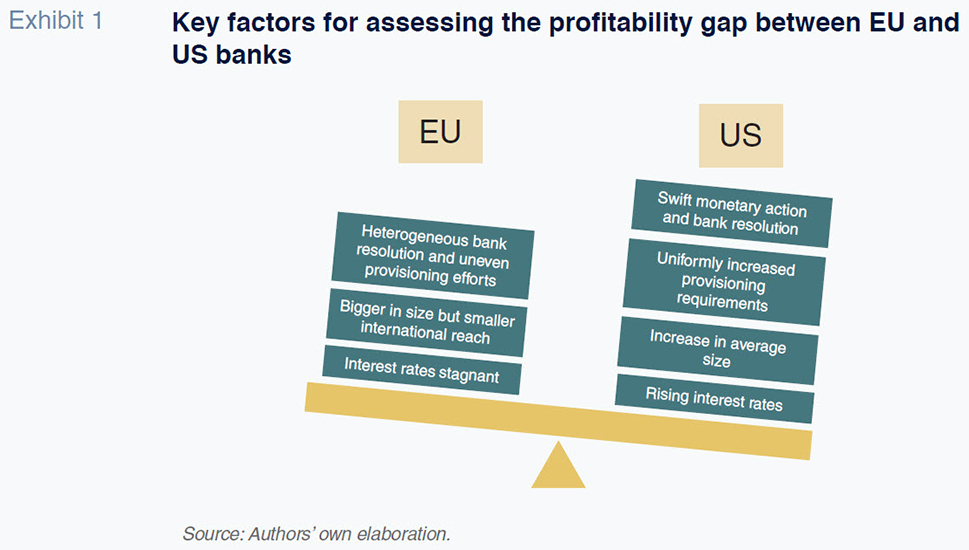
Putting these concerns aside and disregarding the fact that the generation of new business capable of boosting shareholder value is a test common to all financial entities, significant differences are evident between US and European bank profitability. Despite numerous attempts by analysts to explain these differences, it is hard to pinpoint a single underlying factor. Exhibit 1 sums up some of the main forces at work. In the US, the resolution of the crisis was swifter and more resounding in terms of monetary policy as well as toxic asset provisioning and bank bailouts - injecting both liquidity and calm into the markets. In contrast, the effort was more uneven in the EU. Quantitative easing was gradual and the provisioning requirements have been neither consistent nor sufficiently convincing for the market in several cases. As a result, ten years after the major European bank bailouts, we are still witnessing episodes of stress and uncertainty with respect to the solvency of Italian banks.
Although one of the issues identified with the resolution of failing banks was the existence of too many ‘too big to fail’ banks, the average size of financial institutions has increased. Consequently, regulators are now obliged to flag those big banks that pose systemic risk and supervise them accordingly. In general, US banks have been increasing rapidly in size (market value) through organic business growth and M&A activity. However, this pattern has not been repeated in Europe. In fact, some of the EU banks that had been relatively prominent players in the US have pared back their presence, with a few even suggesting they might exit the market altogether.
Lastly, the banking industry’s financial situation differs substantially on either side of the Atlantic. In the US, rates have already increased several times, a firm expression of the gradual rollback of the Federal Reserve’s quantitative easing effort. In the eurozone, rate hikes remain on hold. This interest gap may prove persistent over time as comments from the Federal Reserve and European Central Bank regarding the influence of a potential economic slowdown on interest rates indicate we will not see major changes for some time.
This paper analyses the differences in profitability between the banks in the EU and the US along the dimensions depicted in Exhibit 1. This requires paying particularly close attention to the messages of supervisory authorities regarding the improvement in capital adequacy and lending conditions in both regions. These messages serve as exercises in communication and transparency and are designed to reduce market concerns about banks’ ability to generate profits, their solvency and resistance to stress.
On February 1st, the European Central Bank (ECB) issued a press release outlining its “aggregate” analysis of the stress tests conducted in 2018. It is worth noting that its pool of participants was broader than previous exercises. While the European Banking Authority’s (EBA) stress tests included thirty-three eurozone banks, the ECB analysed an additional fifty-four significant entities that are under its direct supervision.
The ECB emphasised that the European banks “show improved capital basis with higher capital buffers than in 2016”, when the last comparable stress tests were performed. The average Common Equity Tier 1 (CET1) capital ratio of all 87 banks after a three-year stress period was 10.1%, up from 8.8% in 2016. The ECB also highlighted that those medium-sized banks included in the tests have become better capitalised. Under the adverse macroeconomic scenario, these banks had an average final CET1 of 11.8%, compared to 8.5% in 2016.
On January 25th, 2019, the ECB also published its supervisory banking statistics for the third quarter of 2018. That report showed that the total capital ratio (CET1 and Tier 2 capital) increased slightly as a percentage of risk-weighted assets to 17.83% in the third quarter. Additionally, the non-performing loan (NPL) ratio had trended downward to 4.17%.
The ECB noted that “average CET1 capital ratios at the participating Member State level range from 11.75% in Spain to 25.27% in Luxembourg.” It also revealed a worrisome large divergence in asset quality. Although the average NPL ratio is low, it is over 40% in Greece and is now above 10% in Italy.
The main issue from a comparative perspective with the US is the lack of uniform protection. If problems such as those affecting the Italian banks could be ring-fenced, other EU banks’ reputation and market values might remain unaffected. However, although not yet having materialised, the potential for contagion remains a key concern. This is primarily due to the incomplete state of the EU’s Banking Union, whose resources and ability to intervene still fall short of desirable levels.
The news emanating from the US strikes a different tone. The improvement in the main capital adequacy and profitability indicators (with the indicated differences to the EU) has been accompanied by a period of strong business momentum. Banks in the US have benefited from both organic growth as a result of the expanding American economy and numerous M&A transactions. However, the regulators have expressed concern about how these ongoing structural changes in the banking industry might impact the real economy. Indeed, an interesting debate emerged in February. Senator Elizabeth Warren sent a letter to the president of the Federal Reserve, Jerome Powell, suggesting that “the Board’s anaemic scrutiny of applications for mergers and acquisitions raises concerns that the Board, under your leadership, may oversee a wave of bank consolidation-to the detriment of consumers and the financial system.” Powell responded by acknowledging the importance of addressing this concern since any change in the competitive landscape could reduce small and medium sized enterprises’ access to capital.
Interestingly, the numerous European financial institutions operating in the US have not participated in the recent M&A growth in that jurisdiction. Although this matter requires more exhaustive analysis, one possible explanation is the change in business structure and the manner in which the European banks do business in comparison to the US banks. Since the crisis, some of the major European banks operating in the US have lost market share in the investment and corporate banking segments to domestic banks. Many of these European banks have been forced to shift their specialisation and refocus their core businesses on retail banking. However, the European banks core competencies and market share in the retail banking sphere is based in their home markets. It is here where some of these institutions are gradually concentrating their businesses, pulling back from the US, to the benefit of America’s dominant financial institutions.
The financial context in Europe versus the US
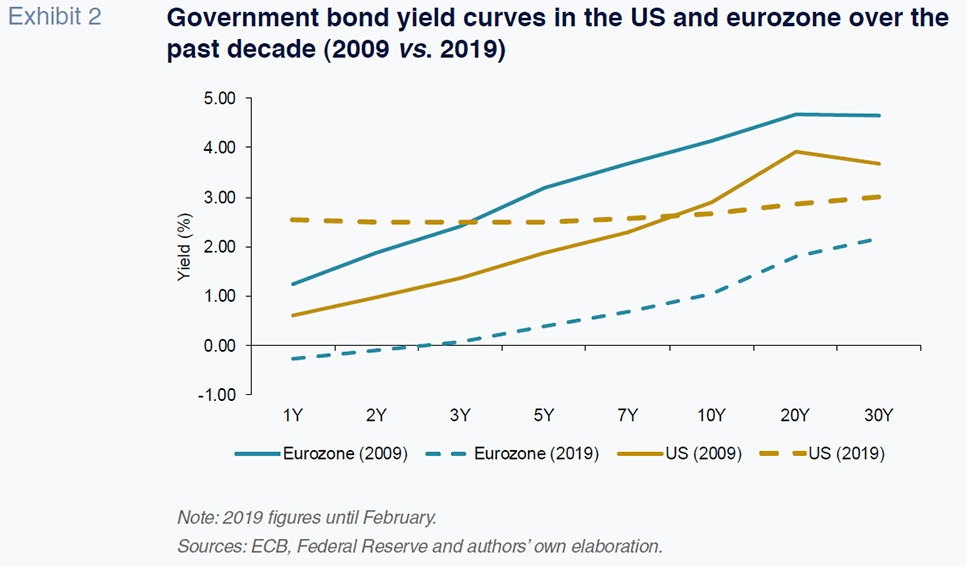
Rarely has the intrinsic link between the banking sector and monetary system been as tangible as in recent years. Quantitative easing (QE) and the subsequent abundance of liquidity have flattened the yield curve for fixed-income securities (government bonds). This means that the spread between the yields offered on short-dated bonds are barely lower than those offered on longer-dated paper. This unusual dynamic indicates a lingering uncertainty in the market and has contributed to the creation of an atypical financial context.
As shown in Exhibit 2, ten years ago, the spread between long-term and short-term bond yields was as wide as four percentage points in the eurozone and the US alike. That spread has narrowed to within one percentage point in the US and two percentage points in Europe. It is worth noting, however, that absolute rate levels have also shifted. Average yields are currently higher in the US (following the rate hikes by the Federal Reserve) than in the eurozone, whereas the situation was the opposite a decade ago. Nevertheless, it looks as if the US is resisting the 3% threshold. This would raise public borrowings costs, which would have a knock-on effect on private borrowing costs, complicating the situation for both American corporates and banks. The adjustment in the fixed-income market is likely to be gradual, given the Fed’s recent messages about the need for “patience” before embarking on new rate hikes.
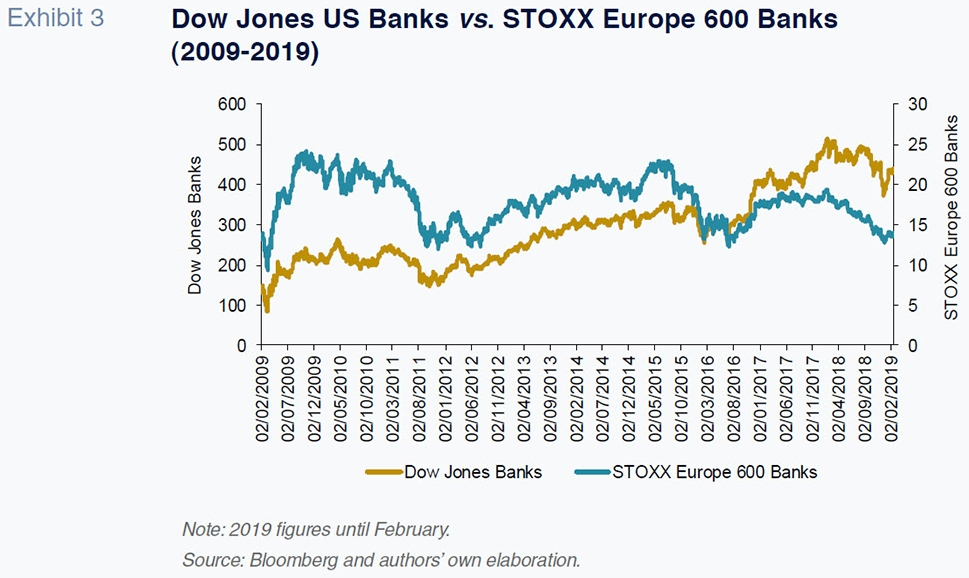
The US and EU diverge even more significantly in their respective banks’ stock market values. Exhibit 3 compares the performance of the Dow Jones US Banks and the STOXX Europe 600 Banks indices between 2009 and February 2019. Until 2015, the correlation between the two indices was considerable, albeit with the US index underperforming its European counterpart. Since then, however, the US banks have initiated a valuation gap that appears to reflect their relatively strong capitalisation and earnings momentum. The end of 2018 was a particularly bleak period for European banks’ stock prices.
A comparison of bank profitability and other indicators on both sides of the Atlantic
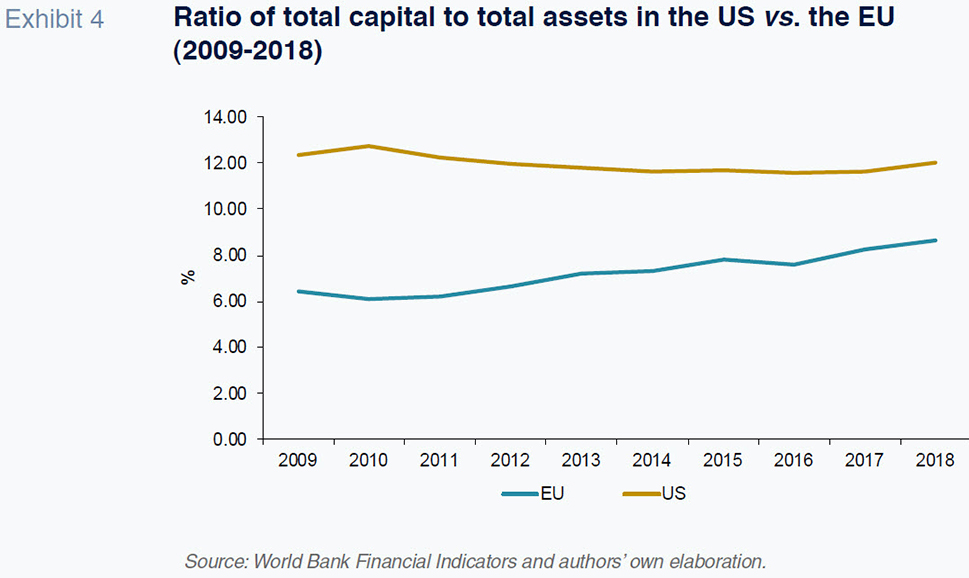
The push to generate profits originates chiefly from competitive and market pressure but also stringent regulatory requirements, too. Capital requirements have tightened considerably so that banks are now building up larger capital buffers (over and above the minimum levels required). Here too the situation is different in Europe compared to the US. Exhibit 4 uses World Bank data to compare the two regions. The benchmark ratio used is the total capital ratio (Tier 1, 2 & 3) as a percentage of total bank assets. As shown in the exhibit, the strong recapitalisation effort that followed the bailouts in the US put that ratio at around 12%, where is has stayed since then. In the EU, however, that capital ratio averaged roughly half of that number in 2009, rising to below 10% by the end of 2018.
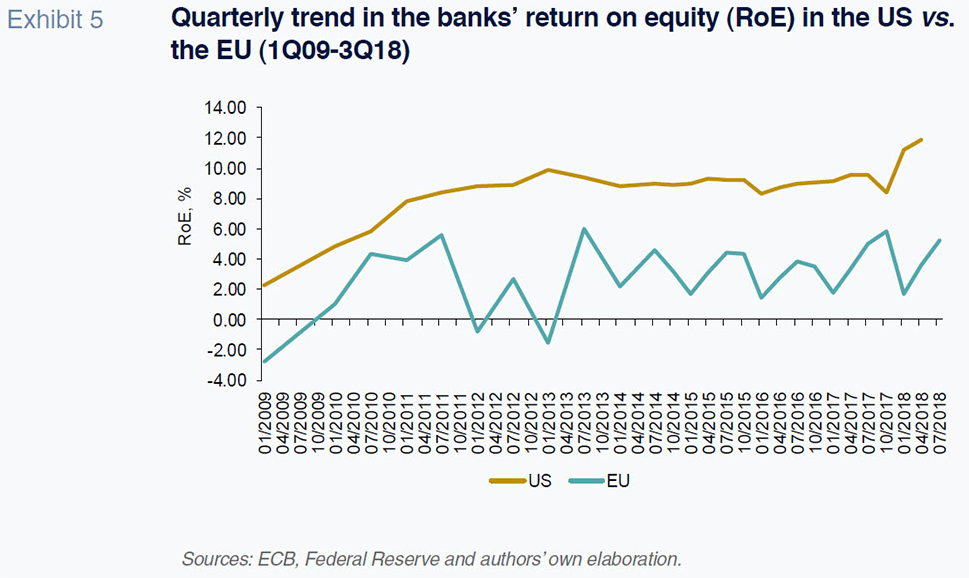
The gap in profitability holds no matter which metric is used. Looking at the return on equity (RoE) (Exhibit 5), there is an increase from 2% at the end of the crisis in the US to 12% at year-end 2018. In the EU, however, RoE remains lower in absolute terms and the trend has been more erratic. The situation became particularly unstable in 2012 when the sovereign debt crisis reached its peak. Since then, European banks have yet to completely shake off lingering questions about the health of their assets. In recent years, the RoE in the EU has ranged between around 2% and 6%, about half of the US level.
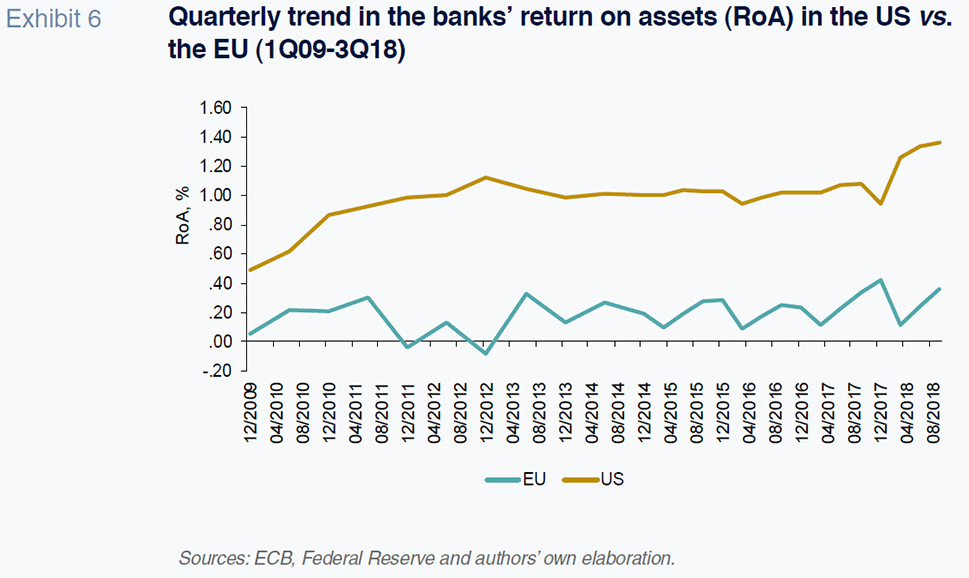
The gap remains if we look at the return on assets (RoA) (Exhibit 6), which stood at close to 1.4% in the US at the end of 2018, compared to under 0.4% in the EU.
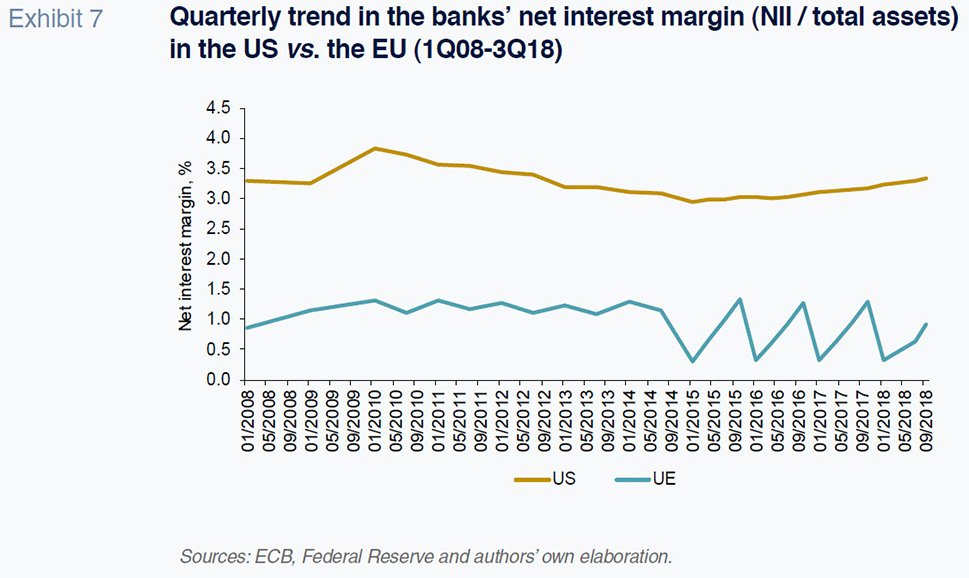
Lastly, the ability to generate net interest income (interest earned on loans less the cost of funding, primarily deposits) has been conditioned -on both sides of the Atlantic- by persistently low interest rates. Even following the recent rate increases, US financial institutions struggled to push their net interest margins to 3.5%, whereas the average in Europe is currently languishing under 1%.
Conclusion
The comparative analysis outlined in this paper shows the US banks are better capitalised and more profitable than their European counterparts. In terms of solvency, the gap does appear to be gradually narrowing. Conversely, the profitability gap has proved consistent. Lastly, monetary policy has had an adverse impact on both US and European banks. Despite differences in absolute levels (rates are higher in the US), the considerable flattening of yield curves is making it hard to generate net interest income in both regions.
Although capital adequacy is an essential macroprudential tool, the supervisors also need to generate credibility in the market with respect to the banks’ ability to withstand episodes of stress. Notably, both the US and Europe are getting ready for the next round of stress tests. In the US, the systemic banks will undergo two sets of stress tests, the Dodd-Frank Act stress tests (DFAST) and the Capital Analysis and Review (CCAR) tests. In 2019, the stress tests will concentrate on adverse economic scenarios including an unemployment rate of 10% and more stringent tests of corporate and real estate loans. Most analysts believe that the US stress tests are not only more rigorous than the eurozone tests but also more consistent from one year to the next. In the eurozone, the approach to assessing banks’ asset quality continues to be piecemeal. The authorities began by analysing credit risk, turning later to market and liquidity risk. The new metric slated for 2019 is the introduction of specific tests to calculate the banks’ “period of survival”. This refers to the number of days a bank can continue to operate using available cash and collateral.
[1] The purpose is to analyse how the banks would function during a crisis with no access to market funding.
Whether 2019 will boost confidence in the banks in Europe and the US -and their market values- remains an open question. What the data do tell us is that EU financial institutions have been harder hit in relative terms due to the dent in confidence caused by isolated cases, such as that of Italy, relating to the health of the country’s banking industry and debates over fiscal policy. In the US, however, in addition to having to make a greater provisioning effort, financial institutions have been able to leverage a period of vigorous and protracted economic growth, which has been accompanied by tax reforms. Nevertheless, it is worth noting that these tailwinds and headwinds will not necessarily last in the medium term.
Notes
Santiago Carbó Valverde. CUNEF, Bangor University and Funcas
Timothy Cobau. Fulbright Fellow, Funcas
Francisco Rodríguez Fernández. University of Granada and Funcas