
Low corporate tax revenue in Spain: A comparative analysis
Unlike the situation of most EU-15 countries, Spanish corporate income tax revenues are yet to recover to their pre-crisis peak. The government is contemplating several measures aimed at addressing low corporate tax take; however, both domestic and international political considerations are delaying speedy implementation.
Abstract: Tax revenue from corporate income tax has not recovered to pre-crisis levels in Spain. That is an anomaly in the European Union and comparable only to the situation in Italy. The government is contemplating the passage of measures this year which would increase annual corporate tax revenue by approximately 1.5 billion euros. Implementation of those measures depends on the ability of the minority government led by Pedro Sánchez to garner the support needed to pass the 2020 budget. The government is also assessing the possibility of enacting a new tax on BigTech which according to official estimates would generate annual tax revenue of around 1 billion euros. In any event, settlement of that tax has been postponed until the end of the year pending an agreement on a global minimum level of corporate tax on technology giants and other large multinationals which is currently under discussion at the OECD.
Prevailing low corporate tax revenue in Spain: An outlier [1]
Spain’s public deficit target for 2019 was 2% of GDP. However, pending the publication of official final number, reputable economic organisations, think-tanks and research houses, such as the Bank of Spain, BBVA Research and Funcas estimate that the deficit came in at between 2.4% and 2.5% of GDP. The impaired health of public finances, coupled with the European Commission’s call for structural reforms, has revived debate about the Spanish tax system’s revenue sufficiency. One of the issues receiving the most attention has been the low level of corporate income tax (CIT) receipts. Some of the measures taken in the wake of the 2008 crisis were designed to boost corporate tax receipts, e.g., earlier payments on account, limits on the offset of losses and on the deductibility of interest costs and depreciation charges and the elimination of accelerated depreciation schemes.
CIT is a pillar of the Spanish tax system. Traditionally, it has been Spain’s third largest source of tax revenue after personal income tax (PIT) and value added tax (VAT). [2] However, its contribution has been undermined considerably by the last major recession. As shown in Exhibit 1, the 2008 crisis halted the trend of sharp growth in CIT revenue observed since the mid-1990s. [3] CIT revenue peaked in 2007 at 44.82 billion euros. In the next three years –2008, 2009 and 2010– revenue would decline by 39.1%, 26.1% and 19.8%, respectively. Over that short period of time, CIT revenue plummeted by 63.9% from its peak to just 16.2 billion euros in 2010. Albeit marked by ups and downs, corporate tax revenue embarked on a slow recovery in 2011, underpinned by the economic recovery as well as changes in the structure of the tax. However, a decade on from the onset of the crisis, CIT revenue has yet to rebound from its tremendous slump. The economic slowdown forecast for Spain in 2020 will weigh on that recovery in revenue. Funcas is currently estimating GDP growth of -3.0 in 2020, down from 2.0% in 2019. [4]
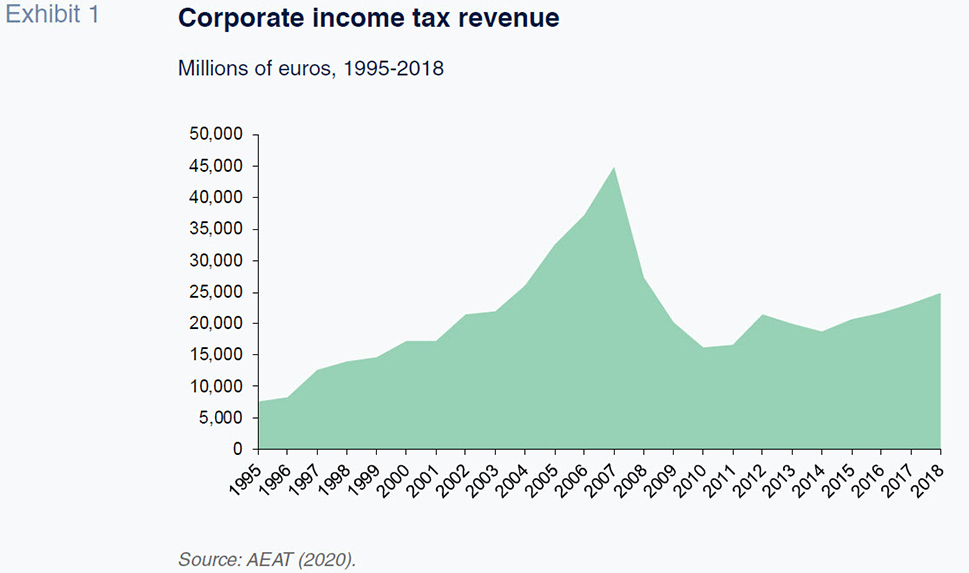
The sharp drop in CIT revenue between 2008 and 2010, and its impact with respect to current levels, may be described as anomalous for several reasons. Firstly, the collapse in CIT revenue during the crisis was greater than that experienced in VAT revenue (particularly intense between 2007 and 2009) and in PIT revenue. [5] Secondly, PIT and VAT receipts were back at their pre-crisis levels by 2014. Conversely, according to the most recent data available, which date to 2018, CIT revenue has yet to overcome its slump. In fact, 2018 CIT revenue accounted for just 55.4% of the 2007 peak. [6] That low relative revenue level is an outlier within the former EU-15 and only comparable with the situation in Italy (64.8%).
For comparative purposes, Table 1 shows, for the former EU-15 (including the UK), the year in which CIT revenue peaked, the impact of the crisis on tax receipts in 2007-2009, the ratio of revenue in 2018 with respect to the peak level and the number of years elapsing until the pre-crisis revenue level was regained. The information provided in Table 1 yields the following conclusions:
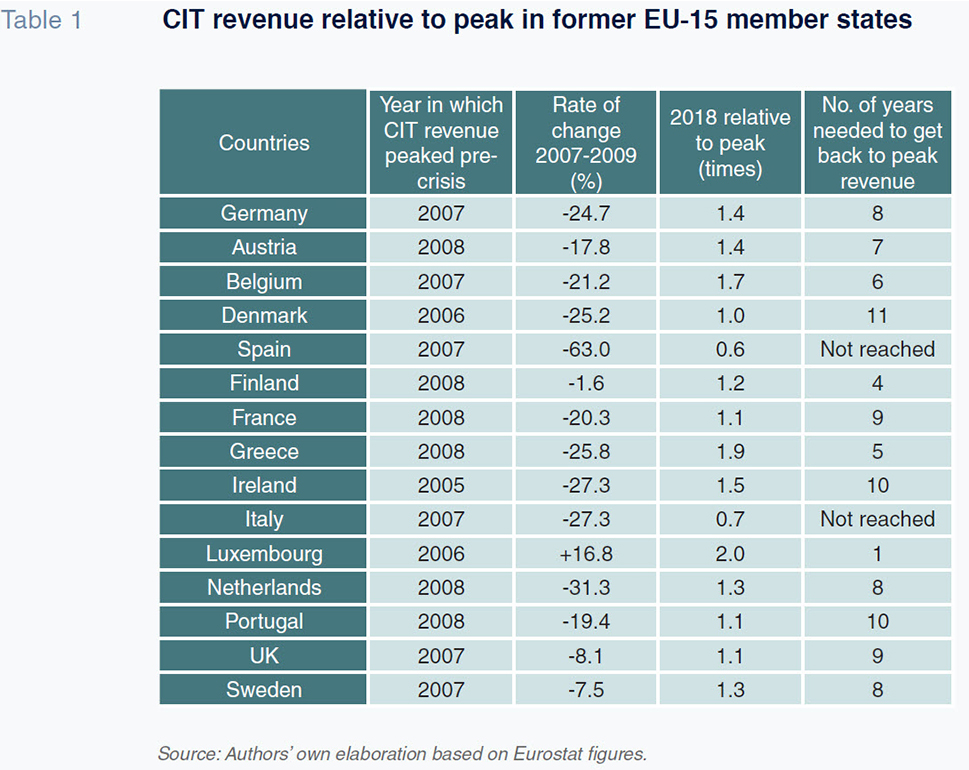
- Virtually every nation registered peak revenue in 2007 or 2008. As noted earlier, Italy and Spain are the only former EU-15 states where CIT revenue was not back at pre-crisis levels by 2018. The relative revenue ratio in both countries, 0.6 in Spain and 0.7 in Italy, is clearly below the EU-15 average of 1.3.
- In 2007-2009, CIT revenue in Spain plunged 63%, compared to a decline of 27.3% in Italy. Germany (-24.7%), Denmark (-25.2%), Greece (-25.8%), Ireland (-27.3%) and the Netherlands (-31.3%) dealt with revenue slumps on par with that of Italy. Despite those differences, Spain and Italy reached 2018 with relatively similar revenue percentages with respect to pre-crisis peaks. The reason is that CIT revenue has grown by 2.7% per annum on average in Italy since 2011, compared to 6.0% in Spain.
- The other 13 member states of the former EU-15 have surpassed pre-crisis revenue levels, albeit taking very different lengths of time to do so. The revenue recovery timeframe has ranged between a low of four years in Finland and 11 in Denmark, the only exception being Luxembourg, which took just a year. The average number of years required has been 7.4.
In this context of slow recovery in revenue, the coalition agreement reached in Spain last December included structural changes to corporate income tax which are expected to drive a net increase in revenue of approximately 1.5 billion euros. [7] Effectiveness of the measures would have a net impact equivalent to 6.0% of 2018 revenue. However, implementation depends on parliamentary approval of the 2020 budget. The government expects to push the related legislation through next June. However, it is highly uncertain whether the minority government headed up by Pedro Sánchez will be able to pass the 2020 budget.
The tax changes specifically contemplate the following three measures: (i) establishment of a minimum rate of taxation for large companies; (ii) limitations on tax-exempt dividends between parents and subsidiaries; offset by; (iii) a reduction in the statutory rate applicable to SMEs with revenue of less than one million euros. The first measure essentially entails setting a minimum tax rate of 15% of taxable income; it will only apply to large companies. [8] Specifically, the measure will affect groups that file their taxes under the tax consolidation regime, no matter their revenue, and companies outside of that regime that report revenue of 20 million euros or more. The second measure is a change in the threshold for the double taxation exemption from 100% to 95% to comply with the European parent-subsidiary directive. The government estimates that the two measures, combined, will drive an increase in revenue of 1.78 billion euros. [9] Elsewhere, the coalition agreement stipulated a reduction in the statutory rate from 25% to 23% for the smallest SMEs only. The government estimates that measure will cost it 260 million euros in annual CIT revenue. [10]
Reasons for the low corporate income tax burden in Spain: Low tax base and low average rates
The corporate tax burden relates two aggregate measures: a country’s tax revenue (T) to its GDP. With the caveats implicit in a simple comparison of any two aggregate metrics, [11] the tax-to-GDP ratio provides insight into: (i) the tax burden of a country over time; (ii) the weight and trends in the factors that affect that tax burden; and, (iii) the differences at the international level. The corporate income tax burden can be expressed as follows:
TB=T/GDP=B/GDP*T/B=b*ti
where B is taxable income or the tax base, b is the relative size of the tax base in terms of GDP and ti is the implicit rate over taxable income. The implicit rate, as it coined in the Eurostat statistics, is an average rate calculated using macroeconomic aggregates rather than from individual company figures. As is well known, CIT is complex in structure, making it hard to compare across countries. Taxable income is calculated from accounting profit, which is adjusted in several ways, including correction for measurement differences between accounting and tax standards and the offset of prior-year losses. The amount of tax borne, and the average rate by extension, depends on the prevailing statutory rate of tax, the existence of reduced rates and the catalogue of permitted tax relief. As shown, different combinations of tax bases and average rates can result in similar tax burdens or tax-to-GDP ratios. In other words, a similar burden may derive from a low tax base coupled with a high average rate, a high tax base and a low average rate or a moderate base and average rate. It is important to note, however, that the choice of rate for revenue determination purposes is not neutral with respect to company decisions regarding where to produce and/or invest. Those types of economic effects cannot be thoroughly analysed using aggregate metrics such as the tax burden.
Table 2 shows for 2017, using the latest available data from Eurostat (2019), the breakdown of the CIT tax burden in the former EU-15. Based on the tax burden ranking, and considering the main patterns in terms of tax bases and average rates, the EU-15 countries are classified into four differentiated groups. The first group comprises the three countries with the lowest tax burdens, including Spain, with an average tax-to-GDP ratio of 2.1%. That group is populated by three Mediterranean countries, whose tax burden ranges from 1.9% to 2.3%. The size of the tax bases and rate levels in this group are moderate. Specifically, the size of the tax bases range between 12.9% and 15.4% of GDP, while average rates range between 14.7% and 16.0%. The range of variation in rates is approximately one point and in tax bases, two points.
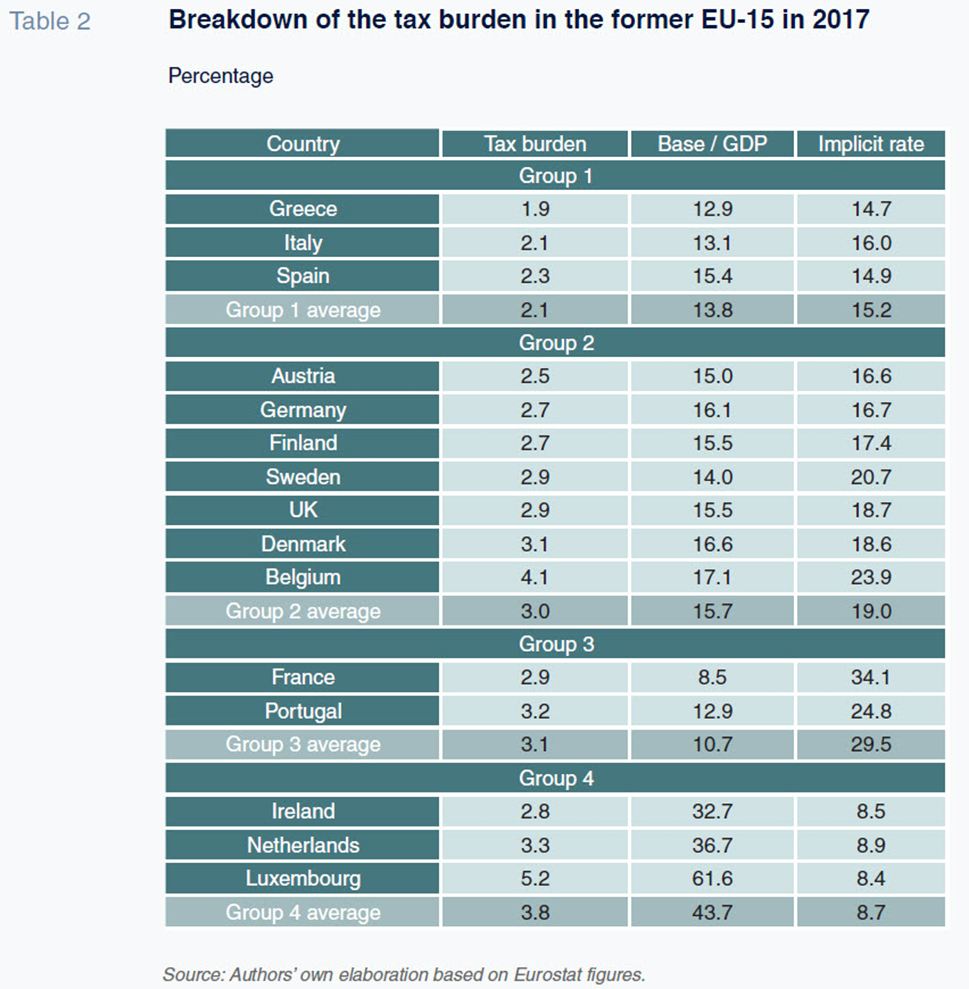
Group 2 is the biggest of the four, with seven countries. It includes three Scandinavian countries –Sweden, Finland and Denmark–, three central European countries –Germany, Austria and Belgium– and the UK. The average tax burden in this group is 3.0% and ranges between 2.5% in Austria and 4.1% in Belgium. These countries’ tax bases are equivalent to 15.7% of GDP on average, which is 1.9 points above the average for the Mediterranean countries comprising group 1. The average effective rate is 19.0%, i.e., 3.8 points higher than the group 1 average. In comparative terms, the higher tax burden relative to group 1 is attributable to higher bases and higher average rates. However, the difference is starker with respect to rates.
Group 3 contains only two countries: France and Portugal. Their tax burden averages 3.1%, which is very close to the group 2 ratio (3.0%). However, the composition of their bases and rates is notably different to that of the other two groups. The differences are clear to see: smaller tax bases and higher average tax rates. The tax base in group 3 is 10.7% on average, 5 points below that of group 2 and 3.1 points below that of group 1. Meanwhile, the average rates in France and Portugal are the highest in the EU-15. The average CIT rate in group 3 is 29.5%, i.e., 10.5 points above the group 2 average and 14.3 points above the group 1 average. Table 2 reveals how France and Portugal present similar tax-to-GDP ratios as Sweden, the UK and Denmark, albeit underpinned by a very different model based on small tax bases and high average rates.
Lastly, group 4 includes Ireland, Luxembourg and the Netherlands. In recent decades, those three countries have opted for very wide tax bases and very low average tax rates. The model pursued by the countries in group 4 is precisely the opposite of that followed in Portugal and France. As shown in Table 2, the size of the tax base in group 4 ranges from 32.7% in Ireland to 61.6% in Luxembourg, the latter the highest in the EU-15. Conversely, the average rates are the lowest in all the EU-15, ranging between 8.4% in Luxembourg and 8.9% in the Netherlands.
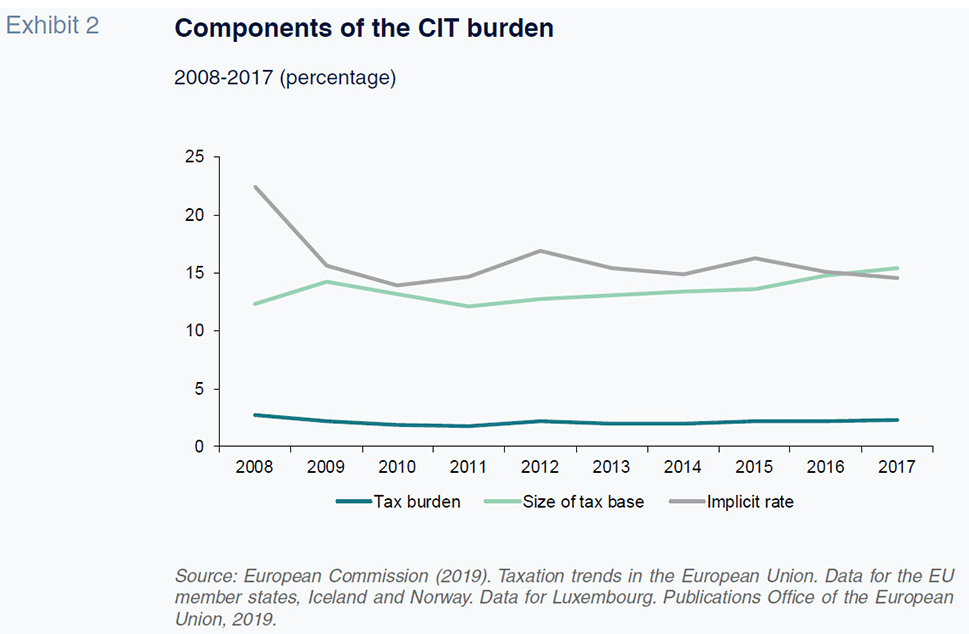
In recent years, corporate tax has been modified a number of times in Spain. We single out the following structural changes. First, the limit on the deductibility of interest expense since 2012. There have been two limits on the deduction of net finance costs (finance costs less finance income) since that date. A relative limit of 30% of taxable income and another absolute limit of 1 million euros. [12] Secondly, since 2011, the ability to utilise tax losses carried forward –in percentage terms– has been gradually reduced for companies with revenue of over 20 million euros. The ability to offset losses was made even more stringent in 2016, when it was capped at 1 million euros. [13] Lastly, [14] the reduced rate applicable to SMEs with revenue of less than 10 million euros was eliminated in 2015; since then, a single statutory rate of 25% has applied to companies of all sizes. For illustrative purposes, Exhibit 2 shows the aggregate impact of the various measures taken on the size of the tax base and effective rates. It reveals that the relative size of the tax base has been trending slightly higher since 2011. That year, taxable income accounted for 12.1% of GDP; by 2017 that percentage had climbed to 15.4%. In contrast, there has been no clear effect on the trend in the implicit rate over the same timeframe.
Tax revenue foregone due to the BEPS phenomenon: Taxing BigTech
Ever since the 2008 crisis, countries in Europe have been worried about the impact that base erosion and profit shifting (BEPS) to other jurisdictions is having on corporate income tax revenue. As far as we are aware, there are no detailed estimates of the opportunity cost of BEPS for the European Union member states. One exception is the work done by Álvarez-Martínez et al. (2018), which offers calculations for the EU members states and other countries such as the UK, Japan and the US. The authors use the European Commission’s CORTAX general equilibrium model. For Spain, the authors estimated the impact on tax revenue of base erosion and profit shifting to jurisdictions with lower tax burdens (but not tax havens) at 684.7 million euros per annum, which is equivalent to 2.8% of 2018 revenue. Nevertheless, further evidence is required to calibrate the scope of the effect of BEPS on tax revenue in Spain.
Since 2013, the OECD has been spearheading the coordination of anti-BEPS legislation. As a result of that effort, in 2016, the EU published its anti-tax avoidance directive (ATAD) targeting some of these practices. [15] In 2018, the European Commission made two simultaneous proposals for increasing the large technology firms’ tax burden. The first, a far-reaching initiative, is aimed at reforming corporate tax so that it is paid in the jurisdictions in which the companies’ service users are located. That proposal is currently being led by the OECD, which expects to reach an agreement with 137 countries at the end of this year for the imposition of a minimum global tax rate on multinational enterprises (MNEs) in all sectors –not just technology firms– that engage with end customers. [16] To that end it has set up two committees: one tasked with establishing the criteria for allocating profits between jurisdictions and another with establishing a minimum tax rate for multinational enterprises, which is likely to be around 13%. As mentioned earlier, that rate is very close to the minimum rate of 15% which the government is planning to impose on large-sized Spanish enterprises. In parallel, given the complexity and time required to strike an agreement of that scale, the Commission is considering a second transitional arrangement which consists of a tax applicable only to BigTech firms which broadly speaking would be levied at 3% of their revenue rather than on their profits. Following the failure to reach consensus within the European Union, the various member states, including Spain and France, have decided to forge ahead unilaterally.
Against that backdrop, at the beginning of the year, the Spanish government initiated the process for approving a tax on technology firms (in Spain it is known as the ‘tax on certain digital services’). The structure of the proposed tax is similar to that passed in France: 3% of the revenue generated by companies with annual revenue of over 750 million euros (and over 3 million euros in Spain) from online advertising and intermediation services and the sale of data. The government expects this new tax to generate revenue of 968 million euros, although the AIReF is forecasting revenue in a range of between 546 and 968 million euros (AIReF, 2019). The tax has yet to be approved; the draft legislation was sent to parliament in February. However, as in France, the Spanish government has decided to temporarily suspend it, pushing back its settlement until the end of the year. In that manner, pending an agreement on global minimum taxation on MNEs, the government avoids the risk of retaliation by the US administration in the form of tariff hikes on Spanish imports. At any rate, judging by the news reports, the Spanish government would appear to be inclined to push ahead with the tax on technology firms if there is no global agreement on minimum MNE taxation.
Notes
Throughout this analysis we refer to the tax collected under the nationwide regime. It therefore excludes the tax collected in the Basque region and Navarre, which operate under their own regional regimes.
In 2018, CIT revenue was 24.84 billion euros, compared to PIT revenue of 82.56 billion euros and VAT receipts of 70.18 billion euros.
The average effective annual corporate tax rate between 1995 and 2007 was 16.6%.
Note that the economic slowdown is likely to be far greater on account of the coronavirus. On March 2nd, the OECD cut its forecast for global growth by 0.5 percentage points and for growth in the eurozone by 0.3 percentage points.
Between 2007 and 2009, VAT revenue declined by 40%, while PIT revenue decreased by 12.5%.
The recovery between 2011 and 2018 –average annual growth of 6.0%– has been clearly insufficient to enable a full rebound from the revenue slump.
The measures were included by the current administration in the updated version of the Stability Programme for 2019-2021 in 2019.
The minimum rate will increase to 18% in the case of financial institutions and oil and gas companies.
The report issued by Spain’s independent fiscal institution, AIReF, estimates a range of between 1.65 and 1.9 billion euros.
AIReF estimates point to a range for this cost of between 242 and 278 million euros.
The analysis does not take into consideration the micro breakdown of those variables.
With those changes, Spain moved to the front of the European action plan (Directive 2016/1164) against base erosion and profit shifting (BEPS) as a result of multinational enterprises’ tax avoidance strategies.
There has been no time limit on offsetting tax losses since 2015 (the limit used to be 18 years).
There is no information about what impact the limit on offsetting losses has had on tax receipts. The limit on the deductibility of finance costs increased the tax base by 2.71 billion euros in 2017 (most recent figure available). That same year, the foregone revenue from the existence of reduced rates was 384 million euros.
Hybrid instruments, international tax transparency and the deductibility of interest expense.
The agreement is not final but it is possible that only extractive MNEs will be excluded.
References
AEAT. (2020). Monthly tax revenue statistics. Agencia Tributaria. Available at: https://www.agenciatributaria.es/AEAT.internet/datosabiertos/catalogo/hacienda/Informe_
mensual_de_Recaudacion_Tributaria.shtml
AIReF. (2020). Report on the 2019-2022 Stability Programme Update. Report 32/19.
ALVAREZ- MARTÍNEZ, M. T., BARRIOS, S., D’ANDRIA, D., GESUALDO, M., NICODÈME, G. and PYCROFT, J. (2018). How large is the corporate tax base erosion and profit shifting? A general equilibrium approach. Cesifo working paper, 6870.
Desiderio Romero-Jordán. Rey Juan Carlos University and the OFEP
José Félix Sanz-Sanz. Madrid Complutense University and the OFEP