
Spanish, Eurozone and US banks: The link between market valuations and profitability
The advent of the Banking Union has helped drive a substantial improvement in the main bank performance ratios, which has in turn translated into gains in banks’ share prices. While improvement has been uneven across geographies, better performance in Spain is being rewarded by higher valuations relative to European peers.
Abstract: The creation of the Banking Union has facilitated a significant improvement of European banks’ main performance indicators, most notably the decline in their NPL ratios. Against the backdrop of this improvement in banks’ metrics, their market values have also rebounded considerably, albeit the recovery has been uneven between the US and Europe and has not reached pre-crisis levels. In analysing which factors have the biggest impact on market valuations, ROE proves to be the most significant, scoring an R2 of over 50%. This statistical significance increases to nearly 90% when the regression analysis considers forward-looking ROEs, which stand above current profit levels, evidencing the fact that the market is pricing in future profits.
Introduction
The publication of banks’ 2017 results marks the end of three full years of operation under the scope of the Banking Union. Such a milestone warrants an analysis of the performance of the banks in Spain and in Europe, together with the market’s response. The analysis is presented from a dual perspective. Firstly, over time, from the start of the century, to illustrate how the crisis affected banks’ market valuations in the three jurisdictions studied (Spain, Europe, and the US). Secondly, a cross-sectional approach, analysing a broad sample of listed banks in Spain, the eurozone and the US to determine the key factors explaining the market values of each at present.
The analysis of the relative market values of the banks (measured using their price-to-book value or P/BV multiples) is particularly relevant as it enables the measurement of the value created by the entities via different business models. In addition, it constitutes an indirect indicator of the market’s confidence in the sustainability of each bank and, therefore, the distance from non-viability or resolution. And last but not least, a high valuation (close to or even above book value) is a prerequisite for tapping the market for Tier 1 equity (shares) and broadening the shareholder base.
Bank valuations: A long-run perspective, pre- and post-crisisIn order to gain insight into the trend in bank stock market valuations over time and visualise the impact of the crisis and subsequent recovery has had on these valuations, Exhibit 1 depicts the trend in the P/BV ratio in Spain compared to Europe and the US. In all three cases, we have approximated that ratio by aggregating the weighted averages for the listed banks.
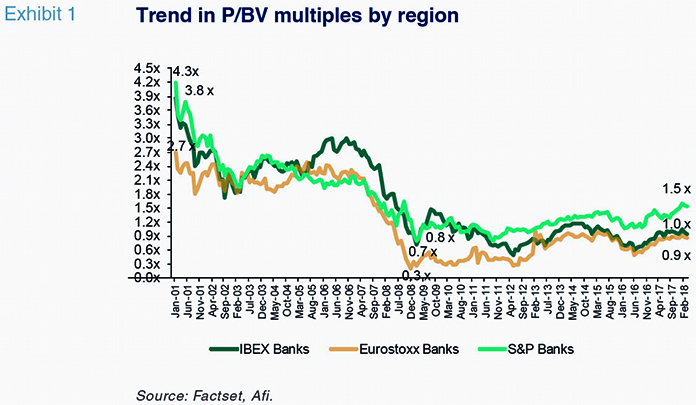
Compared to valuations of three or four times’ book value at the start of the century, the advent of the crisis translated into significant discounts to book value, evidencing major doubts about the reliability/recoverability of those book values and the banks’ ability to generate sufficient returns on their capital.
Focusing on the Spanish banks, it is worth highlighting how the market had assigned particularly high valuations (far higher than those assigned to their European or US counterparts) at the peak of the real estate bubble (2005 - 2007), demonstrating that the stock market proved incapable of anticipating that the boom years could not go on indefinitely. The correction associated with the crisis was also proportionately sharper in the case of the Spanish banks than in that of the other two subgroups analysed.
Since the lows of the crisis, the subsequent recovery has been clearly asymmetric in the US versus Europe: sustained and recurring in the former, whereas the European banks, and in particular the Spanish banks, after a false start in 2009, sustained a fresh relapse between 2010 and 2012, hitting new lows that were even lower than those observed during the collapse of Lehman Brothers. The subsequent recovery, underpinned by several key decisions taken in the summer of 2012 − the bailout of the Spanish banks and, above all, the ECB’s decisive ‘whatever it takes’ message, coupled with the commitment to move ahead with the Banking Union − has not been sufficient to close the valuation gap opened up vis-a-vis the US banks, which are trading at a premium of over 50% to the Spanish banks and at an even higher premium compared to the other European banks.
Bank performance three years after the creation of the Banking Union (BU)
Given that, as mentioned above, the European banks’ stock market recovery was driven largely by the announced creation of the Banking Union (BU), a first analysis of the factors that explain the European banks’ current valuations should focus on analysing their performance during the three full years (2015, 2016 and 2017) for which they have been operating under the supervisory and regulatory umbrella of the BU.
To this end, the listed banks having all duly presented their 2017 earnings, we analyse the data for that year for a broad sample of Spanish banks (7) and entities from other European countries (20) with the aim of analysing the improvements sustained in their key performance indicators during the three years since the rollout of the BU. By way of contrast, we layer into that analysis the performance posted by the US banks, for which we also use data for a broad sample of banks (18).
Specifically, we focus on three bank performance indicators: asset quality, for which we use their non-performing loan (NPL) ratios; their cost-to-income (CtI) ratios, as a measure of managerial efficiency; and their returns on equity (ROE).
It is unquestionably in asset quality (NPL) that the improvement observed across the European and Spanish banks three years on from the introduction of the BU is clearest. Exhibit 2 illustrates for all of the banks in the sample their current NPL ratios and those reported before the rollout of the BU. As expected, all of the banks in the sample fall below the diagonal line, which means that their NPLs are across the board lower today than in 2014. The distance from the diagonal line indicates the improvement observed and is in general greater in the case of the Spanish banks than for the rest of the European banks.
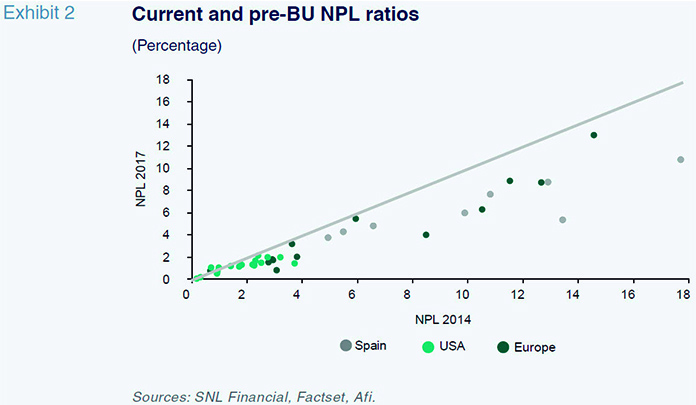
However, this optimistic interpretation gets watered down when contrasted with the US banks, for which the NPL range is substantially below the range observed for the Spanish and other European banks. It is probable that the far lower NPL ratios reported by the US banks is one of the factors explaining their relatively higher market valuations, as we will analyse further on.
As for operating efficiency (CtI), the trend has been far less favourable than observed in the case of the NPL ratios. In fact, as is shown by Exhibit 3, the majority of European banks, including Spanish banks, have become less efficient, placing above the diagonal line, indicating that their CtI ratios are higher in 2017 than in 2014. This adverse trend in efficiency has undoubtedly been shaped by the persistent downward pressure on gross margins (the denominator in the CtI ratio) in the absence of business growth and in an environment of zero or even negative rates. It has not been possible to offset that downward pressure on margins with the cost-cutting that most of the banks have undertaken. In contrast, US banks, whose margins are higher and whose business volumes have experienced stronger growth, have improved their efficiency ratios during the last three years.
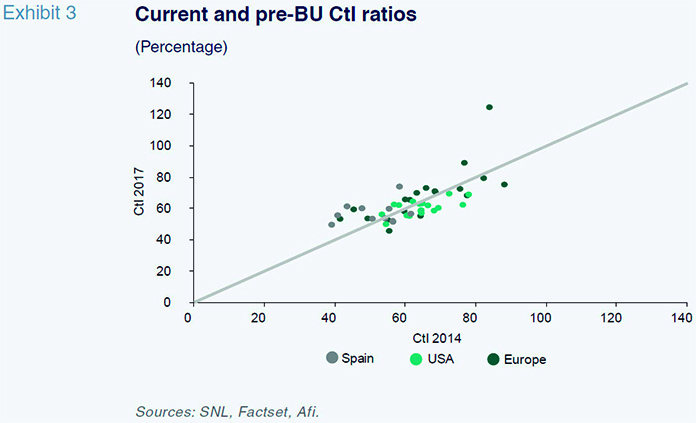
Nevertheless, it is worth highlighting the fact that, despite having deteriorated somewhat since 2014, Spanish banks present considerably better (lower) cost-to-income ratios than either their European or US counterparts.
Lastly in our round-up of how European and Spanish banks have improved their performance under the umbrella of the BU, we look at a key parameter for investors and their take on bank capital,
i.e., the return on equity (ROE), the trend for which is presented in Exhibit 4.
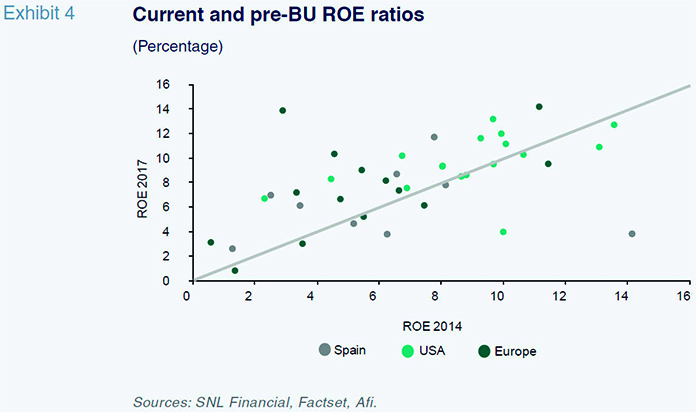
Although most of the banks lie above the diagonal line (a higher ROE in 2017 versus 2014), there is considerable disparity among the various entities, whose ratios range between 1% and 15%. Within that disparity, it is clear that US banks present better ROEs than their European counterparts and, within the latter subset, Spanish banks look somewhat better than their neighbouring peers.
Bank performance and market values
Having analysed the trend in the key performance indicators for banks in the three years since the BU was created, we sought to analyse the relative importance of each in predicting the differences in banks’ market values.
To this end we charted, for the sample of banks selected, the relationship between their relative values (P/BV ratio) and their positioning in terms of the three performance metrics used: profitability (ROE); non-performance (NPL); and efficiency (CtI).
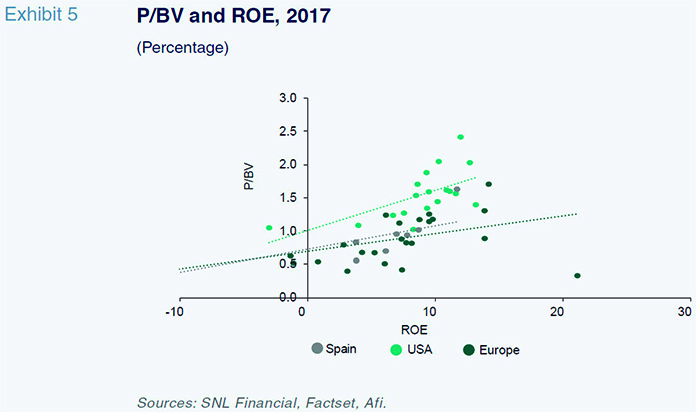
The correlation between relative valuation and profitability (ROE) is clearly positive – the higher the ROE, the higher the valuation multiple – and very statistically significant; in fact it is the variable that best explains valuation differences among the banks. The estimated regression line is far steeper in the US than in Europe and within Europe it is steeper for the Spanish banks than for the other countries. In short, not only do the American banks generate higher ROEs than their European counterparts, but each point of ROE is ascribed more value by the market in the case of the US banks relative to the European banks and within the latter, more in the case of the Spanish banks.
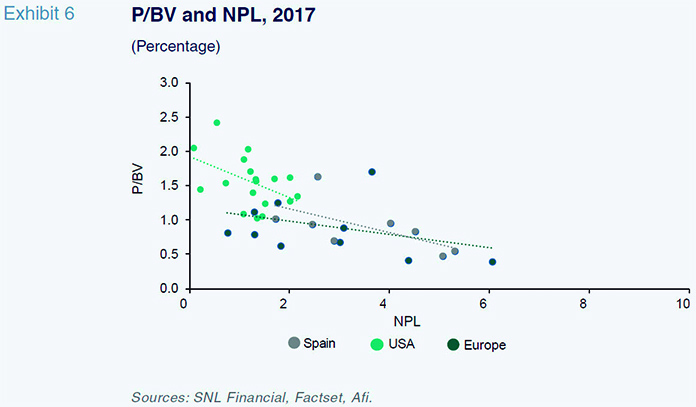
As for the correlation between market value and asset quality (NPL), Exhibit 6 confirms an inverse relationship between the two variables – the higher the NPL ratio, the lower the valuation multiple. This condition holds in all the geographies analysed. The slope of the estimated regression line is steeper in Spain than in the US and Europe, implying that each point of reduction in the NPL ratio is ascribed more value in Spain than in the other markets. Nevertheless, the explanatory power of the NPL ratio with respect to market value is substantially lower than in the case of the ROE ratios.
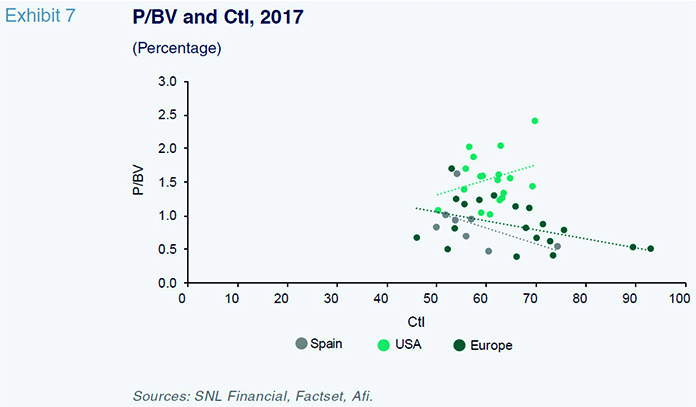
While market valuations display a clear correlation with Profitability (ROE) and asset quality (NPL); such a relationship is not statistically significant with efficiency (Cost to Income), as can be seen in Exhibit 7. In fact, there is some contradiction between results in Europe-Spain and the US. In the US, it appears that market valuation is positively correlated (although not significant) with CtI. It might be the case that in the US, the market values more the expectation of future growth than actual cost structure.
Given that the three indicators exert, each one separately, an influence over the banks’ valuation multiples, we next conducted multiple regression analysis in an attempt to estimate the aggregate explanatory power of the three variables on valuation. The results of that exercise indicate that on aggregate the three indicators have explanatory power (R2) of 55%, the effect of the ROE ratio being far more statistically significant than the other two variables (NPL and CtI) in terms of explaining the valuation differences. The estimated model is as follows:
PBV = 0.90 + 0.025*ROE – 0.004*NPL – 0.004*CtI
It is important to make a clarification when interpreting these results, particularly in terms of potentially concluding that the NPL and CtI ratios have little impact on market values, which would be incorrect. Note that there is a very high correlation between the three performance variables, so that profitability (ROE) is very strongly correlated with improvements in efficiency ratios (lower CtIs) and lower non-performance (NPLs), which translates into fewer idle assets and also lower provisioning requirements. Given these significant correlations, it should be underlined that in a multiple regression analysis such as this, the significance attributed to the NPL and CtI variables is only that which is ‘incremental’ to that already embodied by the ROE ratio as the main explanatory variable.
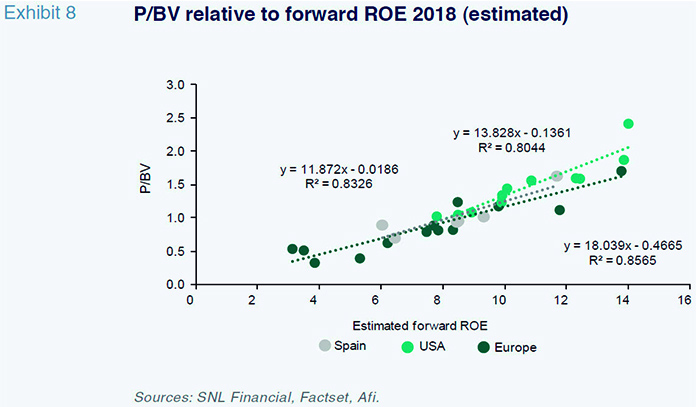
Given the relevance ascribed by the market to ROE as the main factor explaining relative valuation (P/BV), we made a final attempt at improving the explanatory power by layering in a forward-looking perspective. Instead of focusing on trailing ROEs, we focus on the consensus FY+1 ROEs estimated by the market. As shown in Exhibit 8, the explanatory power rises considerably, to nearly 90%, and the key trends commented on previously continue to hold: the slope of the regression line is steeper in the US than in Europe and within Europe it is steeper for Spanish banks.
Given the importance of the forward ROE estimates in explaining the banks’ valuations, we conclude this paper with a synopsis of what the market is looking for in the next three years compared to the results during the last three-year period − the first under the umbrella of the BU. The consensus forecasts are pretty clear-cut and point to a persistent improvement in ROEs across all the banking systems under a declining NPL burden and the possibility of increased efficiency if margins get a breather and begin to rebound slightly, in line with Afi’s expectations for Spain and Europe.
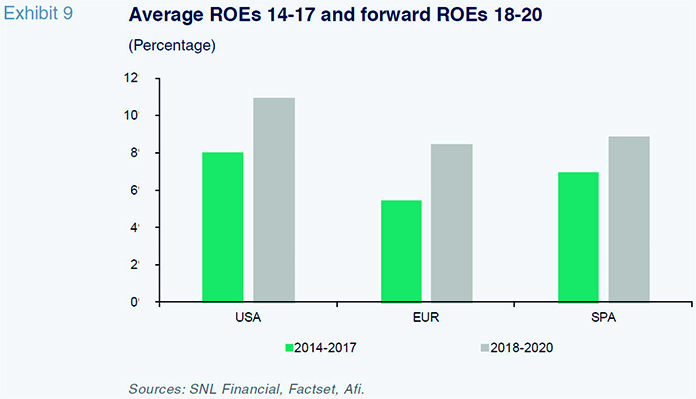
Nevertheless, US banks are expected to continue to generate substantially higher ROEs than their European counterparts, clearly consolidating the 10% mark assumed to be desirable in the long-run, a level not deemed plausible in Europe or Spain. Spain is expected to continue to present ROEs above the European average, although the gap with its European counterparts is likely to narrow.
Conclusions
Banking business conditions have improved considerably in recent years thanks in part to the creation of the Banking Union, which has prompted a substantial improvement in the main bank performance ratios.
This improvement has been welcomed by the market, as is evident in the gains in banks’ share prices, reflecting improved confidence in the banking business, especially in Europe. However, the differences between the regions are significant, as are the differences between the variables with the greatest impact on market values, with US banks enjoying higher valuations (1.5 times their book value) than their European counterparts (slightly under one times).
In Europe, the Spanish systems is, within the main banking systems, the one best valued by the market: it has unquestionably capitalised on the relatively greater provisioning effort made and the work performed to realign capacity, placing Spanish banks in a favourable position compared to their European peers on efficiency and profitability.
Ángel Berges, Alfonso Pelayo and Fernando Rojas. A.F.I. - Analistas Financieros Internacionales, S.A.