The normalisation of US monetary policy and its spillover implications
In the US, the economic recovery and the new president’s fiscal policy will determine the pace of monetary tightening, which is expected to be more gradual than that of earlier episodes. Other central banking authorities will respond to their domestic conditions taking into account the spillovers of US monetary policy. Risks remain, however, in a context of heightened uncertainty regarding the pace of recovery and economic policy at the global level.
Abstract: Despite the sharp difference between the real federal funds rate and that predicted by traditional monetary policy rules, the Federal Reserve’s monetary policy normalisation cycle is expected to be among the slowest of all cycles analysed. There are several factors that set the current episode of monetary policy normalisation apart from earlier ones, making the accurate calibration of US monetary tightening more challenging. These include: uncertainty in the actual level of US job market slack, difficulties in estimating the natural interest rate, a shift in supply and demand of ‘safe’ assets, official rates close to zero, and increased divergence in the economic cycles across the main developed economies. Evidence suggests that international transmission will also be unique. Central banking authorities in the rest of the world will respond to resulting circumstances in their domestic economies. But risks remain given the high degree of global economic uncertainty.
Expansionary monetary policy across the leading developed economies has played a very significant role in the response to the global financial crisis and the ensuing Great Recession. In the US, the Federal Reserve kept its federal funds rate at close to zero for seven years, from December 2008 to December 2015. In addition, it embraced a battery of unconventional monetary policies which led its balance sheet to balloon to all-time record levels: US public debt and mortgage-backed securities held by the Federal Reserve amounted to 23.8% of US GDP at year-end 2014, when it concluded its third financial asset purchase programme.
In December 2015, the Federal Reserve was the first major central bank in the developed world to increase its official rate since the crisis. The difficulty implicit in correctly measuring the degree of recovery after a crisis of the scale of the global financial crisis meant that it did not hike its benchmark rate again until December 2016. Moreover, several factors outside of the US are creating a complex and uncertain backdrop for this normalisation process. In addition to the slow recovery in the developed economies and more sluggish growth in the emerging economies, particularly China, uncertainty regarding economic policy intensified in 2016 on the back of the United Kingdom’s decision to depart the European Union (‘Brexit’) and the unexpected election of Donald Trump in the US, all coupled with heightened geopolitical tensions. The potential ramifications of all these events, particularly for monetary policy, were palpable in the financial markets in the latter weeks of 2016. More specifically, changes were observed in the yields and volatility of various financial asset classes in the US, including the exchange rate, with a knock-on effect in other geographic regions.
The keen interest in analysing the factors behind the gradual monetary policy normalisation process unfolding in the US and its repercussions at the international level is only logical against this backdrop. The next section of this paper analyses the idiosyncrasies of the current period of monetary tightening in the US relative to earlier episodes. Subsequently, we review the main channels of international transmission or spillover during the period of unconventional policies and since 2015, when the Federal Reserve began to increase its official rates. The paper ends with a section devoted to reviewing the recent phenomenon of widening cyclical and monetary policy divergence among the world’s leading economies and flags some of the risks implied.
Keys to the slow process of monetary tightening
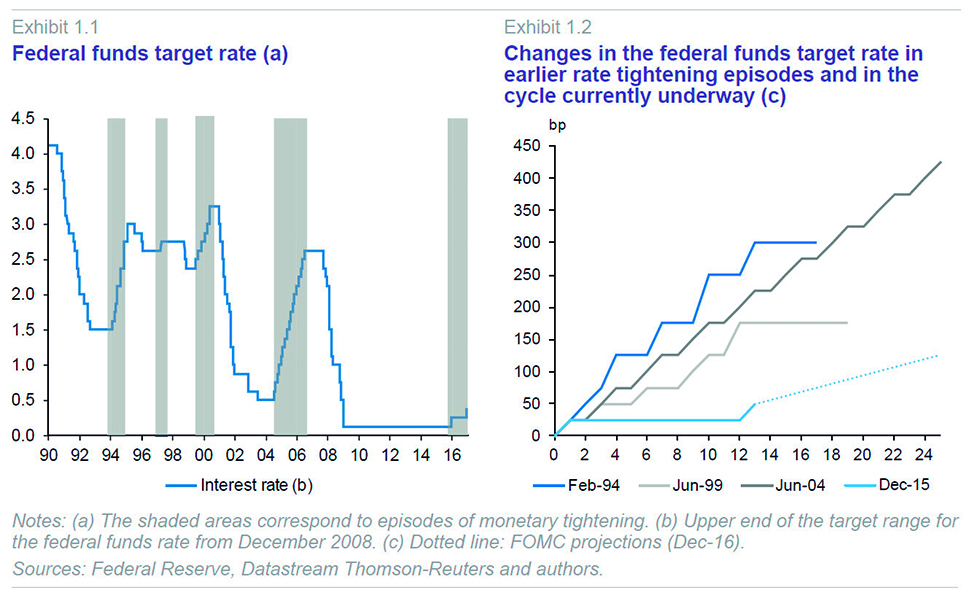
The Federal Open Market Committee (FOMC) raised the target range for its federal funds rate by 25bp, from 0.25% to 0.50% in December 2015. Following this initial move, the next increase, of the same magnitude, did not take place until December 2016 (Exhibit 1.1). As illustrated in Exhibit 1.2, this lag between rate hikes is unprecedented in prior cycles. Moreover, the most recent projections released by the FOMC for the coming years point to a much more gradual and considerably more protracted official rate tightening process compared to earlier episodes of tightening.
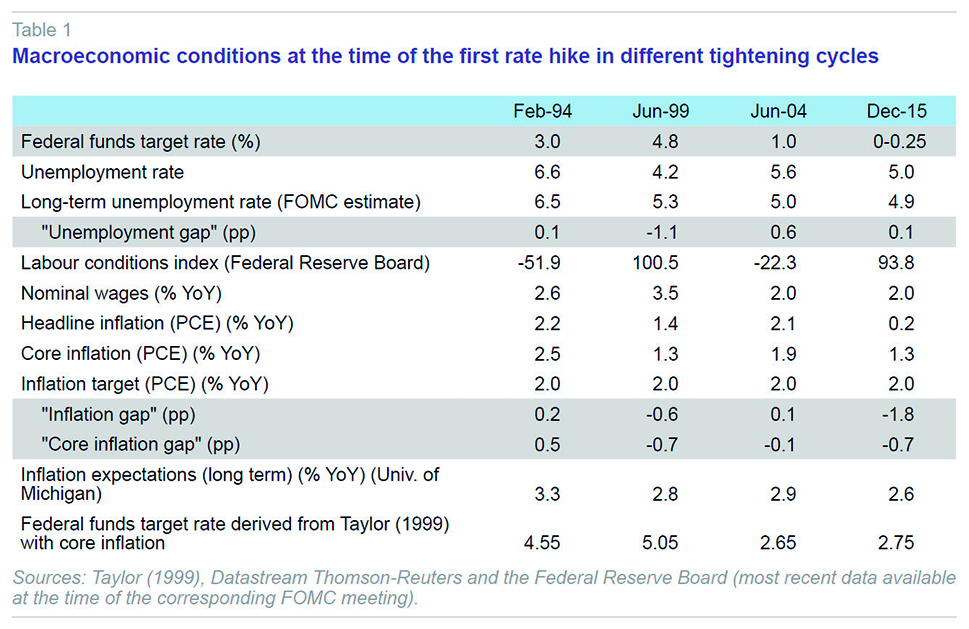
As is well known, the Federal Reserve has the dual mandate of maximising employment and maintaining price stability over the medium term. Table 1 provides the unemployment gap (observed unemployment rate less the long-term unemployment rate), the inflation gap (inflation rate less 2%) and the core inflation gap (core inflation less 2%)
[1] figures at the start of the last four monetary normalisation cycles. Regarding the full employment objective, at the start of the ongoing cycle of monetary tightening, in December 2015, the unemployment gap was virtually zero.
In December 2015, the core PCE reading was well below the target rate of 2%, as had been consistently the case since May 2012. Moreover, general inflation was very close to 0%, in contrast to the situation observed at the start of prior monetary normalisation cycles, dragged down, primarily, by the correction in oil prices sustained since mid-2014. The baseline scenario used by members of the FOMC assumes that, if inflation expectations are well anchored, inflation will tend to converge towards the target rate as job market slack gets mopped up and the effects of the above transitory factors dissipate, a pattern which has gradually materialised over the course of 2016. Accordingly, the anchoring role of inflation expectations is essential to return to the inflation target. As is evident in Table 1,
[2] survey-measured inflation expectations were not far off those prevailing at the start of earlier monetary normalisation cycles. In 2016, having dropped in the first half of the year, expectations rebounded in the last quarter, as detailed in the last section.
The Taylor rule (1999) provides a very succinct approximation of a central bank’s decision-making process. This rule embodies a simple relationship between the variables comprising the FOMC’s dual mandate and the federal funds interest rate. In its most common form, the formula is as follows:

where
it is the target federal funds rate in period
t;
r* is the real federal funds equilibrium rate or the natural interest rate, defined as the real interest rate that is consistent with full employment and the central bank’s medium-term target inflation rate, such that it is not affected by temporary shocks that affect the economy.
[3] Historically, the value assigned to this equilibrium real interest rate has been 2%.
πt is the inflation rate in period
t;
π* is the target inflation rate (the difference between the two is the inflation gap, depicted in Table 1);
ut is the unemployment rate in period t and
u* is the long-term structural unemployment rate (the difference between the two is the unemployment gap, similarly depicted in Table 1). The coefficient
ρ defines the degree of policy inertia, while coefficient
α measures the response to deviations of inflation from target and coefficient
β measures the response to deviations of unemployment from the long-term rate. The last two chairs of the FOMC have regularly used a version of this rule in their speeches and presentations,
[4] establishing the following values for these coefficients:
ρ=0;
α=0.5; and
β=2.
Taking these parameters and values, and the core inflation and unemployment rates at the start of each monetary normalisation cycle analysed, it is possible to calculate the appropriate federal funds rates according to the Taylor rule. As shown in Table 1, which provides these calculations, at the start of each of the normalisation cycles, the federal funds rate effectively set by the FOMC at the time was below that indicated by the Taylor rule; however, at the start of the ongoing cycle this difference is higher (even without factoring in the fact that the quantitative easing measures deployed imply an even lower rate). Why is it, therefore, that, despite this sharp difference, the actual and forecast pace of rate hikes for the tightening cycle initiated in December 2015 is the slowest of all the cycles analysed?
The current monetary policy cycle presents a series of idiosyncrasies which help explain the low federal funds rate and the distance between it and the rate implied by a traditional Taylor rule. We identify five factors, some of which are of a more temporary nature, worth taking into consideration: i) uncertainty regarding the level of economic slack, particularly in the job market; ii) the decline in the natural interest rate (r*); iii) shifts in ‘safe’ asset supply and demand, driving the yields on these products very low; iv) the proximity of benchmark rates to the zero lower bound (ZLB) rate, generating specific risks in the event that the rate tightening process has to be reversed; and v) outside of the US, divergence with respect to the monetary policies being pursued in other developed economies and the indirect effects on the US economy itself via the spillover effects of its monetary policy decisions on the global economy (i.e., spillbacks).
Uncertainty regarding the level of job market slack
The ongoing recovery is marked by significant uncertainty as to whether the unemployment rate is accurately measuring the degree of utilisation of resources in the job market. There are several reasons for this uncertainty. Firstly, the drop in the unemployment rate is partially attributable to a decline in the labour force participation rate which, to the extent driven by cyclical factors, could revert as the recovery gathers traction, boosting the supply of labour. Another factor working in the same direction is the existence of an unusually high number of people working part-time who would like to work full-time. For these reasons, the Federal Reserve often uses an index of labour market conditions which summarises a broad spectrum of labour market variables as an additional measure of job market slack. According to this index, which is similarly included in Table 1, there is less slack in the labour market now than in prior episodes of monetary tightening, with the exception of the cycle initiated in June 1999 (a higher reading indicates a labour market with less slack). Some analysts maintain that the low pace of growth in nominal wages is the most reliable indicator that there is still a degree of slack in the labour market. However, taking into account the low inflation rates, growth in real wages is close to modest productivity gains. That being said, in 2016, the unemployment rate fluctuated around its long-term structural value even ending the year slightly below; meanwhile, the labour conditions index continued to improve and growth in nominal wages accelerated, topping 2.9% at the end of the year.
Drop in the natural interest rateCalculation of the Taylor rule requires approximating a variable – the natural interest rate – which is not directly observable. As noted earlier, this variable has traditionally been assigned a value of 2%; however, certain authors, such as Laubach and Williams (2016), estimate that the natural interest rate
[5] has been shifting in the United States, moving from a range of between 2% and 3% from the start of the 90s until the irruption of the Great Recession, when it dropped sharply, and hovering at around zero (even falling into negative territory) since the end of 2010, as is illustrated in Exhibit 2.
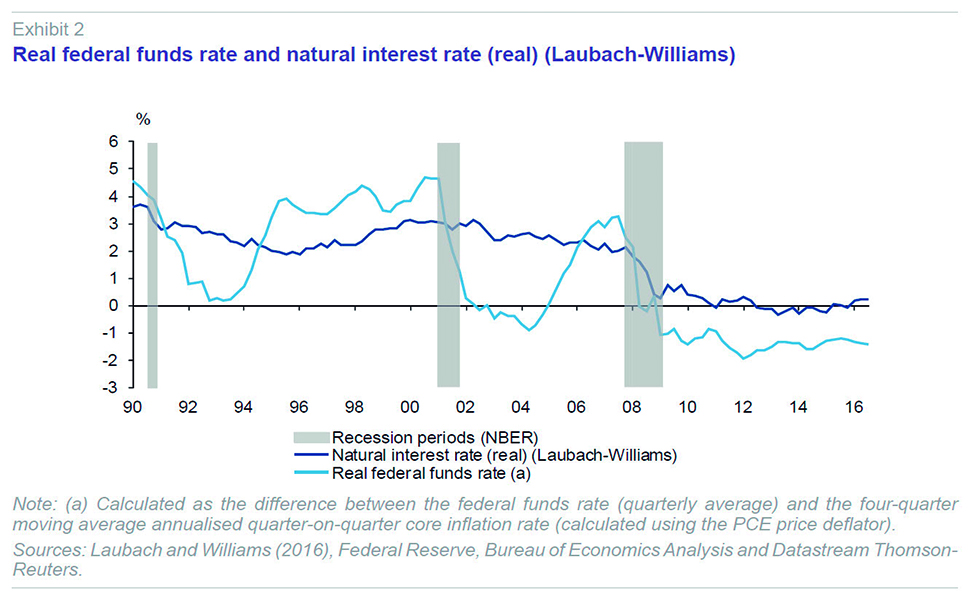
This drop, which may prove to be structural, is attributable to the low rate of growth in productivity and the population, population ageing and low investment levels, i.e., a lower trend growth rate which also needs to be factored in to the monetary policy rule calculation via the unemployment or output gap. Summers (2014), meanwhile, notes that the developed economies are suffering a mismatch between a growing propensity to save and a decreasing propensity to invest, fuelling surplus savings which drag on demand and reduce the natural interest rate (secular stagnation). Other research (e.g., Hamilton et al., 2015) agrees on the downward trend in the natural interest rate but flags significant uncertainty in the estimates and outlook for this variable, making it harder to pin down the right monetary policy.
Shifts in ‘safe asset’ supply and demandOne remarkable aspect of the recent trend in the global economy is the growing scarcity of safe assets,
[6] i.e., the supply of safe assets has not been able to keep up with global demand for such products, exerting downward pressure on their yields. Indeed, some authors suggest that this asset shortage can lead to a liquidity trap when interest rates reach their lower bound, so that the market for safe assets can only recalibrate via a drop in income (see Caballero and Farhi, 2016).
Between 2000 and 2007, the international reserves of the emerging economies increased sharply as a form of self-insurance in the wake of the various balance of payments crises of 1998-2000. In addition, China and other commodity exporters presented ample current account surpluses at the time, which translated into heady growth in their international reserves, a lot of which were invested in the above-mentioned assets. On the supply side, those years of improvement in the developed economies’ public finances led to slower growth in public borrowings relative to global GDP, albeit offset by the creation of new financial instruments such as mortgage-backed securities (MBSs), which had the effect of increasing the supply of the assets deemed safe. So, the globalisation phenomenon, coupled with financial developments, fuelled imbalances between savings and investment in emerging markets, on the one hand, and in the advanced economies, on the other, creating a ‘savings glut’ (Bernanke, 2005) at the aggregate level.
In the wake of the global financial crisis of 2008, assets such as MBSs in the US (other than those underwritten by government-sponsored enterprises) and the sovereign debt of certain eurozone issuers lost their status as “safe assets”. On the demand side, although the emerging economies’ international reserves began to decline in 2014, this was more than offset by the accumulation of safe assets by many developed economies out of precaution – in response to heightened uncertainty – and by the banks, for regulatory reasons. These factors have continued to shift the safe asset supply and demand curves, driving yields lower.
Therefore, just as the emerging economies’ surplus savings enabled long-term rates to remain stable during the last cycle of monetary normalisation (Greenspan’s conundrum), the continued shortage of safe assets in the current environment is keeping the term premium
[7] and the yield curve persistently low or even negative at present.
Official interest rates close to zeroThe zero lower bound (ZLB) on nominal interest rates constrains central banks’ ability to respond to negative shocks in the real economy or to deflationary processes.
[8] Prior to the crisis, ZLB episodes were not considered to be of practical relevance. Structural models of the US economy and the shocks observed in the past suggested that simple monetary policy rules with a 2% inflation target ensured that federal funds rates would only hit zero on a small number of occasions and that these episodes would be short-lived. However, the fact that rates have been kept at near zero for a protracted period of time in the recent past, partly as a result of the drop in the natural interest rate, mentioned earlier, has called past findings into question, making it conceivable that ZLB episodes could become more frequent and longer-lasting (Chung
et al., 2011).
An environment of heightened uncertainty, marked by a negative output gap, persistently below-target inflation and official rates still close to their lower bound, warrants a more accommodating monetary policy than under other circumstances, given the asymmetry of its effectiveness. This is particularly true at a time when inflation expectations are close to all-time lows. In these circumstances, there is more room to respond to inflationary pressures (by tightening monetary policy) than deflationary pressures: with rates hovering at the ZLB, unconventional measures may not be perfect substitutes for interest rate policies. Indeed, the costs and benefits of unconventional instruments are uncertain and their effect seems to diminish as a central bank’s balance sheet grows or the longer official interest rates remain close to the ZLB. Therefore, a comparative delay in raising interest rates would lead to higher growth and higher inflation than using a Taylor rule that did not take this uncertainty into account (Evans et al., 2015).
Economies cyclically out of sync: Spillovers and spillbacks
One final aspect worth noting, one which will be developed further in the last section, relates to the fact that the main developed economies are cyclically out of sync, which has translated into divergent monetary policy stances. Thus, while monetary tightening has begun in the US, it has continued to become more expansionary in the eurozone and Japan over the past two years and also in the UK during the second half of 2016. These discrepancies reflect rates of growth in excess of 2% in the US, where GDP has returned to pre-crisis levels, compared to weaker growth – punctuated by sharp swings – in Japan, ongoing sluggish recovery in the eurozone –accompanied by unemployment levels considered high relative to structural levels–, and heightened uncertainty and reduced momentum in the UK in the wake of the Brexit referendum.
The United States is a cornerstone of the international financial system and the dollar plays the role of reserve currency, which is why its monetary policy influences financial variables all over the world. Thus, US monetary policy, including its unconventional measures, has a clear spillover effect by influencing the so-called global financial cycle (Rey, 2013). By the same token, the international situation exerts an influence on the US economy, creating an indirect channel of transmission for the Federal Reserve’s monetary policy decisions (spillback). According to the IMF, the expansionary measures implemented in the eurozone in 2014 and 2015 and the deterioration in its outlook for growth put downward pressure on long-term rates in the US by means of flows into its public debt market (IMF, 2015). The global context is accordingly complex and uncertain, making it harder to duly manage monetary normalisation, a task which has, moreover, been further complicated in recent months by the plans announced by the US president, Donald Trump, during his election campaign, as will be seen in more detail in the last section.
US monetary policy: International spillover
The monetary policy decisions taken in the major economic blocs have implications that go beyond their borders. Given the weight of the US economy and the role of the dollar as reserve currency, the measures taken by the Federal Reserve have noteworthy repercussions in other geographic regions.
Economic theory typically distinguishes three channels by which the monetary policy of a given economy is transmitted to other economies: (i) the exchange rate channel, due to the expenditure-shifting effect under which changes in the value of the national currency trigger changes in foreign relative to home-market demand and due to the impact on foreign-currency debt holdings, which is particularly relevant in emerging markets; (ii) the trade channel, due to the effect expansionary or restrictive monetary policy has on domestic demand, in turn affecting demand for foreign goods and services; and (iii) the financial channel, due to the correlation between movements in US interest rates and global financial asset prices. The relative importance of each will depend on country-specific factors such as its degree of financial openness, trade ties with the US and the weight of exports relative to their GDP.
Between the end of 2008 and 2015, the Federal Reserve embraced unconventional monetary policy measures once official interest rates reached their zero lower bound. The various financial asset purchase programmes sought, having exhausted the scope for additional short-term rate cuts, to exert downward pressure on the medium– and long-term yields of public and private instruments. More specifically, this prompted investors to reallocate their portfolios, switching among instruments with varying levels of liquidity, risk and maturity profiles. The purchase of assets, coupled with the provision of ‘forward guidance’ regarding the outlook for official interest rates clearly signalled that the expansionary stance of monetary policy would continue in the future. Combined, conventional and unconventional policies contributed to a historical decline in the long-term interest rate term premium, even to negative values, by reducing uncertainty surrounding the outlook for short-term rates.
These signals had an effect domestically but also globally. By increasing the size of its balance sheet, the Federal Reserve had the effect of driving long-term rates lower in emerging and developed economies alike by boosting demand for higher-yielding assets. Similarly, the increase in liquidity and the persistent interest rate differentials triggered carry trades, nudging significant capital flows towards other economies.
The role of the unconventional monetary policies adopted in the US in driving output back to pre-crisis levels remains the subject of much debate. Nor is there consensus about the reach these initiatives had internationally. In particular, the direction and intensity of the impact of the Federal Reserve’s policies on the exchange rate and on the long-term interest rates of other countries and their ultimate impact on economic activity is much discussed. It is difficult to correctly isolate the impact these measures had on these variables because of macroeconomic developments on the home front and abroad. Against this backdrop, the research conducted by the Federal Reserve itself (Ammer et al., 2016) estimates that the overall impact of the package of expansionary monetary measures implemented between 2008 and 2015 caused significant dollar depreciation relative to the other currencies, coupled with growth in demand for goods and services produced abroad and a reduction in the yields on the sovereign bonds of other advanced economies. Quantitatively, the impacts via the trade and financial channels outweighed that of the exchange rate channel, so that US monetary policy had a net positive spillover effect abroad. More specifically, a persistent reduction in long-term interest rates of 0.25bp is estimated to increase US GDP by 0.6pp and the rest of the world’s GDP by 0.3pp over a three-year horizon.
The spillover effects of US monetary easing were not equal over time as the Federal Reserve continued to fine-tune the type of unconventional measures rolled out until 2014 on the basis of its unfolding assessment of the economic situation at each given point in time. Nor were they transmitted equally by country. In emerging economies, the spillover effect was affected by the significant changes in capital flows and cyclical and structural disparities (Bowman
et al., 2014). Further, in some countries, economic policy makers reacted in an attempt to prevent unwanted currency appreciation.
[9] However, among the developed economies, the spillover effect is believed to have been more homogeneous across the various countries, with the transmission more akin to that of “normal periods”.
[10]
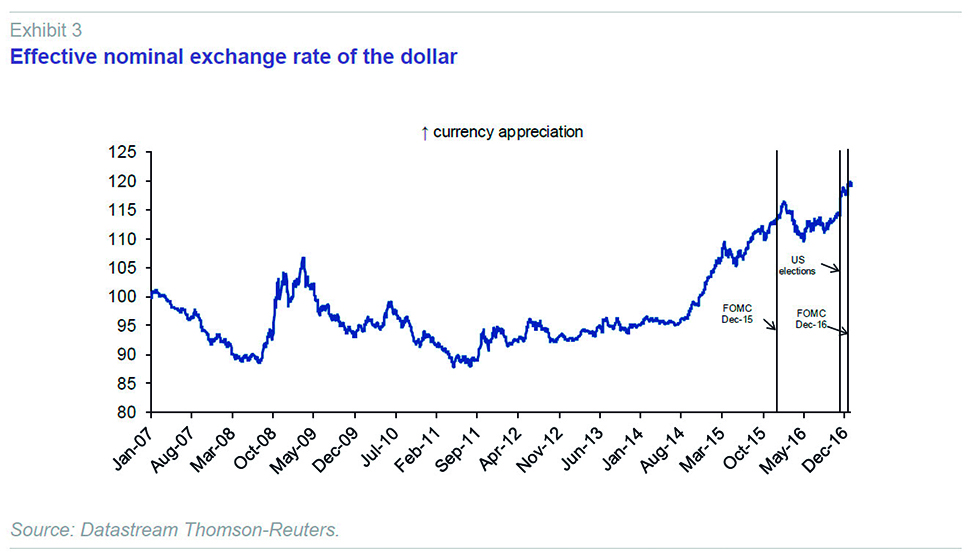
In December 2015, as already noted, the US started the normalisation of monetary conditions to those consistent with price stability and trend growth. To date, this monetary normalisation has driven dollar appreciation, reflecting the relative draw of dollar-denominated assets, in part due to the expectation that rates will be hiked on a staggered basis. Relative to a basket of currencies, the dollar appreciated by 26% between mid-2014 and the end of 2016 (4.5% in 2016), as shown in Exhibit 3. This increase in the value of the dollar affects the competitiveness of goods produced outside the US and, by extension, boosts GDP in the rest of the world.
Foreseeably, the positive exchange rate spillover on GDP in the rest of the world will be more than offset by the other two channels of transmission of US monetary tightening which have a negative impact: lower domestic demand in the US also reduces its demand for foreign goods and services; and the increase in interest rates has somewhat of a knock-on effect abroad by tightening financial conditions in other countries. Thus, rate tightening in the US can be expected to have a contractionary effect on global GDP. Although there is no definitive evidence about the scale of its effects on economic activity, research does tend to point out that the effects are usually more significant in emerging markets than in the advanced economies, particularly Europe (IMF, 2013).
Regardless, as outlined in the previous section, the current path of monetary normalisation is marked by idiosyncrasies that set it apart from earlier episodes. And the evidence suggests that its international transmission will also be unique on account of the circumstances affecting the developed economies in this instance. For example, during the 1994-96 tightening cycle, spillover via the financial channel was high. The impact on the asset markets was unexpected and significant: bond yields rose not only in Germany and the other eurozone nations but also in other markets such as the UK and Japan. This transmission took place at a time when most of these economies were at an early stage of recovery, there were no signs of inflation and monetary policies were expansionary. In contrast, during the period of monetary tightening of 2004-06, the upbeat macroeconomic prospects had the effect of dissipating uncertainty, which, coupled with surplus savings in emerging markets, drove long-term interest rates abnormally low (e.g., German bond yields). And instead of appreciating as expected, the dollar weakened. In the next section, we analyse the current cyclical and policy differences between the US and the other developed economies.
Global monetary outlook
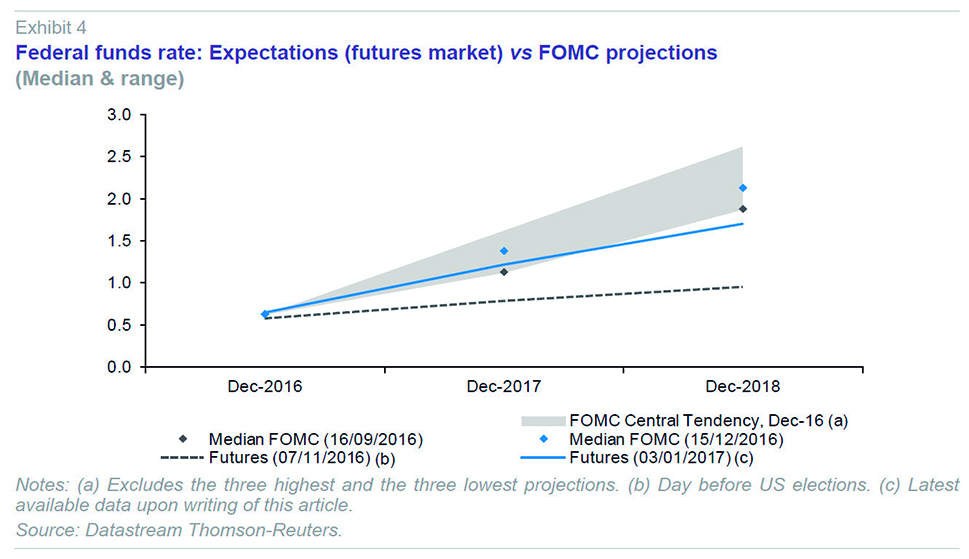
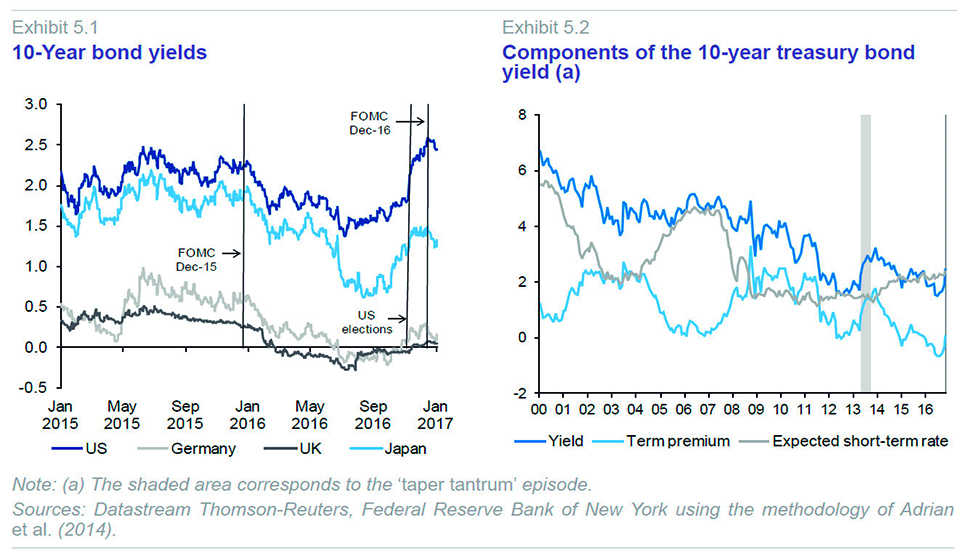
The outcome of the presidential and legislative elections held in the US on November 8th, which resulted in an unexpected victory for Donald Trump and majorities for the Republican Party in both the Senate and the House of Representatives, has changed the outlook for monetary policy in the US for the coming quarters, as is evident in the financial markets’ performance. As illustrated in Exhibit 4, the federal funds rate discounted in the futures market has shifted higher, approaching the projections made by the FOMC, which implicitly foresee a gradual recovery in real interest rates which are expected to reach 1% over the medium term. Similarly, government bond yields have risen, to a greater extent in the US but also in other developed economies (Exhibit 5.1), mainly driven by the spike in the term premium (Exhibit 5.2), as well as an upward shift in the yield curve. The currency markets have bid the dollar notably higher (Exhibit 3), particularly with respect to the yen among the developed world currencies and against the Mexican peso among emerging market currencies, to levels which mark a high since 2002 in nominal effective terms.
These financial market trends would appear to price in the materialisation of some of the proposals made by President Trump during his electoral campaign. Although many of them are notably vague, most observers have highlighted the changes foreshadowed in fiscal policy (more expansionary), trade policy (greater protectionism) and immigration policy (more belligerent towards immigrants). Many analysts agree that such changes in US economic policy could translate into a positive demand shock in the short term and a negative supply shock in the short and long term. In a nutshell, in terms of the Federal Reserve’s dual mandate, the changes would translate into a narrowing of the unemployment gap and higher inflation (already anticipated judging by the shift in inflation expectations calculated from the financial markets) and, by extension and in response, more restrictive monetary policy. If the Federal Reserve were indeed to take this path, the divergences between the various developed economies’ monetary policy stances would widen in the coming quarters.
The spillovers from the new policies applied in the US on other economies would likely be diverse in nature. Firstly, the short-term spike in growth, driven mainly by more expansionary fiscal policy, coupled with dollar appreciation, would boost exports by America’s trading partners. Greater protectionism would have adverse consequences at the global level by reducing trade flows; however, there would be winners and losers via the substitution of imports from the countries subjected to higher tariffs (Trump cited China and Mexico during his election campaign). Against this backdrop, the eurozone could benefit from higher US demand for its products and the euro depreciation against the dollar, which would also fuel inflationary pressures. However, the eurozone could also be affected by an increase in interest rates, as was the case during the episode known as the ‘taper tantrum’ of spring-summer 2013. On that occasion, some central banks, including the ECB, used communication and forward guidance to stave off unwanted US-driven tightening of financial conditions.
In 2016, the divergence between the monetary policies pursued by the Federal Reserve and the rest of the developed world’s most important central banks widened. As already noted, at its December 2016 meeting, the Federal Reserve decided to increase its target federal funds range by a quarter of a point (to 0.50%-0.75%), marking the second hike in the normalisation cycle initiated in December 2015. In addition, in its December quarterly projections, the FOMC projected a higher number of expected rate hikes in 2017 (three), as well as a slight increase in the neutral or natural rate of interest.
The ECB, meanwhile, announced
[11] the extension of its asset purchase programme (APP) for at least another nine months (from April to December 2017) after its November meeting, albeit scaling back the monthly purchase volumes (returning to the level of 60 billion euros it bought monthly between March 2015 and February 2016, before stepping its purchasing activity up to 80 billion euros from March 2016).
[12] In addition, the press release put out by the European Central Bank was adamant that this paring back in no way constitutes the start of monetary policy normalisation as the ECB’s inflation forecasts had not changed (remaining below target even in 2019) and that there is scope for stepping up the pace of purchasing or duration of the APP in the event of an economic downturn.
With the same objective of achieving its inflation target, the Bank of Japan announced a change in its monetary policy stance after its September meeting comprising a quantitative easing regime with ‘yield curve control’. The new orientation of its quantitative easing framework combines two elements: (i) yield curve control, keeping the short term rate at -0.1% for a portion of the bank deposits held at the central bank and calibrating its purchase of assets of various maturities in an attempt to keep 10-year rates at around 0%; and (ii) an inflation overshooting commitment under which the Bank of Japan commits to expand the monetary base until the year-on-year rate of CPI consistently exceeds 2%, with the aim of boosting inflation expectations.
In the wake of the Brexit victory in June, the Bank of England, meanwhile, took a series of measures at its August meeting designed to ease monetary policy in an attempt to mitigate the expected slowdown in the UK’s economy. Specifically, it cut its benchmark rate by 25bp to 0.25%, introduced a credit facility for banks called the Term Funding Scheme, embarked on the purchase of up to 10 billion pounds sterling of British corporate bonds and increased the stock of purchases under its Asset Purchase Facility by 60 billion pounds sterling to 435 billion. However, at its recent meetings, the Monetary Policy Committee has adopted a neutral stance on monetary policy for the time being, suggesting that it could go in any direction depending on how economic prospects unfold.
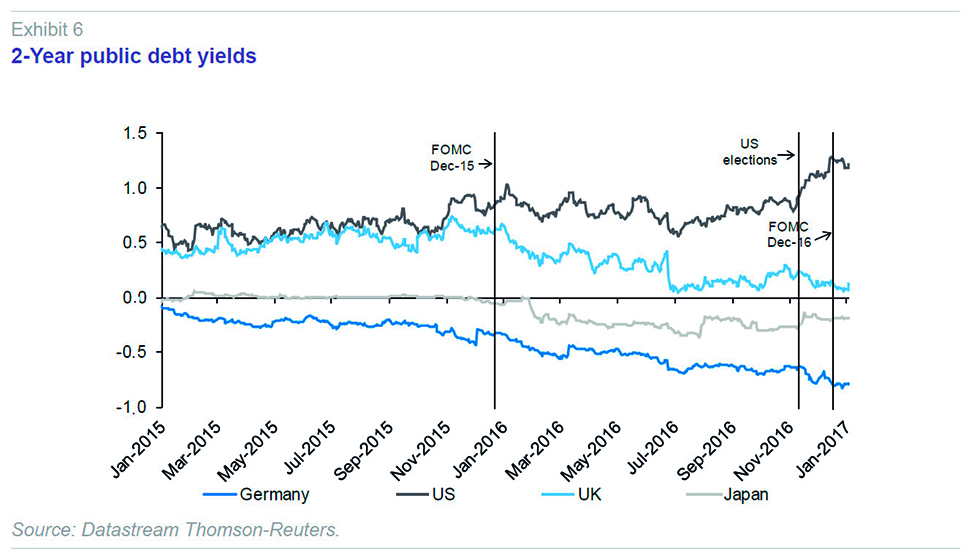
Increased monetary policy divergence between the Federal Reserve and the rest of the developed world’s most important central banks has translated into dollar appreciation and wider spreads at the short end of the yield curve (Exhibit 6), although in Germany the more recent contraction in short-term rates owes largely to the decision taken by the ECB’s Governing Council in December to broaden the spectrum of assets eligible for its APP to include securities with residual maturities of more than one year. In light of prevailing economic forecasts for the next two years, it is foreseeable that the current divergences will persist.
The challenge posed by a more restrictive monetary policy in the US has affected emerging market authorities, which are facing and will continue to face an economic scenario marked by lower net capital inflows, tighter financial conditions and currency depreciation at a time when some agents are indebted in dollars (balance sheet effect). These economies include China, whose authorities intervened in the currency markets in 2016, changed the currencies and their weightings in the basket used to establish the exchange rate and introduced certain capital controls to counter the downward pressure on the renminbi relative to the dollar. Mexico, where the authorities have reacted with pro-cyclical monetary and fiscal policies, is another case in point.
In sum, from the standpoint of the US, how the economic recovery and the new president’s fiscal policy play out will determine the shape of monetary tightening which is nevertheless expected to be far more gradual than on prior occasions. The desire to prevent sharp changes in the financial markets, particularly in long-term interest rates, inflation expectations and exchange rates, make it likely that the authorities in the rest of the world, particularly the central banks, will be able to respond to circumstances in their respective domestic economies without heightening global imbalances. Against this backdrop, one important lesson from the taper tantrum episode of 2013 was that effective communication and initiatives by the developed economies’ central banks, including the European Central Bank, helped to forge financial conditions to better suit their economic realities. This constitutes a risk at a time of heightened uncertainty regarding the pace of recovery and economic policy at the global level.
Notes
The FOMC specifies the inflation objective in terms of the general personal consumption expenditures (PCE) index, but pays particular attention to core PCE when considering monetary policy decisions. Core PCE excludes food and energy prices, which are more exposed to supply-side disruption (climate conditions and/or OPEC cartel decisions, for example), and are unrelated to the inflationary pressures driven by trends in demand and over which the FOMC has no control.
These inflation expectations refer to the consumer price index (CPI). Historically, the inflation rate calculated on the basis of the CPI has trended around 40bp above that calculated using the PCE index.
Economic theory holds that this interest rate varies over time, shaped by changes in economic agents’ preferences (discount rate), in technology and in the rate of population growth.
J. Yellen, symposium in Jackson Hole (August 2016) (http://www.federalreserve.gov/newsevents/speech/yellen20160826a.htm).
These authors use a multivariate model which factors in changes in inflation, GDP and interest rates.
Although the precise definition of a “safe financial asset” can vary, this category typically includes highly-liquid assets with a low probability of default and low exchange rate risk, such as the public debt securities of many developed economies’ sovereign issuers. In addition to facilitating financial transactions (by serving as collateral), safe assets are essential for highly risk-averse public and private investors such as pension funds and insurance companies. US Treasury bonds, on account of the breadth of supply and level of market development and depth, constitute the quintessential safe asset.
The term premium is defined as the compensation agents demand to invest in a fixed-income security over a long period rather than investing in shorter-term instruments (reinvesting over the remaining maturity of the longer-term instrument).
In reality, the concept of effective lower bound (ELB) has come to be used instead of ZLB, as in recent years several central banks, including the ECB, have set their official interest rates at negative levels, demonstrating that the cost of holding cash is greater than previously thought.
Bernanke (2015) talked about potential “currency wars” and the policy “trilemma” (exchange rate control; monetary policy independence; free capital flows) faced by the emerging markets’ monetary authorities during those years.
For example, Gilchrist et al. (2014) identify a similar spillover effect on sovereign bond yields during the period of unconventional monetary policy compared to the prior period of conventional policy, albeit marked by differences in transmission along the yield curve.
At its prior meeting in March, it had decided to introduce four quarterly financing facility (TLTROs II) auctions (between March 2016 and March 2017).
The ECB’s Governing Council also decided to expand the universe of securities it could purchase to include securities maturing within 12 to 24 months and those yielding less than the deposit facility rate.
References
ADRIAN, T.; CRUMP, R., and E. MOENCH (2014),
“Treasury term premia: 1961-present,” http://libertystreeteconomics.newyorkfed.org/2014/05/treasury-term-premia-1961-present.html#.VZ0mWM_tlBc.
AMMER, J.; DE POOTER, M.; ERCEG, C., and S. KAMIN (2016), “International Spillovers of Monetary Policy,” IFDP Notes, Board of Governors of the Federal Reserve System.
BERNANKE, B. (2005), “The Global Saving Glut and the U.S. Current Account Deficit,” speech given in Virginia.
— (2015), “Federal Reserve Policy in an International Context,” 16
th Jacques Pollack Annual Research Conference, IMF.
BOWMAN, D.; LONDONO, J. M., and H. SAPRIZA (2014), “U.S. Unconventional Monetary Policy and Transmission to Emerging Market Economies,”
Journal of International Money and Finance.CABALLERO, R. J., and E. FARHI i (2016), “The Safety Trap,” mimeo.
CHUNG, H.; LAFORTE, J. P.; REIFSCHNEIDER, D., and J. WILLIAMS (2011), “Have we underestimated the likelihood and severity of zero lower bound events?”, Federal Reserve Bank of San Francisco
Working Paper,
2011-01.
EVANS, C.; FISHER, J.; GOURIO, F., and S. KRANE (2015), “Risk management for monetary policy near the zero lower bound,”
Brookings Papers on Economic Activity.
INTERNATIONAL MONETARY FUND (2013), Unconventional monetary policies – Recent experiences and prospects,
IMF Policy Papers.
— (2015),
2015 Spillover Report.
GILCHRIST, S.; YUE, V., and E. ZAKRAJSEK (2014),
US Monetary Policy and Foreign Bond Yields, mimeo, Federal Reserve Board of Governors.
HAMILTON, J.; HARRIS, E.; HATZIUS, J., and K. WEST (2015), “The equilibrium real funds rate: past, present and future”, U.S. Monetary Policy Forum.
LAUBACH, T., and J. WILLIAMS (2016), “Measuring the natural rate of interest redux,”
Business Economics, upcoming publication.
REY, H, (2013), “Dilemma not trilemma: the global financial cycle and monetary policy independence,” Proceedings - Economic Policy Symposium - Jackson Hole, Federal Reserve of Kansas City Economic Symposium, pages 285-333.
SUMMERS, L. (2014), “U.S. economic prospects: secular stagnation, hysteresis, and the zero lower bound,”
Business Economics, vol. 49: 65-73.
TAYLOR, JOHN B. (1999), “A historical analysis of monetary policy rules,”
Monetary Policy Rules, University of Chicago Press: 319-348.
Juan Carlos Berganza and Javier Vallés. Bank of Spain