The evolution of Spain’s high-tech exports through 2023
Spain’s high-tech product export intensity ranked sixteenth in the EU-27 in 2022, which is a considerable improvement from its position between 2014 and 2018. Given the role played by the high-tech manufacturing industry in unlocking sustained competitiveness gains, strategies are needed to further improve Spain’s recent achievements in this area and to start to close the technology gap with other countries.
Abstract: Spain’s high-tech product export intensity ranked sixteenth in the EU-27 in 2022, which is a considerable improvement from its position between 2014 and 2018. Despite this recent convergence with the EU, Spain’s trade deficit in this product category has widened to €16.8 billion in 2023. The biggest contributor to that deficit was the electronics-telecommunications sector (deficit of 11.1 billion euros), followed by computers-office machinery and scientific instruments. Elsewhere, of the sectors reporting a surplus, the largest was less than €700 million. The best performers in that respect were the armament, non-electrical machinery, aerospace and pharmaceuticals sectors. In the latter sector, export volumes to Belgium between 2021-2023 were very significant, yet atypical. Given the role played by the high-tech manufacturing industry in unlocking sustained competitiveness gains, strategies are needed to further improve Spain’s recent achievements in this area and to start to close the technology gap with other countries.
Foreword
The linkage between exports of high-tech products and economic growth has been clearly established (Falck, 2009), with interest in what determines these exports increasing of late. Sepehrdoust et al. (2021) analyse the influence of scientific productivity; Özsoy et al. (2022) emphasise the use of information and communication technologies; Navarro Zapata et al. (2022) find positive impacts associated with a series of factors linked to the knowledge economy; Adbullah et al. (2023) highlight the positive impact of participating in global value chains; and Manzetti and Osang (2024) focus their work on studying the impact of government effectiveness, regulatory stability and the rule of law.
This issue is also relevant for economic policy. Mario Draghi’s recent report on the outlook for competitiveness in the EU concludes that the lack of innovation clusters (made up of universities, large companies, start-ups and venture capitalists) devoted to fostering the sale of high-tech products is one of the barriers holding the EU back from lifting its competitiveness (Draghi, 2024, p. 25). Exports of high-tech products can be seen as a good proxy for the existence and effectiveness of those clusters.
With the aim of contributing to this debate, this paper provides the most recent data for Spanish exports of high-tech products, carrying on from earlier studies but also providing new analyses with respect previous papers (Xifré, 2014, 2018, 2020, 2023).
It relies on the high-tech sector definitions provided by the OECD and Eurostat, specifically nine sectors: aerospace, armament, chemistry, computers and office machinery, electrical machinery, electronics-telecommunications, non-electrical machinery, pharmaceuticals and scientific instruments. The annex to this paper provides the detailed composition of the above nine sectors using the SITC Rev. 4 classification.
[1] It also uses two Eurostat sources. Firstly, the statistics that measure the share of total exports commanded by high-tech products (export intensity). Secondly, and for much of the underlying analysis, duly-processes microdata taken from COMEXT, which provides disaggregated international trade figures (six-digit disaggregation of the Harmonised System).
High-tech export intensity relative to the EU
Exhibit 1 provides the share of high-tech product exports in total goods exports for the EU member states for 2014, 2018 and 2022 (the most recent year for which this information is available). In 2022, Spain ranked sixteenth on this list, with an intensity of 8.46%. That position, while in the bottom half of the ranking, marks considerable progress from 2018 (#25 | intensity of 5.5%) and 2014 (#24 | intensity of 5.1%). For further context, note that the EU as a whole has been gradually increasing its high-tech export intensity, from 15.3% in 2014 to 17.3% in 2022.
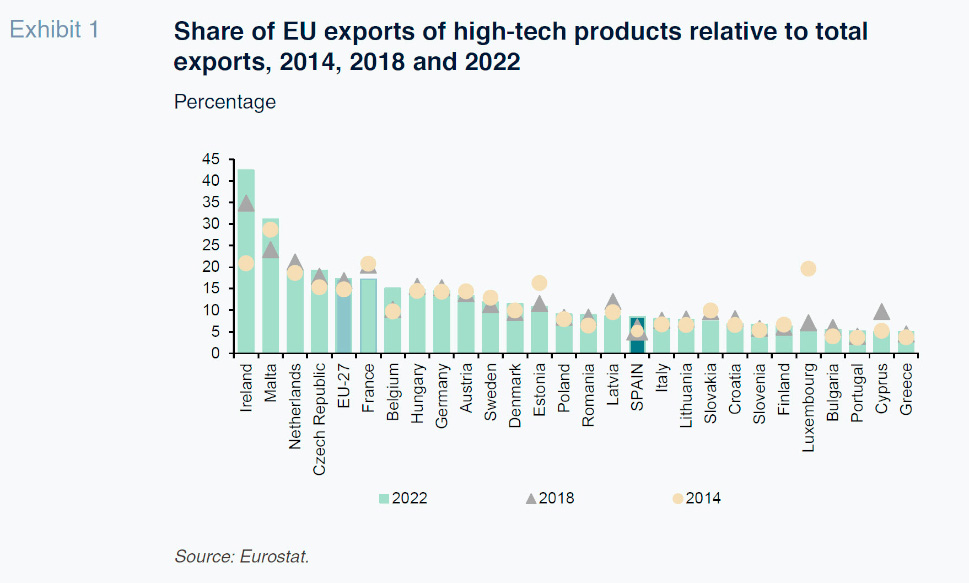
At the top of the list in 2022 are two small-sized economies (Ireland and Malta). The highest-ranked economy of considerable size is the Netherlands, which has managed to keep its export intensity at 20% in all three years analysed. Germany presents an even more stable profile, with high-tech products accounting for an almost fixed share of total exports of 15%. France has always ranked ahead of Spain and Italy was also ahead in 2014 and 2018; in 2022, however, Spain overtook Italy by one spot.
Net balance of Spanish high-tech exports
Exhibit 2 shows Spanish exports and imports and the net balance of trade in high-tech products between 2013 and 2023. The source of the data analysed from here on is the disaggregated data taken from Eurostat’s COMEXT database.
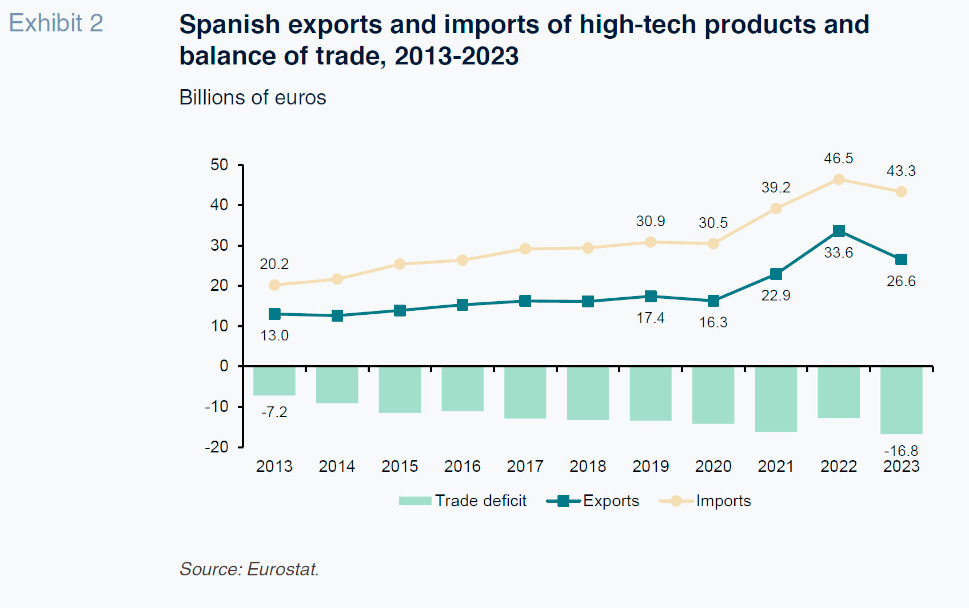
It shows that the balance of trade in high-tech products has been negative throughout the period analysed, and increasingly so with time. The deficit has more than doubled since 2013, from 7.2 billion euros to 16.8 billion euros in 2023. In the series analysed, both exports and imports increased subsequent to the pandemic, in 2021 and 2022, to well above the pre-pandemic trendline. 2023, on the other hand, was marked by the largest drop of the entire series in both flows, probably reflecting a correction process following the atypical increases in the two previous years.
Exhibit 3 breaks down the aggregate Spanish trade deficit in high-tech products into the main product categories for 2013-2023 and Exhibit 4 breaks down exports and imports in 2023 for all the product groups, in descending order of value of exports.
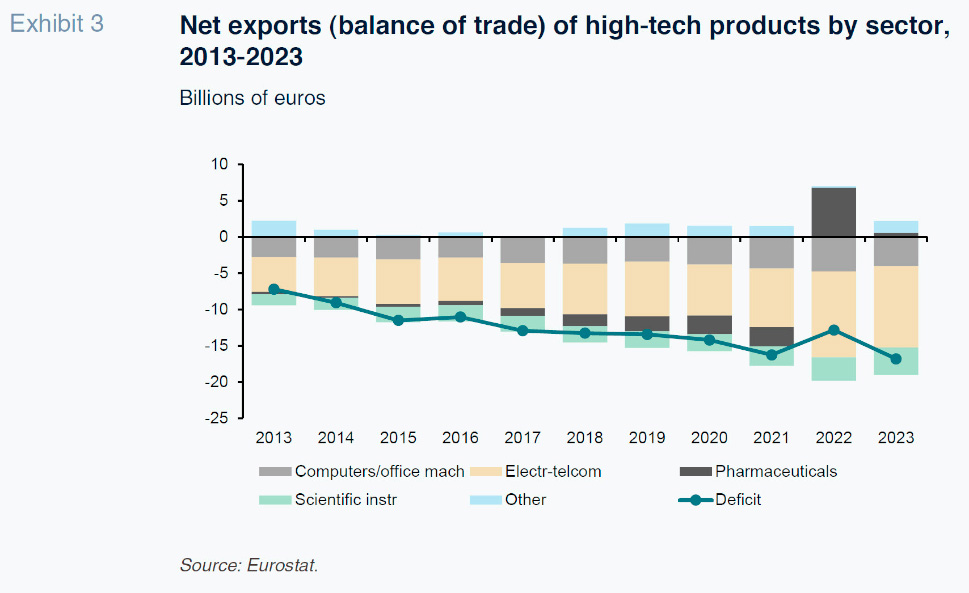
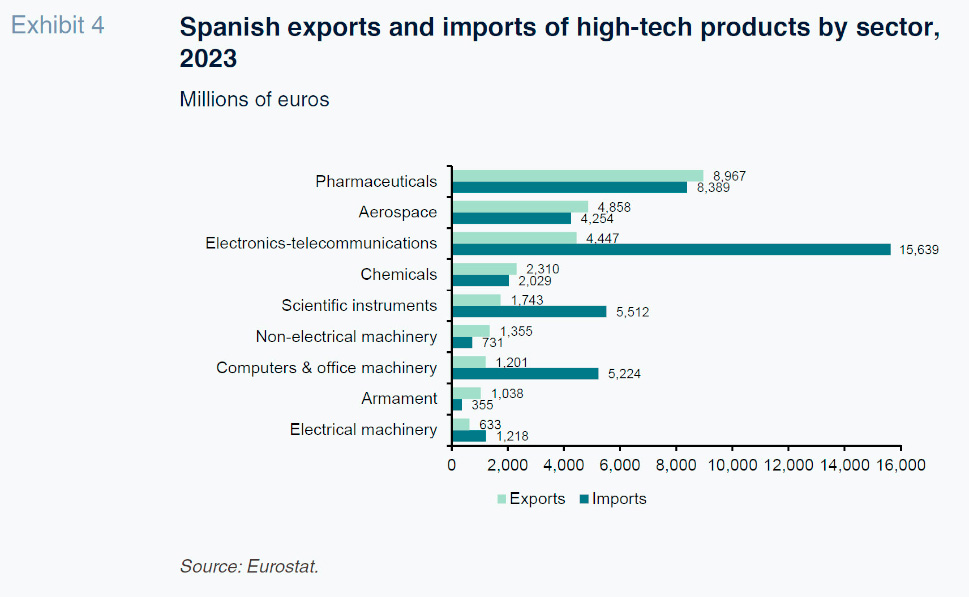
Both exhibits show that the sector responsible for the bulk of the overall deficit is electronics-telecommunications, whose deficit has jumped from 4.8 billion euros in 2013 to 11.1 billion euros in 2023, accounting for two-thirds of the total deficit that year. The next biggest contributors to the overall deficit in 2023 were computers and office machinery (deficit of 4 billion euros) and scientific instruments (3.7 billion euros).
Turning to the sectors that reported a surplus, none of them managed to generate a surplus of more than 700 million euros. The four best-performing segments were armament (683 million euros), followed by non-electrical machinery (624 million euros), aerospace (603 million euros) and pharmaceuticals (577 million euros). The other sector to record a surplus, albeit much lower, was chemicals (281 million euros).
The trend depicted by Exhibit 3 reveals the pharmaceuticals sector as an outlier in 2022, when it recorded a surplus of 6.79 billion euros, in contrast to systematic deficits between 2013 and 2021 and a modest surplus of 579 million euros in 2023. We will analyse this phenomenon further on.
Geographical concentration of exports and imports
Exhibit 5 represents, for 2023, Spanish exports of high-tech products to the top 20 destination markets as bars, with a line depicting the cumulative share from the top destination to the country in question relative to total exports.
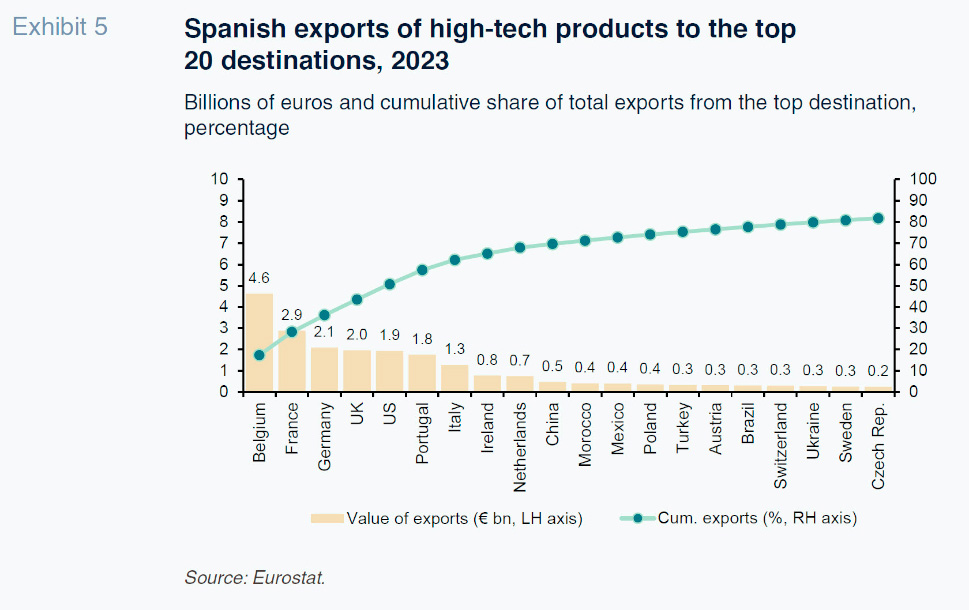
The six largest markets account for almost 60% of total Spanish high-tech exports. Notably, Belgium ranks first, with a share of 17.4% of the total, followed by France (with nearly 11%) and Germany (almost 8%). In fact, seven of the top nine destinations are EU member states (the other two being the UK and US). As a whole, the top 20 destinations account for close to 82% of total high-tech exports.
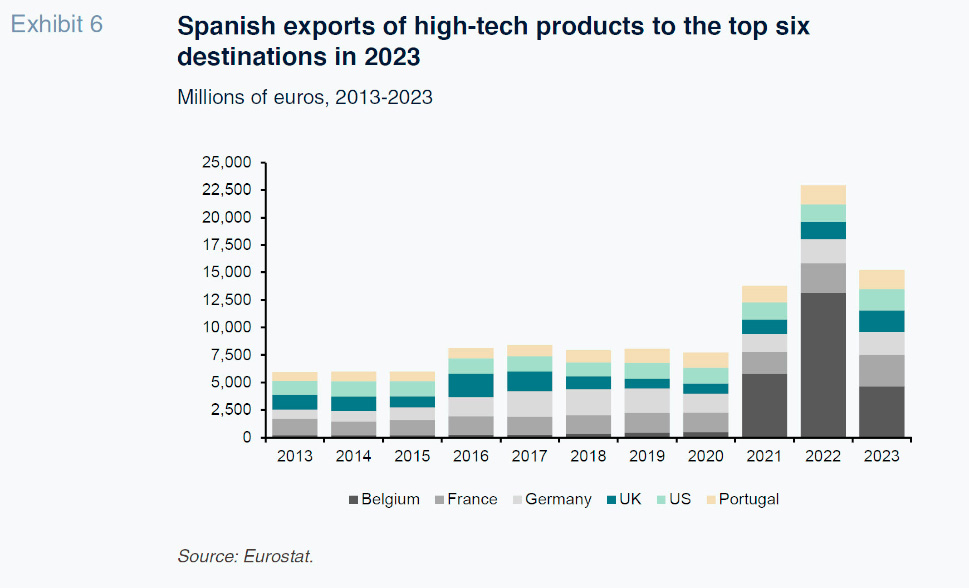
Focusing on the top six destinations in 2023 (Belgium, France, Germany, the UK, US and Portugal), Exhibit 6 shows Spanish exports to these markets between 2013 and 2023. Between 2013 and 2020, Spain’s most important markets were France and Germany. Belgium bursts onto the scene, without precedent, in 2021 (5.79 billion euros), outperforming all the other markets in 2022 (13.16 billion euros) and remaining the number one destination in 2023 (4.62 billion euros).
Detailed analysis of the growth in exports to Belgium reveals that the pharmaceuticals sector is behind the trend. Exhibit 7 shows exports of Spanish pharmaceuticals products to Belgium between 2019 and 2023.
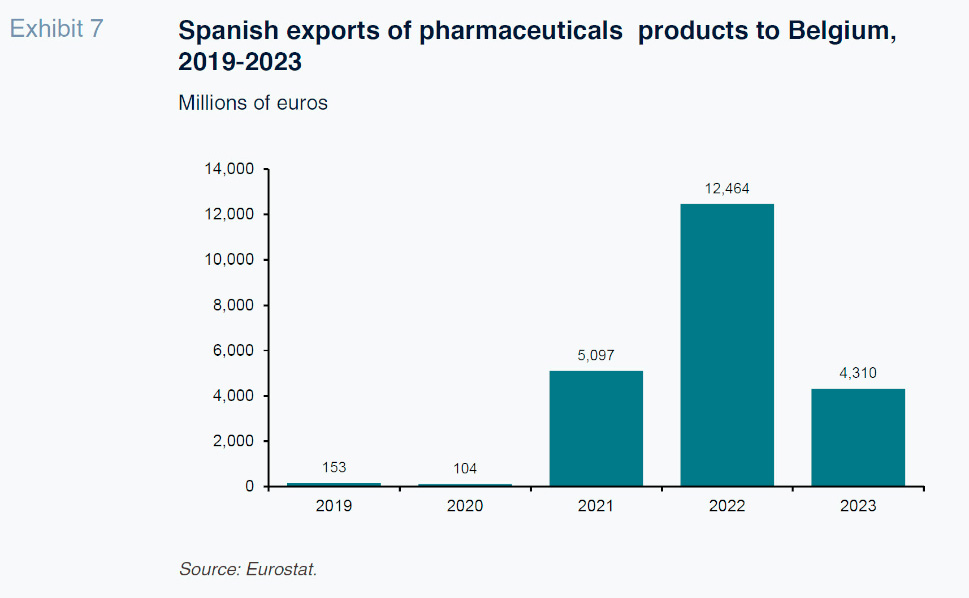
If we relate the figures in Exhibit 7 with those in Exhibit 2, we observe that an atypical and extremely high share of Spanish high-tech exports worldwide is accounted for by exports of pharmaceuticals products to Belgium. In 2022, this sector-country combination alone accounted for 37% of total high-tech exports (22% in 2021 and 16% in 2023). Although the reasons for this atypical pattern need to be studied in greater detail, it is reasonable to assume that it is not derived solely from satisfying Belgian demand for Spanish pharmaceuticals products but rather has more to do with some form of reallocation of productive activity in this sector.
To round out the analysis, we look at the concentration of Spanish imports of high-tech products. Exhibit 8 is analogous to Exhibit 5 but represents the value of imports. It shows that Spanish high-tech imports are even more concentrated than its exports, with the top six markets of origin (Netherlands, Germany, China, the US, Italy and France) accounting for nearly 70% of the total.
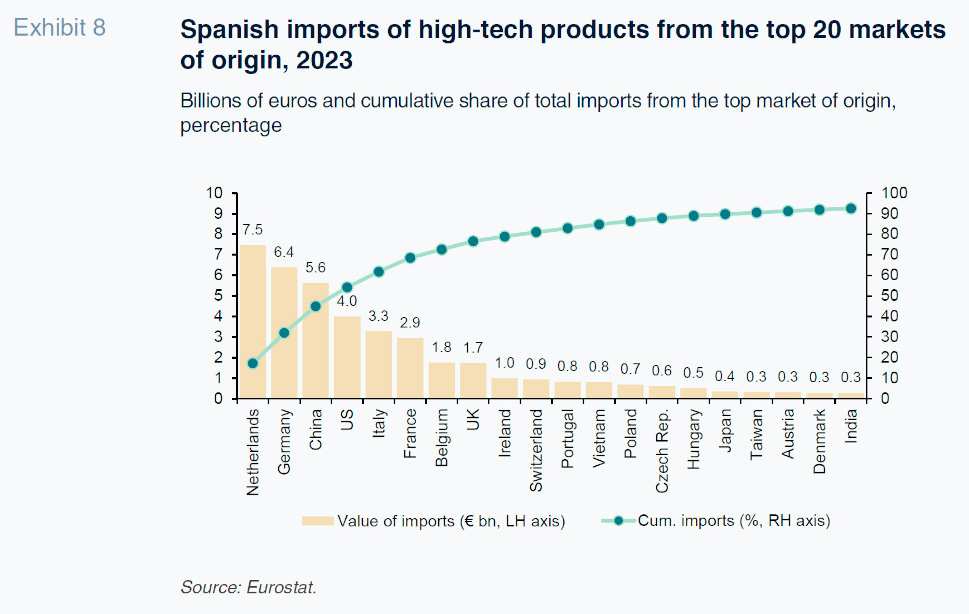
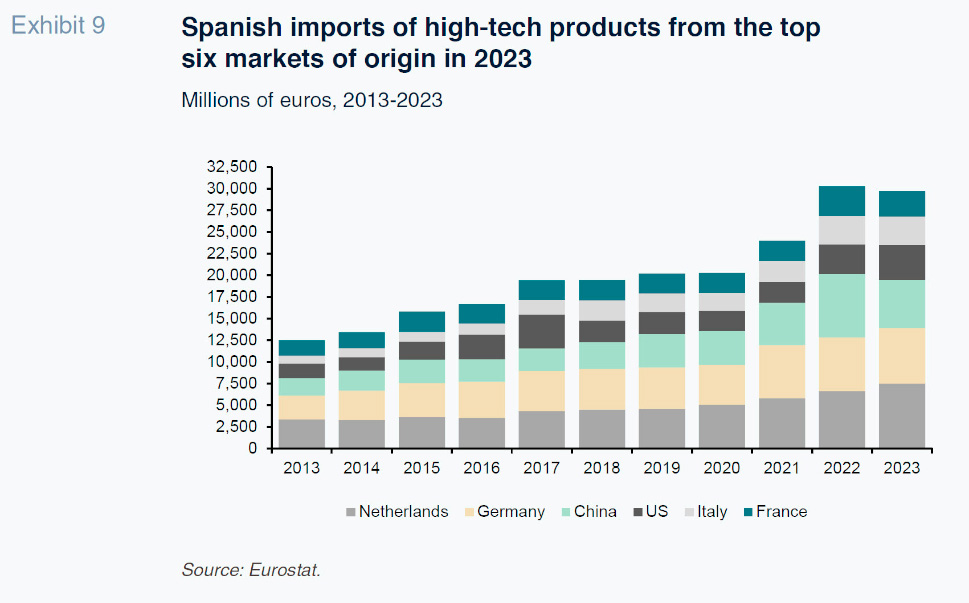
Exhibit 9 is in turn the mirror of Exhibit 6, presenting Spanish imports from the top six markets of origin. It reveals a more stable geographical pattern in imports than in exports. In 10 of the 11 years analysed, the main source of Spanish imports was the Netherlands, followed by Germany and then by China. 2022 was the exception. That year, China was the main source of Spanish high-tech imports (7.31 billion euros), with electronics-telecommunications accounting for the bulk of that flow.
Conclusions
Exports of technological products, beyond their direct impact on wealth generation and progress, are a very good proxy for the health of the innovation ecosystem, or innovation clusters, in a country. To be able to export technological products, a company has to be able to complete the entire technology and innovation cycle: access to basic science, ability to adapt innovations and sufficient knowledge of the international markets for these niche products.
From that perspective, an analysis of the trend between 2013 and 2023 yields ambivalent results. On the one hand, Spain has converged considerably towards the rest of the EU-27 in terms of the technological intensity of its exports. Having ranked towards the very bottom of the bloc’s ranking in 2014 and 2018, it climbed to the sixteenth position by 2022. However, these positive outcomes are overshadowed by a growing trade deficit in high-tech products: year after year, Spain is becoming more dependent on technology imports. This dependence is particularly pronounced in electronics-telecommunications, computers and office machinery and scientific instruments. On the other hand, Spain is presenting modest surpluses in the armament, non-electrical machinery, aerospace and pharmaceuticals sectors, in the latter instance due to an anomalous increase in exports to Belgium.
As recently underlined by Mario Draghi (Draghi, 2024), investment in technology and productivity gains are critical to maintaining the European social model and, perhaps even the EU’s very survival. In his report, Draghi proposes several specific measures, some of which target technology sectors in which Spain comes up short. Moreover, a country needs to have cross-cutting policies to foster education, R&D investment stability and better regulations, for sector-specific policies to be more effective. Although we face some truly important challenges, we have well-calibrated assessments and recommendations to turn to.
Notes
References
ADDULLAH, A., IBRAHIM AVSAR, I., and TURAN, T. (2023). Does global value chain participation boost high technology exports?
Journal of International Development, 35, 820-837.
DRAGHI, M. (2024). The future of European competitiveness. Part A. A competitiveness strategy for Europe. European Commission.
FALCK, M. (2009). High-tech exports and economic growth in industrialized countries.
Applied Economics Letters, 16, 1025-1028.
MANZETTI, L., and OSANG, T. (2024). High-Tech Exports and Governance Institutions.
PS: Political Science & Politics, 57(3), 346–355.
NAVARRO ZAPATA, A., ARRAZOLA, M., and DE HEVIA, J. (2022). Determinants of High-tech Exports: New Evidence from OECD Countries.
Journal of the Knowledge Economy, 15, 1103-1117.
ÖZSOY, S., ŞEHVEZ ERGÜZEL, O., YAGMUR ERSOY, A., and SAYGILI, M. (2022). The impact of digitalization on export of high technology products: A panel data approach.
The Journal of International Trade & Economic Development, 31(2), 277-298.
SEPEHRDOUST, H., TARTAR, M., and DAVARIKISH, R. (2021). Does scientific productivity stimulate intensified technology exports in developing economies.
Journal of Knowledge Economy, 12, 2111–2135.
XIFRÉ, R. (2014). Four years of economic policy reforms in Spain: An analysis of results from an EU perspective.
Spanish and International Economic and Financial Outlook, Vol. 3, No. 5, 5-13.
https://www.funcas.es/wp-content/uploads/Migracion/Articulos/FUNCAS_SEFO/015art02.pdfXIFRÉ, R. (2018). Spanish Investment in R&D+i in the wake of the crisis: Public versus private sectors.
Spanish and International Economic and Financial Outlook, Vol. 7, No. 4, 67-79.
https://www.funcas.es/wp-content/uploads/Migracion/Publicaciones/PDF/2123.pdfXIFRÉ, R. (2020). Spanish high-tech exports.
Spanish Economic and Financial Outlook, Vol. 9, No. 4, 61-68.
https://www.funcas.es/wp-content/uploads/2020/08/SEFO_n50.pdfXIFRÉ, R. (2023). Industrial policy in the EU and Spain: Recent debates.
Spanish Economic and Financial Outlook, Vol. 12, No. 4, 55-62.
https://www.sefofuncas.com/Spain-Economic-and-fiscal-outlook/Industrial-policy-in-the-EU-and-Spain-Recent-debates
Ramon Xifré. IQS School of Management, Universitat Ramon Llull