
Rising consumption, but not without risks
Household consumption has rebounded very significantly since the start of the recovery in 2014. But the simultaneous drop in savings poses an important vulnerability in adverse scenarios.
Abstract: As the financial health of households continues to improve, household consumption too is growing at an elevated rate. However, while GDP is now back at pre-crisis levels, household spending still remains below its 2008 peak. The short-term outlook for consumption is favourable and households look set to continue increasing their expenditures, supported by some residual pent up demand following the drop in durables consumption between 2008 and 2013. However, household consumption remains dependent on income growth and confidence to sustain momentum. A deterioration in these fundamentals could endanger the medium-term sustainability of household consumption growth. At the same time, the drop in household savings rate, at its lowest level since 2006, puts Spanish households in a vulnerable position at a time of rising inflation and monetary policy normalisation.
Introduction
The financial situation of Spanish households continues to improve, facilitating the ongoing recovery in private consumption. This is occurring against the backdrop of an entrenchment of economic recovery driven by lax monetary policy, an improvement in the global environment and oil price developments.
The pick up in consumption in recent years has been underpinned by a recovery in fundamentals. Household income has revived on the back of strong job creation. Meanwhile, consumer confidence is above pre-crisis peaks. Households have also benefited from a recovery in the price of their financial assets and, more recently, have begun to see their real estate assets regain value as well. Finally, the low interest rate environment has created incentives for consumption to the detriment of savings.
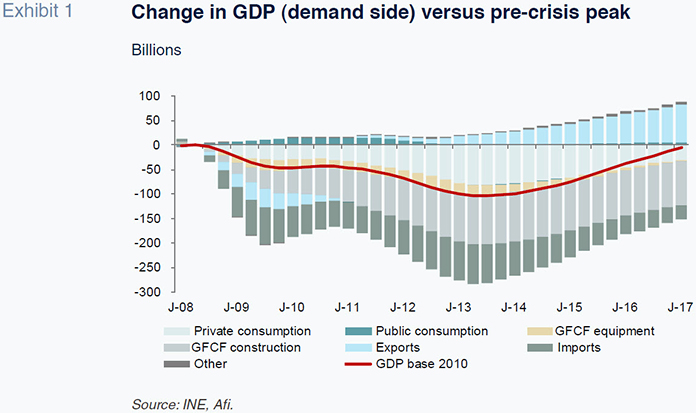
Thus, consumption has been an undeniable driver of the economic recovery, accounting for 60% of GDP growth over the last three years. Even so, close to ten years after the start of the crisis and with GDP now back at pre-crisis levels, household consumption still remains around 5% below its second quarter of 2008 peak. This disparity is explained by the changes that have taken place in the profile of aggregate demand, with domestic demand losing relative weight.
GDP amounted to 282 billion euros in the second quarter of 2008 – on a 2010 constant price basis – reaching a record annualised high of 1.12 trillion euros in the third quarter of the year. However, having essentially recovered the same level of GDP in the second quarter of 2017, the contribution from household consumption to aggregate demand remains some 30 billion euros below its pre-crisis level. This is because wage remuneration remains the main source of household income and the number of full-time equivalent employees is still around 2.2 million below third quarter 2008 levels.
The improvement in household disposable income is largely based on employment creation
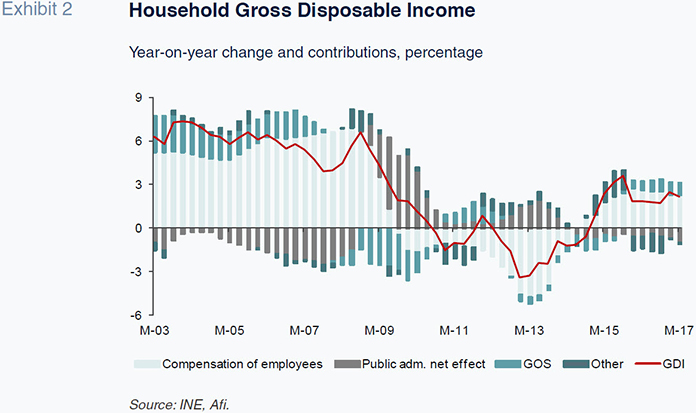
Household income is one of the main determinants of household spending. In this regard, household income improved in 2016, registering growth of 2.5%
[1] after 1.9% in the previous year. Together with a negative inflation rate of -0.2% for the year as whole, this helped bring about a third consecutive year of improvements in household purchasing power. However, the sharp spike in inflation at the start of 2017 dampened growth in Gross Disposable Income (GDI), which slowed to 1.5% in real terms. This trend could continue over the coming quarters.
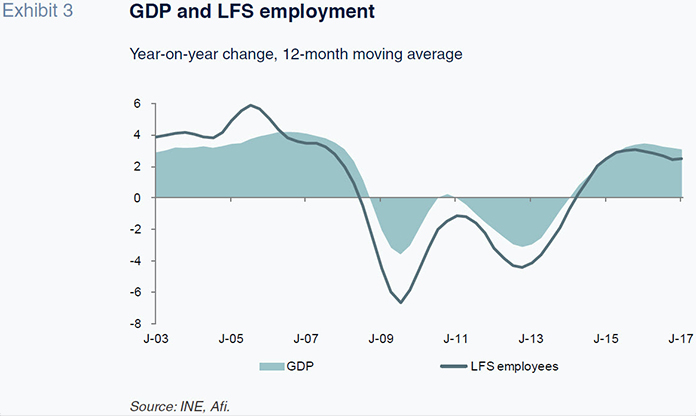
The exceptional increase in employment remains crucial to the recovery in household income. Over the last three years, LFS employment has increased by nearly 1.8 million, reaching 18.8 million at the end of the second quarter of 2017 (compared to a record high of 20.8 million in the third quarter of 2007), and employment has continued to rise at an average rate of over 2.5% year-on-year over the last twelve months.
However, even after this significant increase in employment, labour market slack remains considerable. The unemployment rate has fallen by nearly 9 percentage points from peak to the current rate of 17.2%, closing in on structural levels (between 14-16% depending on the estimate). But, considering other labour market imbalances, such as discouraged and inactive individuals wanting but not actually looking for work, as well as people working part-time involuntarily, the labour underutilisation rate
[2] comes in at nearly 29% of the active population.
Labour market slack, together with other factors, such as scant productivity growth, low inflation expectations and certain structural changes in relation to wage bargaining power, is behind the anaemic growth in wages since the start of the recovery. Wage remuneration per salary-earner increased by 0.2% in real terms in 2016. However, the pick up in inflation at the start of 2017 has pushed real wage growth back into negative territory (-0.2% in the first quarter of the year).
In recent years, rising employment – as opposed to wages – has been the main factor driving the increase in overall wage earner remuneration which remains the principal contributor to household income (accounting for around 75% of GDI). Looking forward, increasing wages should compensate a degree of slowdown in employment creation as labour market slack begins to diminish, until that materialises, it is conceivable that wage remuneration will make a smaller contribution to household income growth.
Income from Gross Operating Surplus (GOS), i.e. income from business activity, is the second most important component of household GDI, representing around 25% of the total. The improvement in economic activity began to feed through to households in 2015 and increased in 2016, with GOS growing by 3.7% after rising by 2.2% the previous year. However, GOS growth may now have reached a ceiling and, as the economy begins to slow towards potential growth rates (estimated at around 1.5-2%), the contribution from business income could do the same thing.
In terms of the other components of GDI, public administrations continue to have an overall net draining effect on household income due to larger increases in taxes and social contributions relative to the transfers received from the state. Tax payments and contributions have been on the rise over the last year as a proportion of GDI and now account for around 34.4%, above the historical average. In terms of property income, both interest income and payments continue to decline and are now at record lows (interest income accounts for 1.1% of GDI, some 7 billion euros, while payments are 0.9%, around 6 billion euros). The possible normalisation of monetary policy over the coming years will begin to reverse this trend.
Overall, the increase in household income in recent years has been underpinned primarily by strong job creation and the improvement in economic activity. However, it is possible that these factors will begin to lose steam over the coming quarters and thus household income growth could also moderate.
The increase in household wealth – both property and financial – is another factor supporting rising consumption
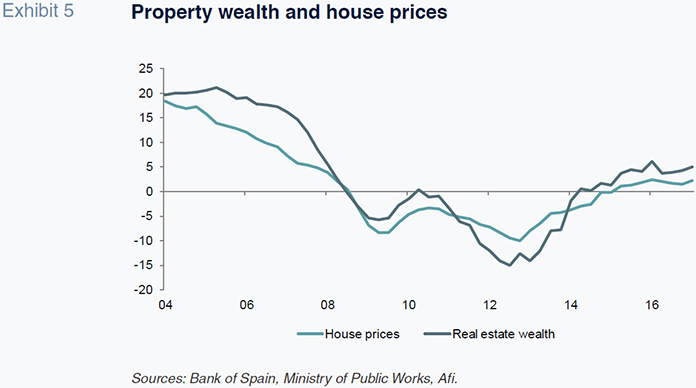
Household wealth continues to grow (5.8% year-on-year in the first quarter of 2017) reaching 540% of GDP, thanks primarily to increases in property wealth (+5ppts to 421% of GDP). Recovering real estate prices, especially housing – the main household investment asset – are behind this increase in property wealth. Non-state subsidised house prices increased by 2% in 2016 and continued growing at the same pace in the first quarter of the year. The recovery in house prices follow various years of significant adjustment in a sector which to a large extent amplified the effects of the crisis.
Households have seen the value of their real estate assets increase consistently since 2013, which at the same time is driving household investment in real estate. Nominal investment grew by almost 15% in the first quarter of the year (5.5% in 2016) and accordingly the sector’s financing capacity stands at 1.2% of GDP, a minimum since 2010. However, to put this in context, the overall rate of household investment remains around 5% of household GDI, approximately half the pre-crisis average.
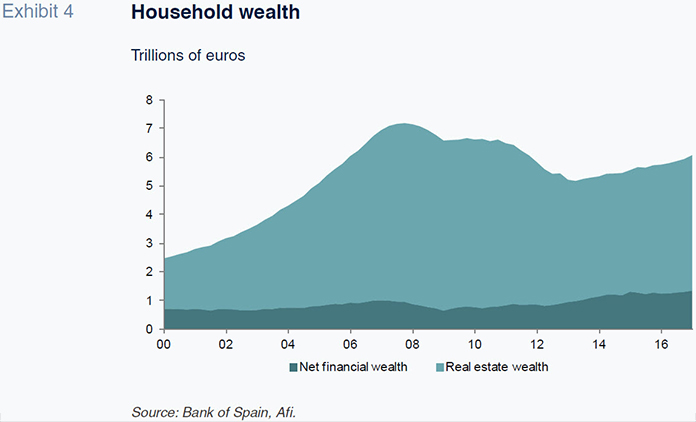
In addition to real estate wealth, household net financial wealth has also performed well of late. Net investment flows reached 2.4% of GDP in the twelve months to the first quarter of 2017. As a result, the stock of net financial assets is now at a record high of 1.3 trillion euros (119% GDP).
Since the start of the crisis, households have focused their investment primarily in equities, particularly mutual funds, as well as insurance and pension funds. Furthermore, the environment of low interest rates, especially on bank deposits, has had a significant impact on Spanish households, who have traditionally held a significant proportion of their financial assets in deposits. As a result, there has been a substitution away from time deposits to sight deposits.
More rapid consumption growth relative to household income has pushed the household savings rate downward
In recent years, household consumption has grown in line with fundamentals. However, consumption is currently ticking along at almost double GDI growth (consumption grew by 2.7% year-on-year on average over the last twelve months, compared to 1.5% growth in real GDI) meaning that households have begun to draw down savings as well as seek external financing to maintain their level of spending. The faster rate of growth of consumption relative to income is explained by the remnants of pent up demand –illustrated by the increase in consumer durables since the start of the recovery, following major retrenchment during the crisis.
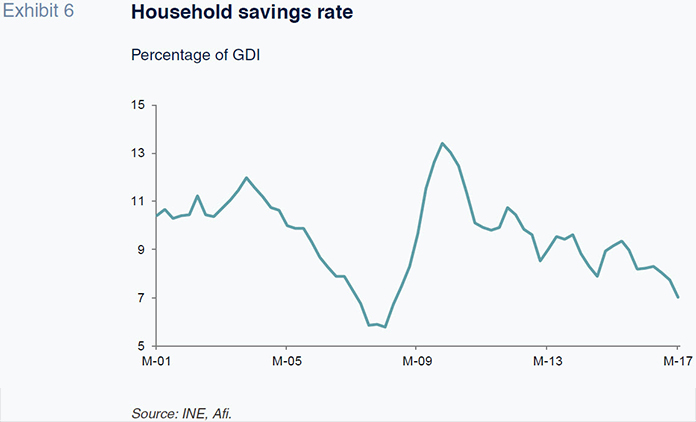
The downward trend in the savings rate since 2010 has become more pronounced of late, potentially jeopardising the sustainability of medium-term household consumption. In contrast to previous years, which saw an increase in income lead to a concurrent rise in savings and consumption, in recent quarters, income growth is no longer proving compatible with a pick up in savings. Thus, the household savings rate continued tracking down in the first quarter of the year to reach 7% of GDI, significantly below the historical average of 9.5% and the euro area average of 12.3%. Spanish households’ rates of saving are now the lowest among neighbouring economies, far below German (17%) and French (14%) households, putting Spanish households in a more vulnerable position at a time of rising inflation and monetary policy normalisation.
Beyond weak household income growth, various factors explain the reduction in the savings rate. Increased consumer confidence (which reached a peak in 2015 and has remained at a high level) together with less uncertainty regarding the current and future economic outlook, have likely reduced households’ precautionary saving. Concerns about the future were the main reason for the jump in household savings between 2009 and 2011, which pushed the savings rate to a peak of 13%.
The low interest rate environment is another factor dissuading households from saving and increasing the propensity to consume. Furthermore, it has helped facilitate household deleveraging. Household debt levels have now fallen to 713 billion euros which is a similar level to ten years ago and the equivalent of 64% of GDP. This is the lowest since the second quarter of 2005 and is closing in on the euro area average (59% of GDP). Accordingly, households’ deleveraging needs are diminishing, and with that the requirement to put money aside in order to service debt payments. With deleveraging now well underway, the low cost of taking on debt has served as an incentive to finance household spending. New consumer lending rose by 28% in 2016 to 25.4 billion euros. Though still low in absolute terms, new lending has continued to grow in the first half of 2017. The easing of lending conditions in recent years is allowing both part of consumption to be financed by credit, while simultaneously sustaining the household deleveraging process.
In summary, given the favourable economic outlook, households are increasing consumption above income growth, resorting increasingly to savings and external financing. In so doing they are smoothing their consumption over time. However, this situation may not prove sustainable over the medium-term, since consumption should ultimately mirror household income developments.
Conclusion
The financial health of households continues to improve and accordingly household consumption grew at elevated rates of close to 2.7% last year. Income growth, supported by vibrant job creation (nearly 1.7 million new jobs since the start of the recovery) and the improvement in economic activity, has been the key factor in driving household demand for goods. This is especially the case for goods, such as cars and household appliances, whose purchases were delayed during the crisis. But it is not only income growth that has been of support, household wealth has also grown robustly since 2013. Household wealth initially benefited from the recovery in asset prices which, together with the deleveraging process undertaken by households in recent years, has enabled net financial wealth to reach record highs. More recently, the pick up in house prices – households’ main investment asset – has served as a major boost to property wealth.
However, consumption is now growing faster than income and while some divergences can take place over the short-term, in the medium-run consumption ought to move in line with household income. As a consequence of the current imbalance, the household savings rate has dropped to 7% – its lowest since 2006 – which poses a potential vulnerability in adverse scenarios.
In order to maintain private consumption growth over the medium-term, the fundamentals underpinning consumption need to be sustained. This speaks of a need for wage increases to prop up household income, especially as labour market slack begins to dissipate.
Notes
Data from the Quarterly non-financial accounts for the Institutional Sectors are presented on a rolling four-quarter basis to adjust for seasonal effects.
This approach to measuring unemployment is commonly known as the labour underutilisation rate and is one of the measures typically used by the U.S. administration.
References
BANK OF SPAIN (2017), Indicator summary.
MINISTRY OF PUBLIC WORKS (2017), House price data.
QNAFIS (2017), Quarterly non-financial accounts for the institutional sectors, National Statistics Institute (INE).
QSNA (2017), Quarterly national accounts, National Statistics Institute (INE).
Diana Posada and Daniel Fuentes. A.F.I – Analistas Financieros Internacionales, S.A.