
The Spanish housing market: Current situation and short-term outlook
While growth in the Spanish housing market is starting to slow, data show little evidence supporting that a real estate bubble is set to burst. In the worst-case scenario, the Spanish real estate market would reach the end of its cycle with only a limited impact on the broader economy.
Abstract: Several years into the post-crisis recovery, the Spanish housing market is showing signs of a slowdown. This has sparked debate among analysts as to whether Spain is set to experience the bursting of another housing bubble. An examination of a broad set of indicators to assess the state of the housing sector reveals that a property bubble has not formed in Spain. Moreover, the data suggest that any fallout from the prospective slowdown in the real estate sector on the broader economy will probably be moderate. While both real estate prices and transaction volumes are likely to ease in the coming years, especially in certain urban areas where prices have grown at particularly high rates, we do not expect a significant correction. This outlook is based on the fact that prices, household borrowing and housing affordability indicators are still at reasonable levels. Lastly, in a low-probability scenario where there is a market overcorrection, the end of the real estate cycle would still have a limited impact on the Spanish economy.
Introduction
Following several years of healthy growth, data from the last few months indicate the housing market is beginning to show signs of a slowdown. Though these trends are clear, opinions differ as to: (i) what stage of the cycle we are at; (ii) the outlook for the market in the quarters to come; and, (iii) the consequences for the broader economy of any prolonged slowdown. The purpose of this paper is to provide answers to those questions, based on a brief overview of the information at hand.
Situation in the housing market
The real estate cycle is closely correlated with the economic cycle
By linking different data series, it is possible to analyse the trend in house prices as far back as the 1970s (Exhibit 1). Over that timeframe, we can discern four cycles. The first, marked by numerous ups and downs, is characterised by very high rates of growth in the mid-70s until prices corrected at the start of the second oil crisis. The second cycle coincides with Spain’s entry into the European Community and concludes with the recession of the early 1990s.
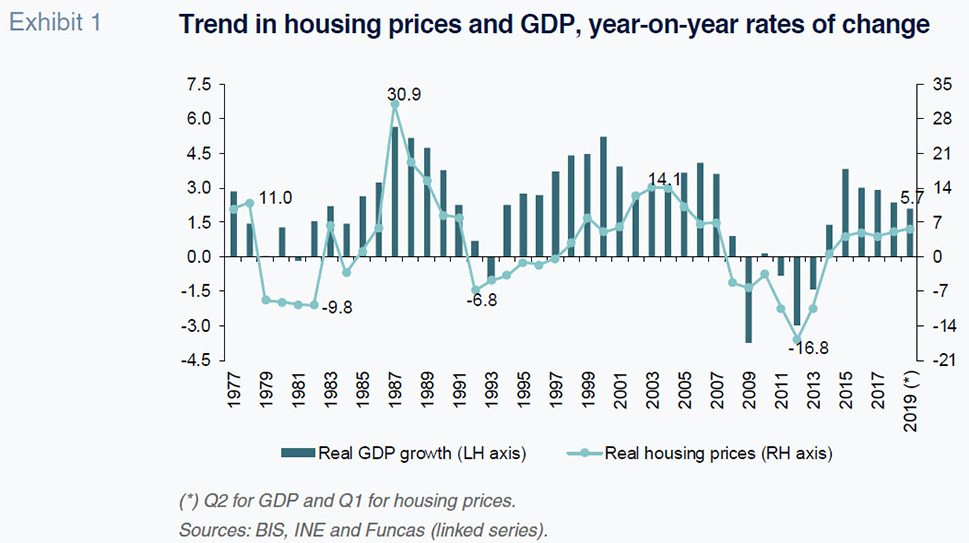
The third housing market boom emerged in the aftermath of that recession. During this period, the economy once again began to post significant growth and, with somewhat of a lag, the housing market also began to expand, registering its highest growth rates within the century (of close to 14% in 2003-2004). House prices continued to rise for another three years, going on to correct with the onset of the last financial crisis, moving virtually hand in hand with the evolution of the Spanish economy.
Lastly, in the wake of the economic recovery, the housing market embarked on its fourth growth cycle, with prices continuing to expand until today.
There is therefore a strong correlation between Spanish economic growth and the housing cycle. That leads us to believe that unless the economy slows by more than is currently expected, there is still room for additional growth in the present housing cycle, albeit marked by regional differences, which we will analyse further on. Recall that Funcas’ projection for 2019 is for GDP growth of 1.9%. In 2020 and 2021, according to Funcas, the Spanish economy is expected to grow by 1.5% and 1.8%, respectively.
[1]
The market is currently showing signs of flagging…
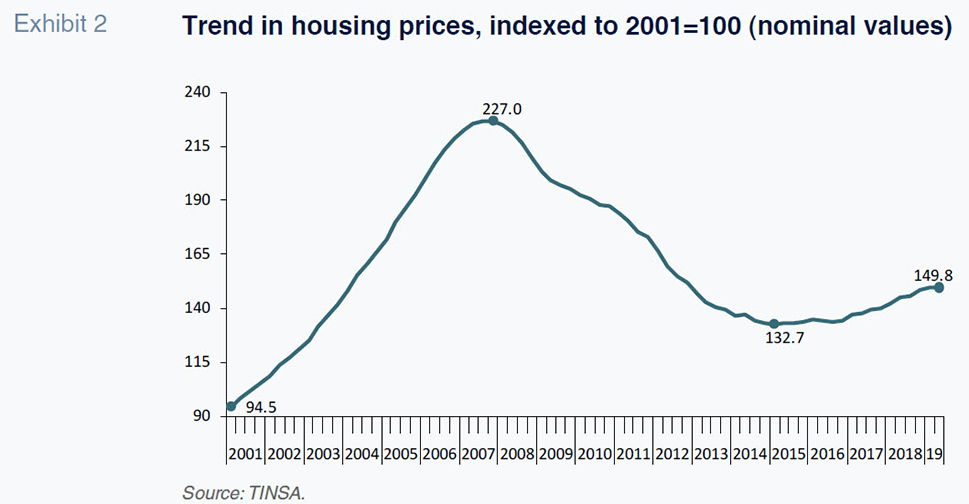
House prices have risen for four years running, albeit exhibiting a loss of momentum since the start of this year. Indeed, during the second quarter, the national statistics office’s series showed year-on-year growth of 5.3%, a considerable slowdown compared to the records in the earlier stages of recovery. The slowdown is even more pronounced if we look at the main price index tracked by the state appraisal company, TINSA, which shows 3.1% growth in the second quarter, compared to growth of nearly 5% a year earlier (Exhibit 2).
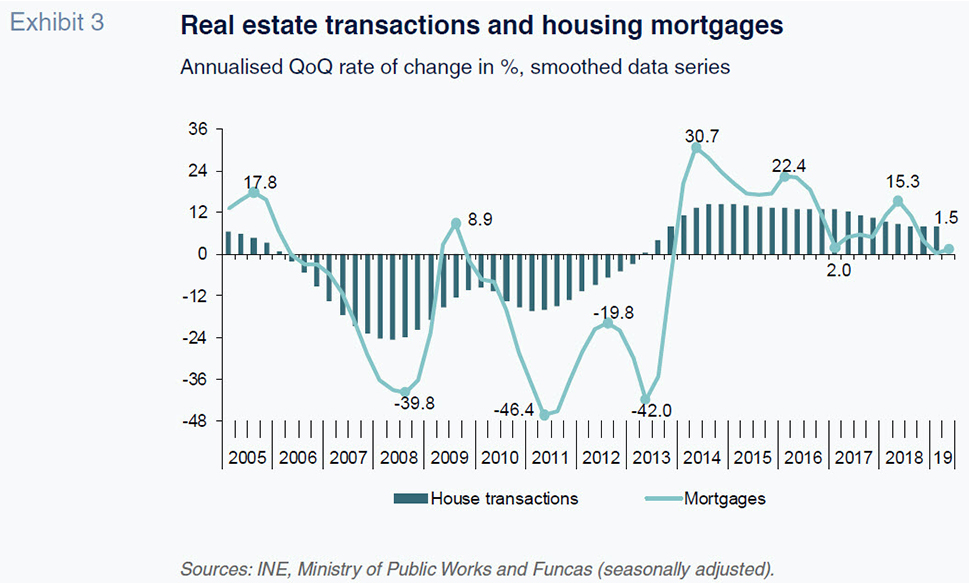
The main reason for the slowdown in the rate of growth in housing prices is a slump in demand. In the first quarter, the growth in the number of solicitor-registered transactions dropped to an annual rate of 2.2%, compared to 9.5% in 2018 and 16.3% in 2017 (Exhibit 3). Mortgage volumes, which had been slowing for the last two years, actually declined in the second quarter of this year. Although the introduction of new regulations may have put the brakes on mortgage lending activity, the slowdown is also evident in the preceding period.
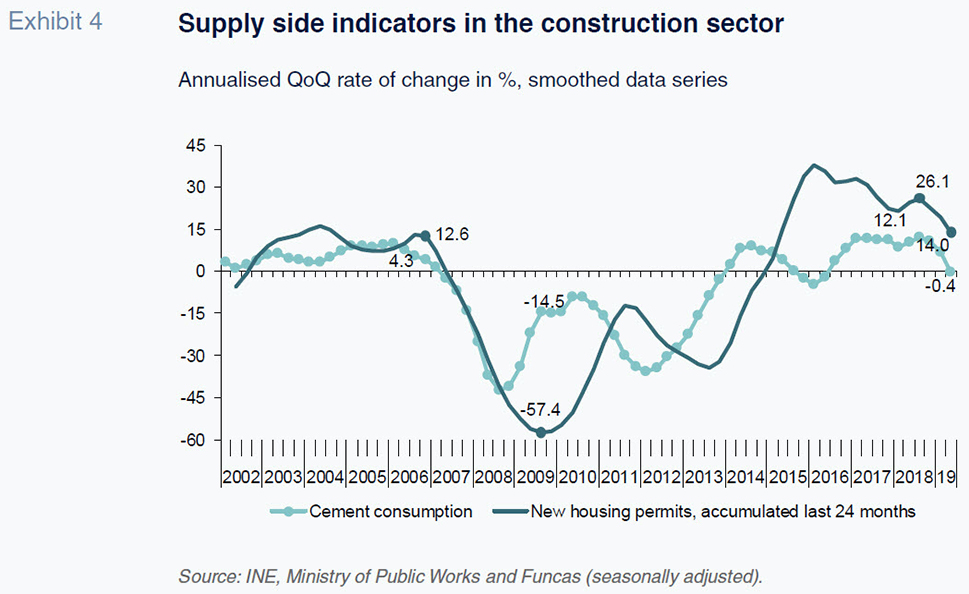
Supply, on the other hand, continues to increase, albeit at differing levels of intensity depending on the indicator used and starting from very low levels in the aftermath of the crisis (Exhibit 4). The supply of new housing continues to expand at double-digit rates. In May, the number of housing permits reached 108 thousand, compared to 90 thousand a year earlier. Nevertheless, that number is still six times smaller than at the height of the housing bubble. In addition, the stock of unsold housing remains at roughly half a million units. Other indicators point to a slowdown in investment. For example, cement consumption has been slowing since the second quarter of this year.
…but there are no signs of significant imbalances
Although the market appears to be entering a phase of slower growth, the situation is not comparable to the bursting of the real estate bubble a decade ago. First, prices remain nearly 20% below pre-crisis levels and the difference expressed in terms of average transaction values is even larger, at 33%.
In addition, the household debt service burden (mortgage principal and interest payments) stands at around 33% of disposable income, which is close to the long-run average and well below the peak of over 50% of 2008 (Exhibit 5).
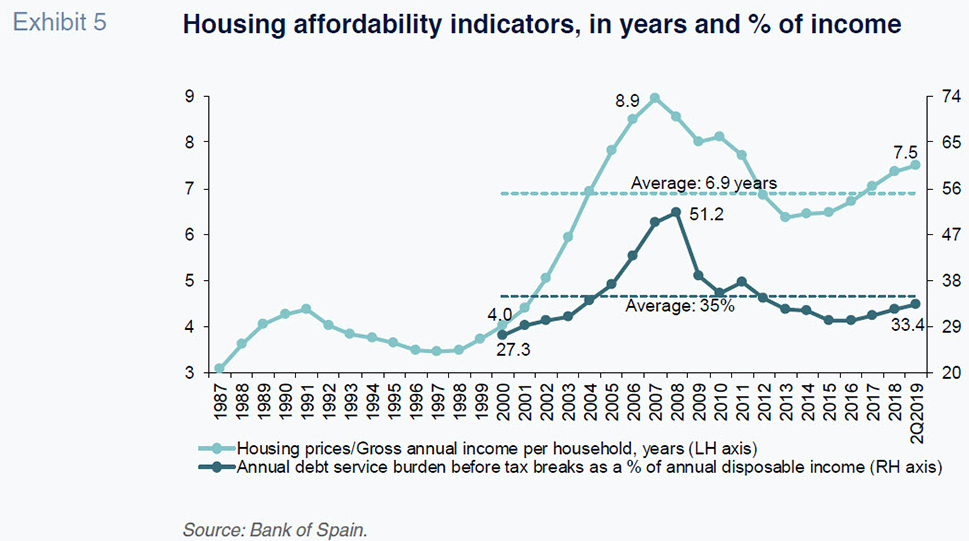
Until 2007/2008, when the housing boom came to a sudden halt, the financial burden for home-buyers increased consistently, peaking at record levels (8.9 years of gross annual income per household and at 51.2% of annual disposable income). Both indicators went on to fall between 2013 and 2015, before recovering in recent years. Measured in terms of annual disposable income, the debt service burden has barely increased and remains below the long-run average. However, measured in terms of the years of gross income needed to buy a home, it has increased and has been trending slightly (by 6 months) above the long-run average since 2017.
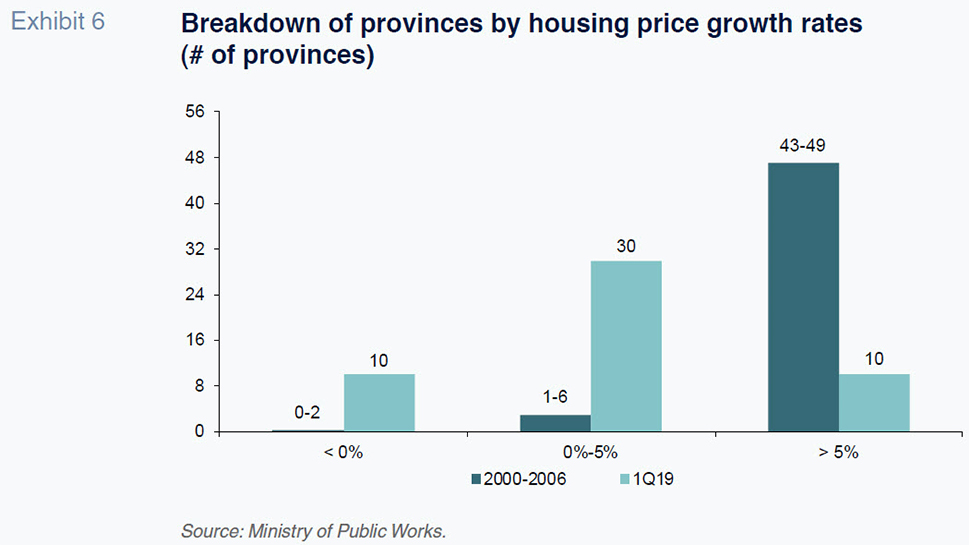
Elsewhere, the tightening in the housing market has been concentrated in just a few of the main city centres and tourist destinations. While the last bubble was forming between 2000 and 2006, nearly all of the provinces registered annual inflation of over 5% (Exhibit 6). Price inflation of that level is currently only observed in 10 provinces. This includes the major provincial capitals of Barcelona, Madrid and Seville and the provinces that have benefited the most from the boom in tourism, such as Castellon, Mallorca, Malaga, Santa Cruz de Tenerife and Valencia, as well as Navarre and Valladolid. At the other end of the spectrum, prices continue to contract in 10 provinces (compared to none during the last bubble) while many others have remained relatively stable. Note that in 14 provinces, average housing prices remain 60% below the peak reached before the crisis.
Nor are there signs of overheating on the supply side. House production is approaching the demand trendline. Moreover, the sector’s weight in the Spanish economy has decreased. Investment in construction, which peaked at over 20% of GDP prior to the crisis, has fallen by half. And construction sector jobs have etched out a similar path, falling from 11.8% of total employment prior to the crisis to 6.3%, a reading which is close to the European average. Construction output is also on a downward trend since the start of the year, but from low levels - in 2018 the sector produced 41% less than in 2008.
Lastly, no bubble can be detected in mortgage lending. The outstanding balance of bank loans taken on to finance the purchase or refurbishment of housing continues to shrink, having expanded at rates of over 35% during the construction boom in the 2000s. Moreover, over the last year, new home mortgage volumes contracted by 3%, while the percentage of non-performing mortgage loans has fallen considerably.
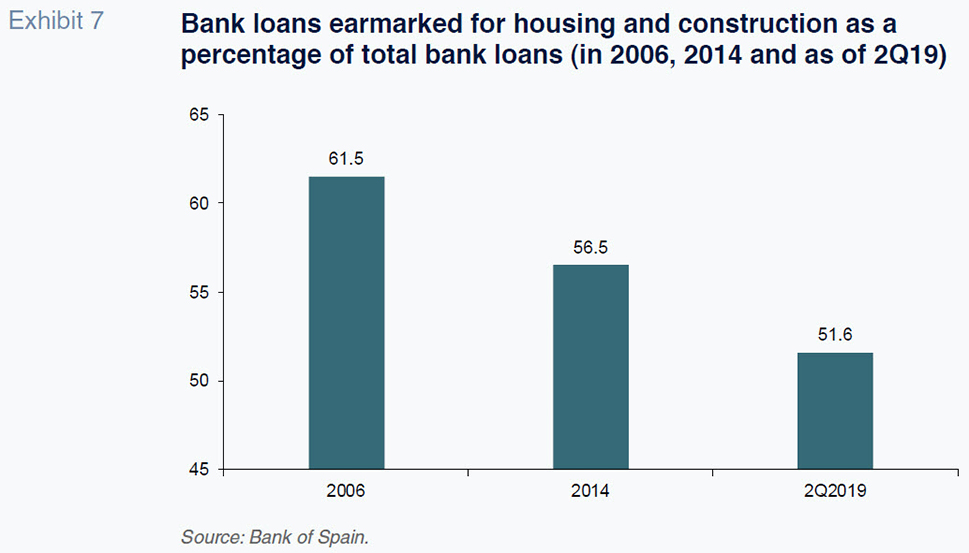
Mortgage lending activity contracted during the real estate market correction following the crisis. Once the recovery began, mortgage lending gained momentum and has continued to recover, other than for a short period in 2016 and the current dip. Indeed, in recent months it is worth noting that in addition to the signs of slowdown observable in the housing market, the drop in mortgage lending activity is mainly attributable to the new mortgage legislation, which has had the effect of delaying the execution of a large number of contracts. That one-off impact is expected to reverse in the medium term (the less-negative August reading suggests this may already be happening). It is also worth highlighting the reduction in banks’ relative exposure to the real estate sector (Exhibit 7).
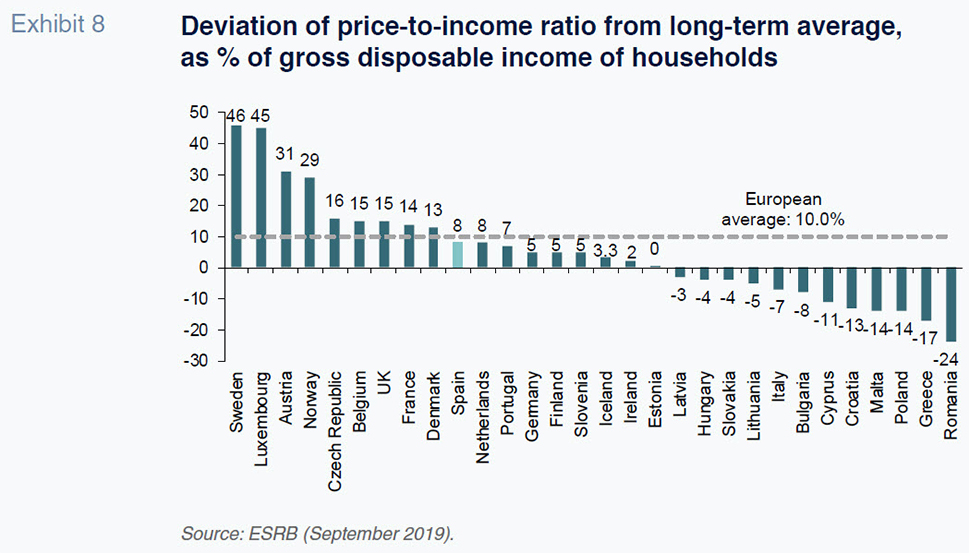
In comparison with most European countries, the Spanish real estate market is showing few signs of overheating. A recent report by the European Systemic Risk Board (ESRB) shows that housing prices in Spain are 8% above the estimated historical average,
[2] compared to a European average of 10%. That is significantly below the values observed in Austria, Belgium, France, the UK and Sweden, among others (ESRB, 2019). Although the historical average need not necessarily coincide with the equilibrium price, other indicators presented in the report point in the same direction. For example, Spanish households present relatively favourable borrowing levels. Their debt service burden (capital and interest) is below the European average. And, banks’ exposure to real estate risk is similarly moderate compared to the European average, expressed in terms of both percentage asset exposure and non-performance.
The rental market, where inflation is high, is a different story. Demand in this segment has increased as mortgage terms have tightened. This trend is exacerbated by shifting priorities among the younger age categories and job seekers in search of mobility.
Outlook
In the short term, the most likely scenario is a slowdown in price growth…
Based on the data, it is likely that we are at the end of a real estate growth cycle, consistent with the observed gradual slowdown in transaction volumes and prices. That means that the market is not likely to collapse as it did between 2008 and 2015, but rather give back some of the gains registered in the most sought-after areas.
That scenario is underpinned by Funcas’ forecasts for growth until 2021, which are in turn based on the global slowdown resulting from trade and geopolitical tensions, a cooling off in China and, more recently, the US. The European economy is suffering from this situation, in addition to the uncertainty surrounding Brexit. These factors, coupled with internal dynamics, are affecting Spanish trade, the investment climate and consumer confidence. In short, in the scenario contemplated by Funcas, the economy will expand by 1.9% this year, 1.5% in 2020, going on to recover slightly and grow by 1.8% in 2021.
The anticipated economic slowdown, which will take a toll on households’ disposable income, will curb demand for housing. Households are also likely to become more cautious about investments due to the downturn in the economy and growing uncertainty about their job stability. By way of reference, if the historical housing price to GDP elasticity were to hold, housing prices would increase by just 2.5% in 2020 and 0% in 2021. A movement of that magnitude would not have a significantly adverse effect on either the economy in general or on banks’ assets in particular.
Note that historical elasticities need not necessarily hold in the current environment. For example, they could fall due to reduced demographic pressure or, conversely, increase due to the limited appeal of alternative investment opportunities in a context of low interest rates and high equity price volatility. As a result, the numbers above should not be taken as a price forecast but rather an initial proxy.
…even if prices were to overcorrect, the consequences for the economy would be limited
Even in the event of a market overcorrection, the consequences for the Spanish economy would be limited. The fact is that for as long as there are comparable data, economic growth of under 2% has gone hand in hand with a drop in real house prices (the only exception being 2014, when prices ticked slightly higher due to the onset of the economic recovery).
Based on the corrections observed at the end of prior growth cycles, we assume that prices could trend gradually towards that level observed since 2000. Specifically, the drop in prices observed in previous real estate recessions (1979-1982 and 1992-1995) totalled the size of the price increases accumulated during the period of growth. Applying that trend to the current situation would imply a price correction of around 8%, which would leave housing prices back at the levels observed in early 2003.
The consequences for the economy of a correction of that magnitude would be smaller than during the last recession (2007-2013). This is due to the price accumulation with respect to the long-term average of just 8%,
i.e., nearly five times smaller than during the last real estate bubble.
[3] In addition, the price corrections would likely be concentrated in certain cities and coastal regions, the only areas to have seen significant price growth in recent years (unlike during the last bubble, which was fairly widespread geographically, as noted above). As a result, the wealth effect on household consumption would be limited.
Elsewhere, the impact of the price correction on banks’ assets would also be limited since the market boom has been driven by cyclical growth and not overexposure to mortgages. Loans to developers and to finance house purchases or refurbishments have fallen as a percentage of total bank loans and are approaching the European average.
Nor do we expect a significant correction in the construction sector, which has steered clear of the supply glut that characterised the last bubble (see analysis above).
Final observations
An analysis of the last 50 years shows that, historically, the real estate sector has always moved in tandem with the economic cycle. As a result, with the Spanish economy entering a slowdown, the growth in housing prices can be expected to ease in the coming years. The impact of the end of this cycle will probably be moderate thanks to the fact that this time around there is no evidence of significant imbalances in the real estate market of the kind on display in prior crises. Specifically, we have analysed housing prices, household debt in relation to income, banks’ exposure to the mortgage segment and the size of the construction sector. In all cases, we note that the imbalances are significantly smaller than at the start of the last crisis, concluding that the economic impact of any market correction will similarly be smaller.
Lastly, interest rates and borrowing terms are expected to remain favourable for a protracted period of time, shaped by the ECB’s monetary policy (Borio, 2019 and IMF, 2019). That should prop up demand in the short term, albeit posing risks to financial stability in the longer term.
Notes
For further analysis of the slowdown in the Spanish economy, refer to Torres and Fernández, 2019.
The existence of a difference with respect to the historical average need not necessarily imply an imbalance. In Spain, for example, other indicators, such as affordability, are below the long-run averages. Moreover, estimation of the equilibrium price requires detailed empirical analysis of the trends in supply and demand which go beyond the scope of this paper.
As noted earlier, by ‘over-valuation’ we mean a deviation in cost-to-income ratios from long-term averages. It is, therefore, a purely statistical concept, which does not necessarily reflect a housing market imbalance.
References
Carlos Ocana P. de Tudela. General Director, Funcas
Raymond Torres. Director for Macroeconomic and International Analysis, Funcas