
The outlook for the U.S. economy in the light of the change of administration
Until the end of last year the U.S. economy was performing better than most other advanced economies, and the prospects were for robust economic growth, moderate inflation and low unemployment; however, the recent policy changes driven by the new administration have generated a significant adverse shock, whose magnitude, if unaddressed, will be amplified both over time and internationally. Within this context of rising uncertainty, the risk of stagflation or worse has increased considerably.
Abstract [1]: Until the end of last year the U.S. economy was performing better than most other advanced economies, and the prospects were for robust economic growth, moderate inflation and low unemployment. However, the recent policy changes driven by the new administration have generated a significant adverse shock, whose magnitude, if unaddressed, will be amplified both over time and internationally. Import tariffs will impose a serious short-term squeeze on real personal incomes, consumer spending, profit margins and business investment, even assuming no retribution from trading partners. And they will eventually blunt incentives to innovate, invest and improve product quality. It is no surprise that financial markets are reacting in such a violent fashion, further aggravating the outlook. Moreover, the on-again-off-again process that has been used to impose tariffs has exacerbated uncertainty, with powerful effects on investment and consumption of durable goods. Additional uncertainty has been generated by: i) talk of encouraging (or even forcing) foreign holders to extend maturity of their U.S. bonds; ii) deportation of both illegal immigrants and critics of administration policies; iii) firing of many federal government and agency employees; iv) perceived erosion of the rule of law; and v) territorial threats against allies, resulting in growing boycotts against U.S. goods and tourism. In such a context, the risk of stagflation or worse has increased considerably. [2]
Recent years’ economic outcomes have been exemplary
The U.S. economy has enjoyed a run of good outcomes in recent years that have been in the forefront of those achieved by its developed-country peers. It entered 2025 in rude health. Real GDP grew by 2.8% in 2024, compared to an unweighted average of only 0.7% for the other G7 nations. Output expanded by 2.3% in the year’s final quarter. Unemployment was low by historical standards at 4.1% of the civilian labour force at the end of the year. Non-farm employment was increasing rapidly. Financial markets were sound if not ebullient, and household balance sheets were largely robust (with plenty of household wealth, especially in the form of real estate), though those with low or middle incomes or poor credit scores may have been stretched (Jefferson, 2025). Despite much higher interest rates than in earlier years, households’ debt service remained low, owing to still modest mortgage debt service (thanks to low mortgage rates in earlier years), while revolving credit was more burdensome: credit-card debt delinquency jumped in late 2024, especially for sub-prime borrowers from smaller banks.
Inflation was moderate at 2.4% in the fourth quarter when measured by the price index for personal consumption expenditures (PCE), only slightly above the 2% official Federal Reserve target. However, that was held down by food and energy price trends: in core terms, inflation was running somewhat faster, at 2.7% at the end of the year. Nevertheless, that was a relatively positive performance by international comparison.
The U.S. economy’s structural weaknesses remain
However, the economy’s longer-term macroeconomic weaknesses have not been overcome. The two most prominent are commonly known as the “twin deficits”: imbalances on the external current account and on the government accounts.
For its part the federal government has run large deficits in most recent years. In 2024 the combined deficit for all levels (not just the federal administration, which is often referred to in the domestic debate) was 7.5% of GDP, compared to only 4.6% for the average OECD country and exceeded only by Israel among OECD Member countries. The 12-month cumulative federal deficit reached $2.1 trillion in January 2025 – just over 7% of GDP. Of course it is not that the U.S. government spends more than most in relation to GDP; rather, broadly defined tax revenues are only around a quarter of GDP, while they are more than a third in the rest of the OECD. Indeed, the risk is that public spending will have to rise in response to greater needs from the aging population. Yet the powerful lobbies promoting lower taxes continue to hold the upper hand.
The succession of budgetary shortfalls has led to an accumulated gross general government debt of 122% of GDP (about 100% of GDP for the federal government alone), up from less than 100% in 2011, and the OECD’s largest except for Japan, Italy and Greece. This is reflected in burdensome interest payments, which reached 4.2% of GDP in net terms last year, tops in the OECD and representing some 10.5% of total government outlays and 13.0% of total receipts.
Before any changes from the new administration, the non-partisan Congressional Budget Office predicted that on unchanged policies the federal debt held by the public would rise to over 118% of GDP over the next decade and then to 156% by 2055 (CBO, 2025b), before a debt spiral gets underway. It also described four different scenarios in which macroeconomic outcomes could be worse, each of which would add hundreds of billions of dollars to decade-long cumulative deficits (CBO, 2025a). As well, extending all expiring tax and subsidy measures, as the Congress looks set to do, would cost an extra $4 to $5 trillion over the coming decade and boost debt from 118% to 133% of GDP. Some of the revenue loss from lower taxes could be offset by “dynamic feedback” effects, such as higher output and the resulting increase in government revenues. But, according to most independent experts such as the Committee for a Responsible Federal Budget, the positive revenue effect would be far less than the $2.6 trillion over ten years assumed by the Congress. Of course, the changes being wrought by the new administration could have a mammoth impact. First off, there will be substantial revenues from the introduction of much higher tariffs, discussed below. In addition, the downsizing of the federal civil service being organized by the Department of Government Efficiency will save a substantial amount of emoluments and pensions, but fewer staff at the Internal Revenue Service could lead to less capacity to collect and enforce taxation and to more cheating. According to the Yale University Budget Lab (2025b), the net effects of halving staffing levels could amount to a budget loss of $350 billion over a decade from the reduced-capacity effect and an extra loss of revenues of $2 trillion from noncompliance.
The deficit on the current account of the balance of payments, having stabilised in 2022-2023 at around a trillion dollars, increased again in 2024, reaching $1.134 trillion for the year (3.9% of GDP, up from 3.3% in 2023); by the second half of the year the deficit had broken through the 4% of GDP mark. The more robust economy than in trading partners, combined with the worsening competitiveness owing to the persistent strength of the dollar, has been sucking in more imports; fundamentally, however, it is perhaps better to see the deficit as reflective of inadequate domestic (notably public and household) saving (which represents only 17% of GDP, down by almost 8 percentage points since 1965, as private consumption makes up more than two-thirds of GDP, about 10 percentage points more than in the rest of the world). Alternatively, it can be seen as the counterpart to the U.S. capital account surplus (since the overall balance of payments must necessarily be zero) and that surplus to some important extent is the implication of the U.S. dollar being the world’s reserve currency.
In addition, the negative net international investment position (IIP)
[3] that has resulted from the chronic external deficits has led to a deficit on primary income (essentially investment income). The IIP reached -$23.6 trillion at the end of the third quarter of 2024, about double its level seen during the COVID pandemic in 2020. This represented 80.3% of GDP. Such an enormous external liability implies that it is crucial for the United States to maintain liquidity, institutional integrity and the rule of law to avoid any substantial portfolio adjustment by foreign investors, which would result in a slowing of capital inflows to finance the twin budget and external deficits and thus higher financing costs for borrowers of all kinds (potentially much higher). That process may just be getting underway now.
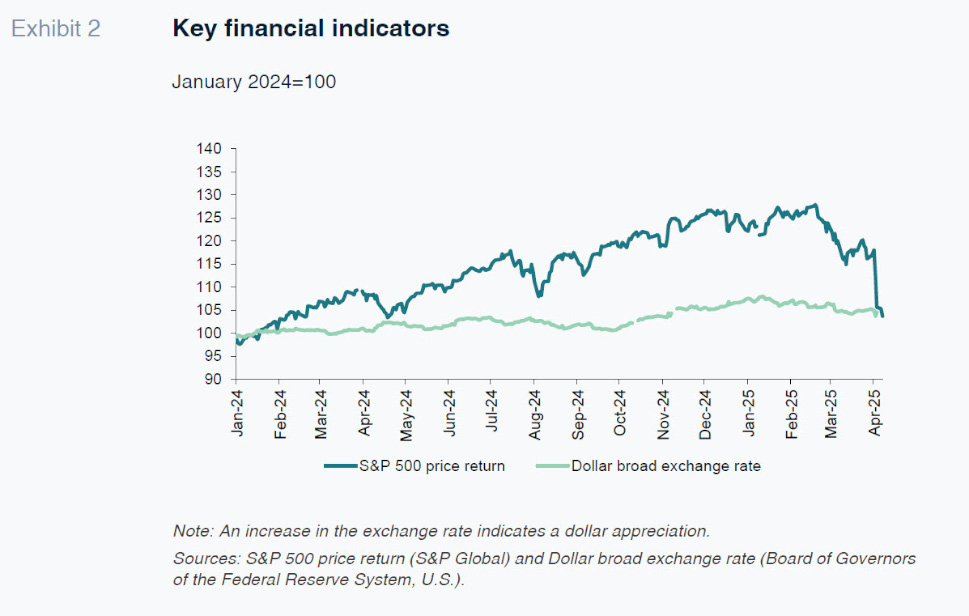
Despite the increasing severity of the twin-deficit problem, as 2025 began there was no sign of any loss of confidence by investors in U.S. dollar assets, even though China has been diversifying away from direct holdings of U.S. Treasury debt. The dollar’s effective exchange rate appreciated sharply over the course of the fourth quarter and into the initial weeks of 2025, a total gain of between 7% and 9% in effective terms, depending on whether one uses a narrow or broad definition. The dollar’s strength is likely attributable to its “convenience yield”, which should forestall any large-scale sell-off, so long as confidence in U.S. institutions remains widespread (Subacchi and van den Noord, 2025). The S&P500 index of U.S. equities rose by about a quarter in 2024, easily the best outcome among advanced economies, with the (Shiller) cyclically adjusted price-earnings ratio rising 17% to the third-highest on record. And U.S. Treasury yields gyrated around during the year, depending on prevailing market expectations as to the future movements of the Federal Funds rate. But the late-year trend was clearly upward, despite the Fed’s funds rate cuts. Besides increasing term premia, that was entirely due to rising real yields: real long-term Treasury yields surged from 1.8% at the time of the September Fed meeting to a peak of about 2.6% in mid-January.
The outlook for the coming few years appeared bright as 2025 got underway
Normally economic systems carry a large amount of momentum: the best predictor of many economic time series is a continuation of what has come before. This would imply that, in the absence of any major economic “shocks” (such as policy changes, natural disasters or changes in global markets for key commodities for geopolitical or other reasons), real output would grow in excess of 2% annually, unemployment would stay low, annual inflation would remain close to its official target of 2%, the fiscal deficit would stay uncomfortably large, the dollar strong and the external current account in moderate deficit.
But an inflection point may have been reached early in 2025
Evidence of a deterioration in activity has been mounting since the start of the year in the form of sectoral and spending indicators, financial market developments as well as overall assessments. For example, the Federal Reserve Bank of Atlanta’s GDPNow model initially predicted at the end of January first-quarter growth of as much as 4% (in seasonally adjusted annual terms), but the prediction plunged to -2.4% at the time of writing, or -0.3% on a gold-adjusted basis (Exhibit 1). And YouGov’s survey measure of respondents thinking the economy is getting worse jumped from 36% on January 21 to 51% in late March.

U.S. financial markets have followed a similar pattern. After gaining about 25% in the course of 2024, equity prices peaked in mid-January but experienced a sharp drop as from February 19, sporadically in March, and again dramatically in the wake of the tariff announcements in early April. In contrast, until the early-April tariff announcement equity indices for UK and EU stocks had been moving up because of different paths for risk premia (Avalos et al., 2025). Overall index volatility – as measured by the CBOE VIX index – rose from less than 15 on 14 February to over 48 (third-highest in its over 20-year history) on April 8. But single stock volatility in the United States has also been rising relative to index volatility because of U.S. government actions, not just in the form of tariffs but in a wide variety of dimensions, other geopolitical tensions (notably in Ukraine and the Middle East) and persistent supply chain disruptions (Britton, 2025).
The U.S. dollar started to appreciate sharply in October 2024, but reached a peak in January and then fell back noticeably as domestic growth concerns began to mount (BIS, 2025) and the likelihood of any promised substantial tax cuts (at least in the short term) began to recede. The dollar fell particularly sharply following the new tariff announcement in early April (Exhibit 2). Ten-year Treasury yields had been rising since touching a low of 3.63% in mid-September and reached a peak on January 13 of 4.79% before declining rapidly to below 4.0%, also following the new tariff announcements, and then suddenly surged when signs of a trade war with China emerged: market participants speculated that China may be selling some of its huge holdings of Treasuries (Exhibit 3). Various measures of inflation expectations imply that these recent fluctuations were largely in real yields, attributable to weaker output expectations, mostly associated with trade policy. The yields on Treasury Inflation-Protected Securities fell by about 50 basis points in the seven weeks to early March.

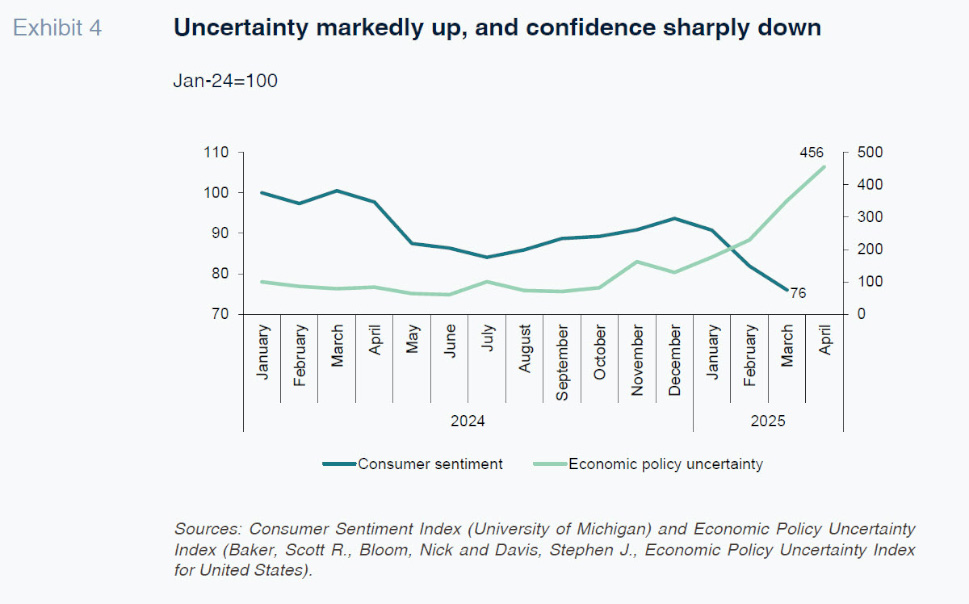
On the consumer front, hard spending numbers show that real consumer expenditures fell 0.5% in January, led by a sharp decline in goods spending while services were largely flat, and more complete first-quarter retail sales figures show a moderate decline of about 1.4% at annual rates. The University of Michigan’s Survey of Consumers points to clear stagflation (Exhibit 4). Its index of consumer sentiment has plummeted by 22% since December. Initially that fall was limited to Democrats and Independents, but in March weakness spread to Republicans as well. The decline in perceived current economic conditions was more modest, but expectations for the future nose-dived across multiple economic dimensions.
On top of their pessimism on activity, respondents also became far gloomier on the matter of inflation. Year-ahead expectations jumped to 4.9%, a third successive sizeable increase, while long-run expectations surged by 0.4 percentage points to 3.9%, the largest monthly change since 1993. On the other hand, increases in market-based expectations have been much more moderate, with those calculated by the Federal Reserve Bank of Cleveland reaching a peak of only 2.5% in February, up from 2.1% in October.
A qualitatively similar picture of expected stagflation has been in evidence from the Conference Board’s consumer confidence indicator, which in both February and March recorded particularly large drops, reaching the lowest level in 12 years, while also showing a leap in inflation expectations to 6.2%. The implication is that households might well prefer to hold off on discretionary purchases and save instead.
Some business-sector indicators have also weakened. For example, the Institute for Supply Management PMI index for Manufacturing fell back from 50.9 in January to 49.0 in March, led by sharp drops in new orders and employment, while price perceptions surged to 69.4, up 14 percentage points. On the other hand the parallel Services index strengthened in February and fell only in March, but there too price perceptions were robust. Industrial production has held up better thanks to strength in utilities (up 7.2% in January) owing to unusually cold weather, while moderate strength in manufacturing was essentially due to the motor vehicle sector.
The labour market has shown rather less vigour as well. Nonfarm payroll gains slowed from 323 thousand in December and an average of 168 thousand in the last 12 months to an average of only 114 thousand in January and February, though March data did see some recovery. Perhaps more disturbing is the surge in the number of those working part-time for economic reasons, which jumped 460 thousand (over 10%) in February and in March was up 475 thousand over the previous year. The bulk of these cited slack work or business conditions. As well, those not in the labour force but who currently want a job has also shot up by 490 thousand (+9.6%) over the past year. The broadest (U6) measure of overall labour under-utilisation accordingly jumped more than half a percentage point to almost 8%, the largest increase in the past decade outside the COVID-related surge in 2020. While the overall unemployment rate remained quite flat, the rate for teenagers has risen by 1.1 percentage points and for adults without a high school diploma by 0.8 percentage points. These groups are often the harbingers of future labour-market shifts.
It is widely agreed that the cause of the recent turn-around has been U.S. government actions
It takes nothing beyond simple economic reasoning to recognise the probable causes of the turn towards stagflationary outcomes. Economic theory has long admitted the concept of an optimal tariff based on an importing country’s monopoly power. Imposing tariffs on many imported goods from a variety of source countries and tightening border enforcement switch demand towards domestic production, as intended by the U.S. administration. A partial offset of the demand-switching effects comes from exchange-rate appreciation, which is needed to maintain balance-of-payments equilibrium, according to standard models. Tariffs can also raise government revenues (around $3 trillion over the coming decade, according to the Yale Budget Lab (2025a), but with a very regressive impact on household incomes).
The United States was already relatively protectionist before the 2025 change of administration, at least according to its nontariff barriers: in 2023, the Tholos Foundation (2023) ranked it 24th of 88 countries for tariff barriers, but dead last for the nontariff variety and 65th for the total, down from 51st the previous year.
But this year the United States has imposed both product-specific broad-based tariffs (labelling them “reciprocal”) on merchandise imports from almost all of its trading partners, as well as on steel and aluminium and motor vehicles from all sources. These tariffs, even if they were calculated in an optimal manner, would impose a serious short-term squeeze on real personal incomes, consumer spending, profit margins and business investment, even assuming no retribution from trading partners. And they will eventually blunt incentives to innovate, invest and improve product quality. Most importantly the way in which the administration came up with them was effectively based on bilateral trade deficits, which lacks any grounding in logic whatsoever. It was therefore no surprise that financial markets have reacted in such a violent fashion in their wake. Fear of such cost barriers led many foreign producers to bring forward their trade with the U.S. economy: U.S. goods imports surged in January and February, when they were up 22.5% over year-earlier levels.
One of the key economic advisers in the new administration had advocated a broad-based 20% tariff based on a mistaken understanding of the context in which the resulting theoretical income gains could be realised in practice (Miran, 2024): in particular, that outcome assumes that trading partners would not retaliate (Rodriguez-Clare and Costinot, 2025), and thus far only Mexico and the United Kingdom have followed that course, while Canada, China and the European Union have imposed or at least promised retaliatory tariffs. These retaliatory tariffs will lower the demand for U.S. output and thus U.S. exports. Increasing protectionism will also interfere with supply chains, which have been established in some cases decades ago and refined over the intervening years, notably in motor vehicle production. And it will push up prices for U.S. buyers, because foreign producers will not be willing or able to bear the full burden of the tariffs on their margins and will therefore raise their selling prices in the U.S. market, allowing their domestic competitors to boost theirs as well. These higher inflation readings may also curb the willingness of the Federal Reserve to cut rates in the coming period. Nevertheless, financial markets were initially convinced of the demand-reducing effects of the expected trade war that there was a subsequent rush to buy long-term bonds (Exhibit 3).
The full general equilibrium outcome, as witnessed often in economic history, is almost certain to be lower output and incomes on both sides, as was observed in the wake of the infamous Tariff Act of 1930 (better known as the Smoot-Hawley Tariff), which contributed to the Great Depression. At that time retaliation was implemented by Canada, Cuba, Mexico, France, Italy, Spain, Argentina, Australia, New Zealand, and Switzerland, and U.S. exports fell by some 30% as a result (Mitchener et al., 2022).
Various estimates of the likely economic effects of these new tariffs implemented by the United States have recently appeared. Morgan Stanley quantified the impact as a loss of 1% on U.S. real GDP. Meltzer (2025) looked at just those levied on Canadian and Mexican imports and estimated the impact as about -0.3% on U.S. real GDP and +0.8% on consumer prices. Yale University’s Budget Lab (2025a) looked at reciprocal tariffs and came up with losses on real GDP of 0.6-1.0% in 2025 and 0.3%-0.6% in the longer run as well as a price-level effect of 1.7-2.0%. Disposable income per household falls by 1.1% for those in the top income decile but by 3.6% in the second-lowest. The OECD (2025) recently quantified a scenario of additional tariffs of 10% on all U.S. imports and (by trading partners) on its exports as well. The effect was to lower U.S. real GDP by 0.7% in the third year and inflation by an average of 0.7% per annum over the three-year horizon.
But as much as the predictable effects of the whole gamut of U.S. tariffs, it is the on-again-off-again process that has been used to impose them in recent months that has created a huge amount of uncertainty for producers and consumers alike, and that uncertainty is having powerful effects on decision-making. The option value of delaying any purchasing commitments has increased as the range of feasible outcomes has widened. This will undoubtedly impinge on spending on investment in fixed capital as well as consumption of durable goods. Similarly, additional uncertainty has been generated by:
- Talk of encouraging (or even forcing) foreign holders of U.S. Treasury bills to extend to century bonds in order to lower the federal debt burden or charging foreign holders a fee;
- Successful attempts to deport both illegal immigrants and those speaking up against administration policies;
- Firing a large number of federal government and agency employees by the recently formed Department of Government Efficiency;
- The harm done to perceptions of the rule of law, for which, the WorldJusticeProject.org had already ranked the United States at 26th in 2024, down from 20th in 2015 out of 142 countries, especially low (36th) for civil justice; and,
- The territorial threats made against U.S. allies, notably Canada, Greenland and Panama, which have resulted in growing boycotts against U.S. goods and even services (such as tourism).
This can be quantified by the Economic Policy Uncertainty Index (www.policyuncertainty.com). This index is based on key words in articles from 10 major newspapers. The March average reading of 446 was higher than the COVID19-era peak of 428 in July 2020. But by 14 March it had risen further to 469, almost triple the year-ago figure of 159 (Exhibit 4). Similarly, its trade policy component that began 2024 at 45, was still below 200 as recently as October before jumping to 1400 in November and further to 1729 in January (the latest data), a record high except for August 2019 (1947). Fully 79% of respondents to the Federal Reserve Bank of Philadelphia’s March Manufacturing Business Outlook Survey said that uncertainty was acting as a constraint on capacity utilisation, and 64% opined that this constraint will worsen in the future.
Any further increase in policy uncertainty or indeed disappointing surprises on growth or inflation could let loose a non-linear reaction in financial markets where agents could choose to reprice risks substantially, especially as U.S. equity valuations are still so high: only Indian equities had a higher cyclically adjusted price-earnings ratio late in 2024. This could in turn feed back onto activity.
In this regard, a number of financial market risks should be mentioned. First, some observers have pointed to waning foreign official demand for dollar-denominated safe assets (especially in light of ongoing increases in the price of gold, which have occurred mostly during times when U.S. markets are closed), possibly driven by geopolitical concerns including fear of sanctions and asset freezes (Rashad and Rebucci, 2025). Second, the growth of private finance in equity and credit markets, including the expansion of unlisted entities, has not elicited much in the way of dedicated regulatory oversight. The result is a definite lack of understanding of the fundamental conditions in these sectors and the amount of leverage they embody, raising risks to the banks who lend to them. This was discussed explicitly in the latest OECD Economic Outlook (No. 116, Box 1.2, December 2024). Third, the Federal Reserve (2024) is also concerned by hedge fund leverage and growth and life insurers’ non-traditional liabilities. Last, the Economist has also mentioned the major risk of a full embrace of crypto currencies, whose value at the end of 2024 had reached $3.9 trillion. Their volatility can be demonstrated by the subsequent fall in their total value to $2.65 trillion, but risks also flow from the leverage they involve and their opacity, especially with reference to initial coin offerings.
The Federal Open Market Committee’s March 19 projections are illuminating
The Federal Reserve’s Open Market Committee releases quarterly economic projections made by its 19 members for key economic indicators every quarter. The latest set (Federal Reserve, 2025) showed that the median projection for real GDP growth during the year would probably average around 1 ¾% in the coming three years, about ¼ percentage point below the December outcome. Unemployment was projected to rise to 4.4% of the labour force from its recent level of 4.1%. PCE inflation during the year could be 2.7% this year (up from 2.5% projected in December) before falling back to 2% by 2027. And the midpoint of the Federal funds rate range would be 3.9% at the end of 2025 (implying two further quarter-point cuts this year), followed by 3.4% and 3.1% in the subsequent two years.
But perhaps most tellingly the most pessimistic members were decidedly more pessimistic than in December: the lowest figures for real growth in 2025-2027 were 1.0%, 0.6% and 0.6%, down from 1.6%, 1.4% and 1.5%; the highest for inflation were 3.4%, 3.1% and 2.8%, up from 2.9%, 2.6% and 2.4%. Moreover, when asked about the amount of uncertainty they perceived surrounding their growth (inflation) projections compared to the last 20 years, 17 (17) of 19 participants said it was higher, compared to only 9 (14) in December. And, depicting the risks to their projections, 18 of 19 said they were weighted to the downside on real growth (compared to only 5 in December), the same number who said that inflation risks were weighted to the upside (only 15 in December). So in the Committee’s view likely outcomes have worsened, and most of the risks and uncertainty point to an even more stagflationary picture.
To sum up
In these times when events are moving very quickly it is challenging to enunciate a view of the economic outlook that takes proper account of momentum, structural imbalances, incoming data, and policy uncertainty and instability. This article has gone through the various factors that need to be taken into account, but the bottom line is that the confidence interval surrounding any projection is unavoidably extraordinarily wide at the moment. In the short term, possible outcomes vary from a recession, possibly resulting from a financial market crisis, to still positive growth. In a real sense this is a perfect natural experiment of the power of uncertainty to limit spending and activity. It is hard to imagine a set of circumstances in which uncertainty could be greater still.
Notes
The opinions and analysis contained in this article are those of the author and do not represent those of the OECD. The author wishes to thank Paul Horne and Geoff Barnard for useful comments on an earlier version.
The latest available data referenced in this article is as of April 9, 2025.
The IIP is measured as the difference between U.S. residents’ foreign financial assets and liabilities valued at market exchange rates.
References
AVALOS, F., TODOROV, K. and XIA, D. (2025). U.S. spillovers amid macroeconomic divergence.
Bank for International Settlements. Quarterly Bulletin, Basel, March.
BIS. (2025). Overview chapter.
Bank for International Settlements Quarterly Bulletin. Basel, March.
BRITTON, P. (2025), Investors should take stock of the shift in volatility.
Financial Times, 14 March. London.
BUDGET LAB. (2025a). The Fiscal, Economic and Distributional Effects of Illustrative ‘Reciprocal’ Tariffs. New Haven: Yale University. February.
BUDGET LAB. (2025b). The Revenue and Distributional Effects of IRS Funding. New Haven: Yale University. March.
CBO. (2025a).
How Changes in Economic Conditions Might Affect the Federal Budget: 2025 to 2035. Washington, March.
CBO. (2025b).
The Long-term Budget Outlook: 2025 to 2055. Washington, March.
FEDERAL RESERVE. (2024).
Financial Stability Report. Washington.
FEDERAL RESERVE. (2025).
Summary of Economic Projections. Washington, March.
JEFFERSON, P. (2025). How Healthy are U.S. Households’ Balance Sheets? Speech, Board of Governors of the Federal Reserve, 19 February.
MELTZER, J. (2025). Trump’s 25% tariffs on Canada and Mexico will be a blow to all 3 countries. Commentary. Brookings Institution, 3 February.
MIRAN, S. (2024). A User’s Guide to Restructuring the Global Trading System. Stamford: Hudson Bay Capital, November.
MITCHENER, K., O’ROURKE, K. and WANDSCHNEIDER, K. (2022).
The Smoot–Hawley Trade War.
Economic Journal, Vol. 132, No. 647, 2500–33.
OECD. (2025).
Interim Economic Outlook, Paris, March.
RASHAD, A. and REBUCCI, A. (2025). A ‘reverse conundrum’ and foreign official demand for U.S. Treasuries. VoxEU Column, 15 January.
RODRIGUEZ-CLARE, A. and COSTINOT, A. (2025). ’A very bad idea’: Two economists respond to the White House citing them on 20% tariffs.
UC Berkeley Letters & Science, 27 January.
SUBACCHI, P. and VAN DEN NOORD, P. (2025). Will the World Keep Buying U.S. Treasuries?
Project Syndicate, 28 March.
THOLOS FOUNDATION. (2023).
International Trade Barrier Index. Kuala Lumpur, May.
Peter Jarrett. The author is a former head of the U.S. country desk at the OECD