
Spain’s rising tax burden: Personal income tax under scrutiny
Spain’s tax revenue rose sharply in 2024, led by strong growth in personal income tax, VAT, and corporate income tax. While this helped reduce the public deficit, the non-indexation of PIT has eroded real household incomes and intensified fiscal drag.
Abstract: The bulk of tax revenue in Spain comes, in descending order, from personal income tax (PIT), value added tax (VAT), corporate income tax (CIT) and excise duties. Revenue from these four taxes increased by 8.1%, or €21.17 billion, in 2024. As a result, their share of GDP increased from 17.4% to 17.7%. Around four out of every 10 euros of that increase corresponded to PIT, 3 to VAT, 1.8 euros to CIT and 0.6 euros to excise duties. As in prior years, PIT was that key source of growth in tax receipts. In 2024, the indexed average real PIT burden borne by Spanish households was well above the value of 100 in 2008, at 114.4. In contrast, indexed average net income stood at 95.7 in 2024. This means that Spanish households’ take-home pay was lower in 2024 than it was in 2008. In other words, in real terms, they paid more PIT than in 2008. The failure to index PIT to inflation since the pandemic explains a substantial part of the divergence between the net income and PIT indices in 2024.
Trend in revenue and the public deficit in 2024
Excluding the impact of last autumn’s flash floods, [1] Spain’s public deficit ended 2024 at 2.8%, 0.2pp better than the government’s target, repeating the situation of 2023, when the deficit also came in below target. This positive performance was driven by the interplay of two factors. Firstly, sharp growth in receipts from the four pillars of the tax system (PIT, VAT, CIT and excise duties), of 8.1%. Secondly, one-point lower growth in total government uses of funds relative to non-financial revenue: 6.2% versus 7.1%. As a result, total public revenue as a percentage of GDP increased by 0.3pp to 42.3%, while public expenditure was stable at 45.4% (IGAE, 2025).
Total receipts from these four taxes came to €281.17 billion in 2024, up €21.17 billion from 2023, in line with trend throughout the rest of the post-pandemic years (AEAT, 2025a). These figures highlight the extraordinary growth in tax receipts since the pandemic, marked by annual growth of 23.8 billion euros. In the historic series tracking tax receipts, we have to go back to the years of the real estate boom for a comparable increase: average annual growth in tax revenue of €19.1 billion between 2005 and 2007.
The biggest share of the growth in revenue in 2024, at 40.0%, came from PIT (€9.13 billion), followed by VAT, at 29.1% (€6.63 billion), CIT, at 17.7% (€4.04 billion) and excise duties, at 6.6% (€1.37 billion). Year-on-year, revenue from PIT, VAT, CIT and excise duties increased by 7.6%, 7.9%, 11.5% and 6.6%, respectively. [2] The sharp growth in PIT receipts was driven by growth in employment and non-indexation for inflation. PIT receipts increased from 94.55 billion euros in 2021 to 129.41 billion in 2024. In other words, in just four years, revenue has increased by 36.9%, or 34.86 billion euros. In the case of VAT, the increase in revenue in 2024 is mainly attributable to the withdrawal of tax relief and the effects of inflation. The cost of VAT relief decreased from 4.5 billion euros in 2023 to 2.94 billion euros in 2024 (AIReF, 2023, 2024). The growth in CIT receipts was driven by growth in taxable profits. [3]
The intense growth in public revenue helped reduce the public deficit from 3.5% in 2023 to 2.8% in 2024. Delivery of the targeted deficit of 2.5% in 2025 will require a fiscal adjustment of close to 2.8 billion euros. The government faces two sources of uncertainty regarding its ability to meet that target: internal, intrinsic to the fact of governing in minority; and international or geopolitical, given the Trump administration’s new tariff policy. Internally, the government is encountering serious difficulties in garnering support from its governing partners for certain key issues. One of the most important is its inability to push through a new budget, forcing it to carry over the 2023 budget for the second time in 2025. It is also having a hard time passing tax measures, even stopgap solutions needed to address the issues derived from population ageing.
As for the uncertainty coming from abroad, higher US tariffs on China and the EU, and the reciprocal measures, have created significant instability. This trade war, which is ongoing, is already affecting GDP growth, with eurozone forecasts for 2024 recently trimmed by 0.2pp to 0.8% (IMF, 2025). The Spanish economy will be directly affected by the drop in exports, to both the US and other European markets, particularly France and Germany, its main trading partners. Note that the International Monetary Fund recently reduced its GDP growth forecasts for both these economies to 0.6% and 0.0%, respectively (IMF, 2025).
That report suggests that the Spanish economy will be one of the most robust advanced economies in 2024, with estimated growth of 2.5%. However, the uncertain economic climate could drag on growth over the course of the year. As noted by Torres (2025), “it would be naive to believe that Spain can decouple from the issues affecting the rest of the world, making a slowdown foreseeable from the second half of the year”. For now, in its most recent update, Funcas (2025) has reduced its growth target for 2025 by 0.1pp to 2.3%. In short, the new international economic environment will make it harder to deliver the deficit target in 2025, although it is still too soon to estimate the scope of the fallout with any great precision. In fact, the tax collection figures to March 2025 reveal ongoing robust growth in PIT (9.9%), VAT (8.9%) and excise duties (7.3%) (AEAT, 2025b).
Tax burden by main tax in 2024
The tax burden of the four main taxes (hereinafter, referred to as TB4) amounted to 17.4% of GDP in 2024. If social security contributions are included, the burden implied by these five sources of non-financial income (referred to as TB5) increases to 30.9%, or a sum of 491.91 billion euros. As shown in Exhibit 1, the TB5 remained stable between 1997 and 2004, at an average of close to 28.3%. However, during the real estate boom years, it increased, peaking at 30.5% in 2007. The situation since the pandemic has been characterised by a step change in the TB5 to above the 30% threshold. Having fallen back slightly in 2023, in 2024 the TB5 amounted to 30.9%.

Exhibit 2 shows how the biggest source of pressure in 2024 relates to PIT (8.1% of GDP), followed by VAT (5.7%), CIT (2.5%) and excise duties (1.4%). Since the financial crisis, the PIT tax burden has also experienced a step change: having remained at around 6%-7% in 2019, it increased to 7%-8% between 2020 and 2022 and has been at over 8% since 2023. In fact, its all-time peak came in 2024, at 8.1%. As shown in Exhibit 3, this increase in the tax burden is echoed in the increase in the average personal income tax rate. Specifically, it leapt by 1.7 points from 12.7% in 2019 to 14.4% in 2024; that is to say, 1.7 points more in 5 years.


Several factors are responsible for the sharp growth in revenue in the post-pandemic years. We highlight three. Firstly, the sharp increase (1.8 million people) in the number of people in work between 2019 and 2024, with the number of wage-earners increasing from 19.8 to 21.7 million (INE, 2025). As a result, the unemployment rate had dropped to 11.3% in 2024, back at 2008 levels. Secondly, growth in nominal wages, which, according to the data tracking collective bargaining agreements, increased by 15.9% between 2019 and 2024 (Ministry of Labour and Social Security, 2025). That is, nevertheless, below the cumulative increase in prices for that same period, of 18.2%. Lastly, the impact of inflation on PIT receipts due to the fiscal drag. The failure to index the elements of PIT that are expressed in euros, including all minimum thresholds, tax allowances, exemptions and also the tax bands, increase taxpayers’ tax burden. This non-indexation strategy has boosted revenue by 16.8 billion euros between 2021 and 2024, equivalent to roughly half of the tax take during the four-year period (Romero-Jordán, 2025a). The roadmap set out in the tax plan for 2025-2031, growth in spending due to population ageing and the recently announced 10.4 billion euros increase in defence spending in 2025 constitute a strong incentive for the government not to walk away from the extra revenue generated by inflation. Particularly, because this decision does not require any sort of parliamentary approval.
Company profits are markedly cyclical. CIT receipts are determined by that cyclical effect, in conjunction with the size and design of the tax base for this tax. For example, the ability to reduce taxable income by unused tax losses undermines CIT revenue even in very favourable economic climates, as these losses are carried forward from previous recessions. Between 2009 and 2019, the tax burden implied by CIT averaged 1.9% of GDP. Since 2020, this tax burden has been rising, peaking at 2.5% in 2024. This upward trajectory is being driven by the recovery in corporate profits to pre-pandemic levels (OME, 2024). As a result, the tax burden in 2024 was very close to the average of 2.6% observed between 1997 and 2003.
The CIT tax burden can be disaggregated between the effect of the average rate and the weight of taxable income in GDP. Specifically, PFIS = (R/B) * (B/PIB), where R is the tax revenue and B is the base subject to taxation. The first term (R/B) yields the average tax rate, while the second term (B/GDP) is a proxy for the size of the tax base. As Exhibit 3 illustrates, the average tax rate has been stable since the pandemic, even dipping below that of 2019 (20.2% versus 20.4%). However, the size of the tax base increased from 8.1% in 2019 to an average of 10.7% between 2020 and 2024, peaking at 11.4% in 2024. In short, the increase in the CIT tax burden since the pandemic is the direct consequence of growth in the tax base. Tax reforms introduced in recent decades have taken aim at the tax base. For example, introduction of a ceiling on the deduction of finance costs equivalent to 30% of taxable profit in 2015; the establishment in 2016 of a limit of 60% on the utilisation of tax losses (reduced to 25% in 2017); and the limit in place between 2015 and 2018 on the use of tax credits for non-technology R&D, along with tighter requirements to ensure effective investment in truly innovative activities.
The tax burden implied by VAT in 2024 of 5.7% was in line with the post-pandemic average (5.8%) and also the 2019 figure (5.7%). Between 2021 and 2024, VAT was reduced as part of the fiscal shield rolled out. Specifically, the government reduced the rate of VAT on electricity (between 2021 and 2024), gas (between 2022 and 2024) and certain food products (2023 and 2024).
[4] Those cuts were offset, at least partially, by growth in revenue induced by inflation. Romero-Jordán (2025b) has estimated that, due to the impact of high inflation rates, the VAT tax bill increased, on average, by 75.7 euros per household in 2021, by 195.2 euros in 2022, 98.6 euros in 2023 and 69.2 euros in 2024. Withdrawal of that VAT relief sent VAT receipts back up, to 6.63 billion euros in 2024. It is foreseeable that the VAT tax burden will continue the upward trend observed since 2013, particularly the share of spending subject to VAT over GDP remains as high as that observed since the pandemic: an average of 41.2% since 2021 (Exhibit 4).

The tax burden implied by the various excise duties, levied on alcohol, beer, fuel and tobacco, has been trending lower since the end of the 1990 (Exhibit 2). This trend, in contrast to that observed in PIT, VAT and CIT, is partially due to the fact of not restating the tax rates (expressed in euros) to reflect the trend in the prices of the goods subject to these taxes. This lack of indexation has sharply eroded these rates and, by extension, tax receipts. For example, excise duty on beer was last updated in 2005, duties on fuels, in 2009, the levy on tobacco, in 2013, and on alcohol, in 2016. This non-indexation has adverse consequences for tax revenue but positive effects on household consumption. However, the economic function of excise duties is to internalise the external costs they generate, especially for the public health system.
PIT is dragging on growth in real household disposable income
The Spanish economy has been remarkably dynamic in recent years, outperforming the EU-28. Between 2022 and 2024, it registered growth of 6.2%, 2.7% and 3.2%, compared to the European average of 4.7%, 1.5% and 2.4%. However, households’ perception of their economic situation is less favourable than that depicted by the macroeconomic aggregates. Some 80% of Spanish households describe their economic situation as either mediocre or poor (Funcas, 2025). The economic and housing crises and job quality are households’ chief economic concerns (CIS, 2022; 2025). Higher taxation, despite the considerable increase in the tax burden, does not feature among the top concerns in these polls. Probably because the tax burden is a complex concept whose scale cannot be directly observed by taxpayers. Not even for the taxes, like PIT, with which they are more familiar. Nevertheless, the results shown next reveal that in recent years, PIT has curbed growth in real average household net income.
Exhibit 5 indexes average household net income in real terms between 2008 and 2024. The base year selected (2008 = 100) coincides with the height of the real estate bubble. Disposable or net income has been calculated as the difference between gross household income and PIT and social security payments. The Exhibit also indexes the real average PIT payments borne by households. Both indices etch out similar patterns: trending down from 2013, as a result of the financial crisis, and heading higher since then. However, the upward slope of the PIT index is far more pronounced in the post-pandemic period. As a result, the PIT payment index had increased to 114.4 in 2024, whereas the net income index was 95.7.
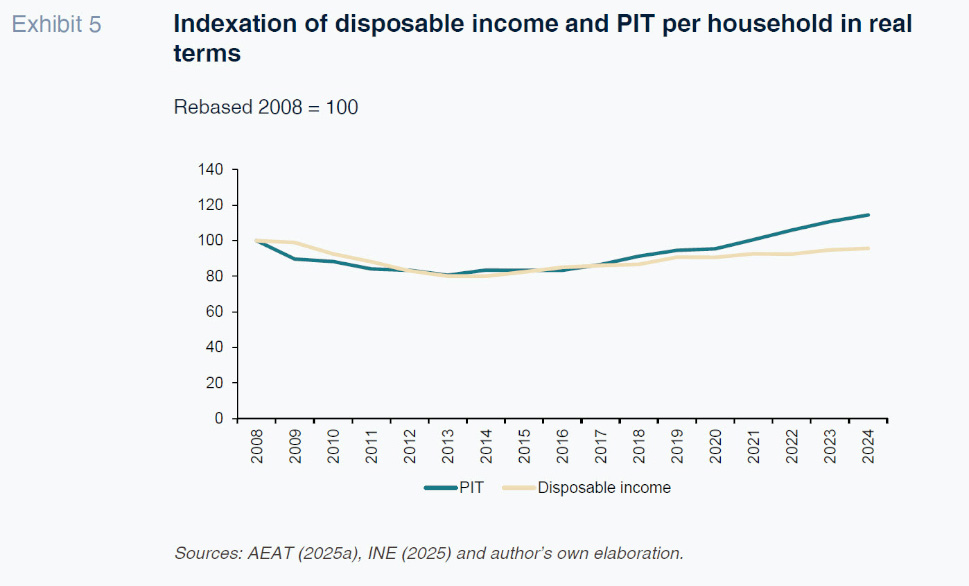
We can draw two conclusions from this Exhibit. Firstly, average net income per household in 2024 was equivalent to 95.7% of the amount taken home in 2008. In other words, more than 15 years after the financial crisis, Spanish households have yet, on average, to recoup their real economic wherewithal. Moreover, at the current pace of growth in real income, it would take several years to return to 2008 levels. Secondly, the average amount of PIT paid in 2024 is sharply higher than in 2008. Given that PIT payments condition disposable income, it can be said that the non-indexation of tax for inflation in the years since the health crisis has slowed growth in real household income. Note that the fiscal drag effect is cumulative so that the erosion of real income will continue to increase in the absence of specific adjustments. At any rate, gains in real income for the labour factor will require productivity gains.
Notes
An extreme climate event that took place in Spain on 29 October 2024 taking 228 lives, mostly in the area of Valencia. The economic cost has been estimated at 0.7pp of GDP, 0.4pp related to 2024 and 0.3pp to 2025 (AIReF, 2025).
In addition to social security contributions, these four taxes comprise the backbone of the state’s non-financial income, with a share of 90% (IGAE, 2024).
Social security contributions also increased by 6%, whereas non-tax revenue decreased by 2.9%.
However, in 2025, olive oil continues to carry VAT of 4%, instead of 10% before 2023.
References
AEAT. (2025a). Historical series tracking tax bases, rates and taxes accrued.
https://sede.agenciatributaria.gob.es/Sede/
datosabiertos/catalogo/hacienda/Informe_mensual_de_Recaudacion_Tributaria.shtmlAEAT. (2025b).
Monthly Tax Collection Reports – March 2025.
https://sede.agenciatributaria.gob.es/Sede/
datosabiertos/catalogo/hacienda/Informe_mensual_de_Recaudacion_Tributaria.shtmlAIReF. (2023).
Report on the main budgetary lines of the public administrations for 2024. Report 49/23.
https://www.airef.es/en/centro-documental/informes/report-on-the-main-budgetary-lines-of-the-budgets-of-the-public-administrations-for-2024/AIReF. (2024).
Report on the Medium-Term Fiscal-Structural Plan 2025 – 2028. Report 51/24.
https://www.airef.es/en/centro-documental/informes/report-on-the-medium-term-structural-fiscal-plan-2025-2028-2/AIReF. (2025).
Report on the Initial Budgets of the General Government 2025. Report 3/25.
https://www.airef.es/en/centro-documental/informes/initial-budgets-informes/report-on-the-initial-budget-of-the-general-government-2025/CIS. (2022).
Tax Barometer, March 2022. https://www.cis.es/en/catalogo-estudios/resultados-definidos/barometrosCIS. (2025).
Tax Barometer, March 2025. https://www.cis.es/en/catalogo-estudios/resultados-definidos/barometrosFUNCAS. (2024).
Third Funcas Christmas Survey. https://www.funcas.es/prensa/solo-uno-de-cada-cinco-espanoles-cree-que-2024-ha-sido-un-buen-ano-para-espana-en-el-terreno-economico/?utm_source=chatgpt.comFUNCAS. (2025). Top 100 Spanish economic indicators.
https://www.funcas.es/coyuntura-economica/espana/IGAE. (2025).
General Government Accounts. Annual Information.
https://www.igae.pap.hacienda.gob.es/sitios/igae/es-ES/Contabilidad/ContabilidadNacional/Publicaciones/Paginas/iacuentasAAPP.aspxIMF. (2025).
World Economic Outlook, April 2025: A Turning Point Amid Shifting Policies. Washington, D.C.: IMF.
https://www.imf.org/en/Publications/WEO/Issues/2025/04/15/world-economic-outlook-april-2025INE. (2025).
Encuesta de Condiciones de Vida. https://ine.es/dyngs/INEbase/es/operacion.htm?c=Estadistica_C&cid=1254736176807&menu=ultiDatos&idp=1254735976608OBSERVATORIO DE MÁRGENES EMPRESARIALES. (OME). (2024).
Six-Monthly Report 2023/H2: Recent trend in the corporate mark-up in Spain. Bank of Spain. AEAT, INE and Central Balance Sheet Data Office.
SPANISH MINISTRY OF LABOUR AND SOCIAL SECURITY. (2025).
Collective bargaining agreement statistics. https://expinterweb.mites.gob.es/series/TORRES, R. (2025).
El núcleo duro del crecimiento español [The hard core of Spanish growth] Published in
El Pais on 4 May 2025.
ROMERO-JORDÁN, D. (2025a). Estimating the impact of inflation on Spain’s tax burden: The hidden effects of fiscal drag
Spanish and International Economic and Financial Outlook, Vol. 14, No. 2.
https://www.funcas.es/wp-content/uploads/2025/03/Desiderio_14-2_1.pdf/ROMERO-JORDÁN, D. (2025b).
Impacto de la inflación sobre la factura de IVA de los hogares españoles en el período 2021-2024 [Impact of inflation on Spanish households’ VAT bills 2021 – 2024]. Investigaciones de Funcas, February 2025.
https://www.funcas.es/documentos_trabajo/
impacto-de-la-inflacion-sobre-la-factura-de-iva-de-los-hogares-espanoles-en-el-periodo-2021-2024/
Desiderio Romero-Jordán. Rey Juan Carlos University and Funcas