
An analysis of Spanish exports post-COVID-19: An opportunity in times of change?
Following the drop in international trade caused by COVID-19, Spain saw a strong rebound in exports. While it is too soon to say whether this marks a turning point for Spanish exporters, some early data point to a structural shift in Spain’s trading patterns.
Abstract: This paper analyses the extent to which the COVID-19 crisis has shifted the Spanish economy’s international competitiveness, creating new opportunities for Spanish businesses. While the drop in Spanish imports and exports post-COVID-19 (close to 40% year-on-year) was comparable to the contraction sustained in the wake of the Global Financial Crisis of 2008, the rebound, with year-on-year growth in exports of over 70% in April 2021, has been far more dynamic. This raises the question of whether Spain is simply catching-up after trade flows were interrupted in 2020 or whether this is the beginning of a significant structural change in Spanish trading patterns. Although it is still too soon to provide a clear answer to that question, initial data point to a structural shift. Spain’s long-standing non-energy trade deficit turned into a surplus in the first half of 2021. Additionally, the food industry was the sector which made the biggest contribution to the recovery in exports, fuelled mainly by non-EU markets. The fact that the food sector is a core component of Spain’s export effort, and has a history of robust export-oriented productive capacity, is a possible indicator of a structural improvement in the Spanish economy’s international positioning.
Introduction
This paper analyses the extent to which the COVID-19 crisis has changed the Spanish economy’s international competitiveness. Its purpose is to contribute to the current debate about the opportunities and challenges facing the Spanish economy as it recovers (Torres and Fernández, 2021) and to take previous analyses further (Xifré, 2015, 2019). The paper focuses on imports and exports of goods between Spain and the EU and non-EU markets based on Eurostat data up until June 2021. We first present an assessment in aggregate terms and then analyse the key trends by sector.
In addition to providing a snapshot of the state of Spanish trade, this article aims to provide insight into current thinking about the Spanish economy’s place within an international context that continues to be affected by post-COVID-19 adjustments.
Aggregate analysis
We begin by examining recent trends in the trade of Spanish goods compared with longer-run trends. Exhibit 1 shows the year-on-year rates of change in monthly Spanish imports and exports between June 2001 and June 2021. Note that excluding the crises periods, most of the fluctuations have ranged within rates of growth of 20% and contractions of 10%.
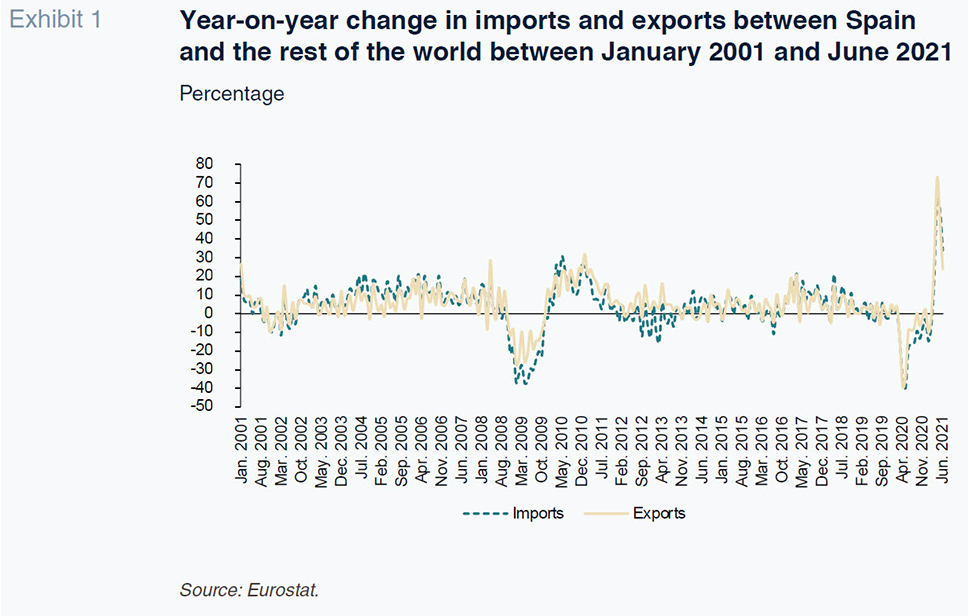
After the onset of the Global Financial Crisis in 2008, Spanish exports contracted by slightly below 30% for several months, with imports decreasing by as much as 40%. The period of atypically high year-on-year rates of contraction (over 20%) lasted broadly from November 2008 until October 2009 for imports and from January until July 2009 for exports. These periods were followed on the whole by months of abnormally high growth (also over 20%) from March 2010 until January 2011 in the case of imports and through to April 2011 in the case of exports.
Turning to the COVID-19 crisis, the periods of sustained contractions did not last as long (between March and August 2020 for imports and only from March to May 2020 for exports) but their intensity was more pronounced (with the pace of decline in both flows peaking at 40% year-on-year). Most noteworthy, however, is the buoyancy of the recovery in both imports and exports, which is largely attributable to the sharp corrections of 2020. In April 2021, Spanish exports registered year-on-year growth of 73%, easing to 50% in May, while imports grew by 62% and 56% for those months, respectively. Such sharp swings were not observed in the last crisis. In short, the figures confirm that we are in the midst of a period that is clearly atypical, with little indication as to when it will end.
Exhibit 2 shows the monthly trend in foreign trade in Spanish goods broken down in two ways: (i) by destination, i.e., intra-EU-27 and extra-EU-27; and, (ii) by the direction of the flows, i.e., imports and exports. The four series have been rebased to January 2020, an approach that reveals the speed of recovery in each series.
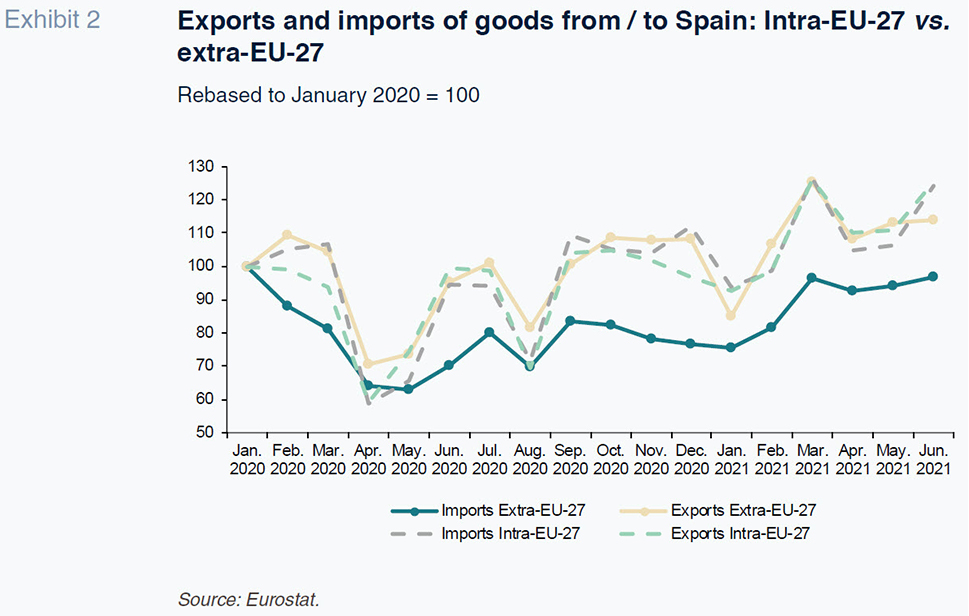
The intra-EU-27 series depicts a trend that is similar for both exports and imports. As already shown, both series contracted by as much as 40% and the trend post-pandemic has been comparable, with imports and exports revisiting January 2020 levels in February 2021. The trend in extra-EU-27 exports from Spain is fairly similar to the first two series. Extra-EU-27 imports to Spain, on the other hand, have etched out a different trend. The impact of the initial rout of April 2020 was similar to the first three series but the recovery has proven slower. January 2020 levels were still out of reach as of June 2021. Thus, the trend in imports to Spain from the rest of the world has differed from the trend in exports of Spanish goods to the rest of the world and to that of imports to Spain from the EU-27.
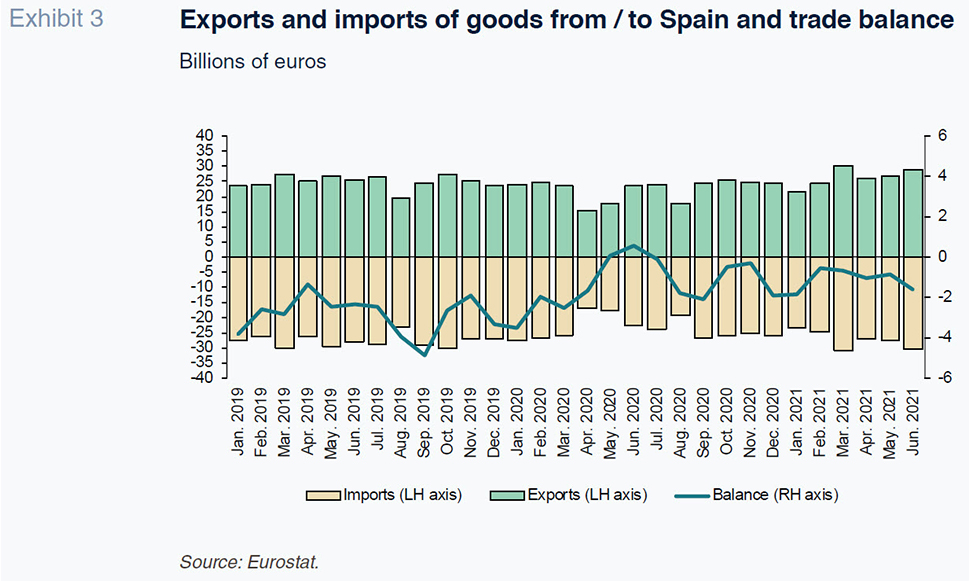
Exhibit 3 depicts the balance (exports less imports) and these two flows of goods between January 2019 and June 2021. Spain has had a persistent deficit in its trade in goods with the rest of the world, a deficit that oscillated between 1 and 5 billion euros a month in 2019. The COVID-19 crisis reduced that deficit, with Spain actually reporting small surpluses of 46 and 575 million euros in May and June 2020. These surpluses are likely due to the exceptional circumstances created by the pandemic rather than a structural improvement in Spanish companies’ international positioning. Spain’s monthly trade deficits post-COVID-19 have fluctuated within a significantly narrower range, without topping the 2-billion-euro mark to date.
To determine the source of the structural improvement in the Spanish economy’s international standing, Exhibit 4 breaks down the aggregate trade balance between intra-EU-27 and extra-EU-27 contributions.
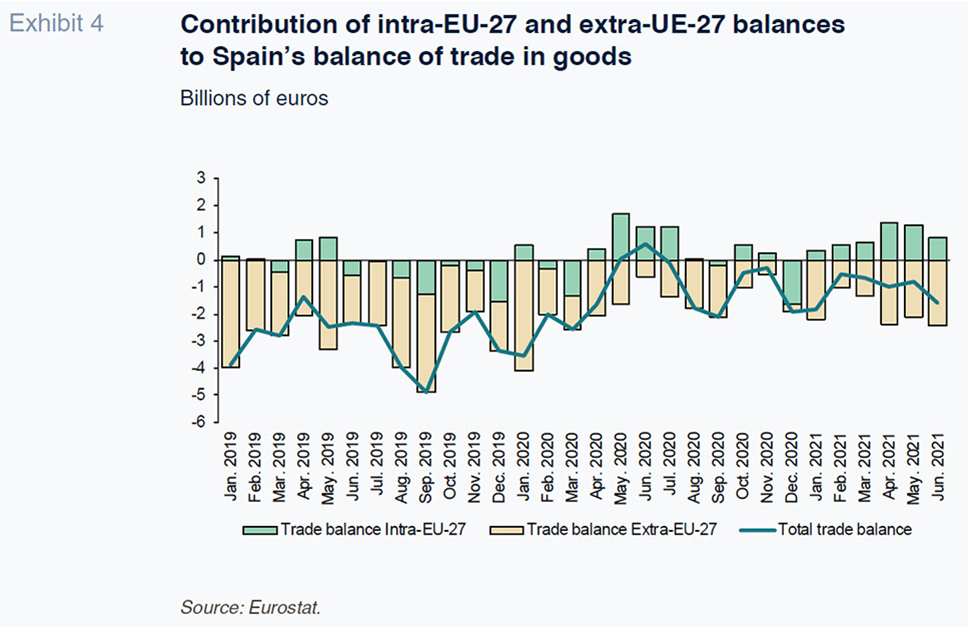
The first takeaway is that intra-EU-27 trade is more balanced than Spain’s extra-EU-27 trade, which yields systematic and substantial deficits due to the importation of energy products. Pre-COVID-19, the only intra-EU-27 surpluses were observed in March and April 2019 and February 2020. Exhibit 4 shows how the improvement in the overall balance post-COVID-19 is the result of recurring intra-EU-27 surpluses since January 2021. Note that the improvement in the intra-EU balances has been accompanied by worsening extra-EU deficits, such that the aggregate trade deficit has widened since February 2021.
Disaggregated analysis
Exhibit 5 depicts exports, imports and the overall non-energy trade balance (i.e., excluding Spain’s trade in fuels and other energy products). The energy balance is sourced from the Standard International Trade Classification of products (SITC), using category 3 products (mineral fuels, lubricants and related materials). The non-energy balance is obtained by subtracting the category 3 balance from the total trade balance.
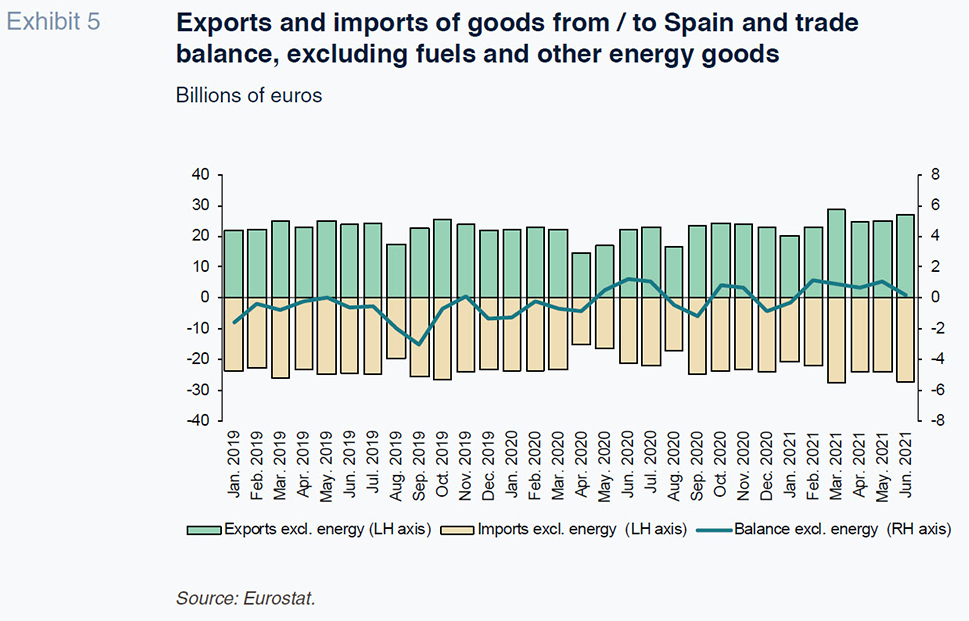
Exhibit 5 shows that Spain’s non-energy trade balance has been consistently more favourable than the overall balance, evidencing that Spain, like most industrialised countries, is a net importer of fuels and energy goods. Once again, we see a recent improvement in the non-energy balance of trade in goods in Spain, with the economy recording a surplus since February 2021.
Leaving aside 2020 due to the atypical impact of COVID-19, Table 1 presents the balances for the first six months of 2019 and 2021 based on geography (world, intra-EU-27 and extra-EU-27) and product (total trade balance, energy balance and non-energy balance).
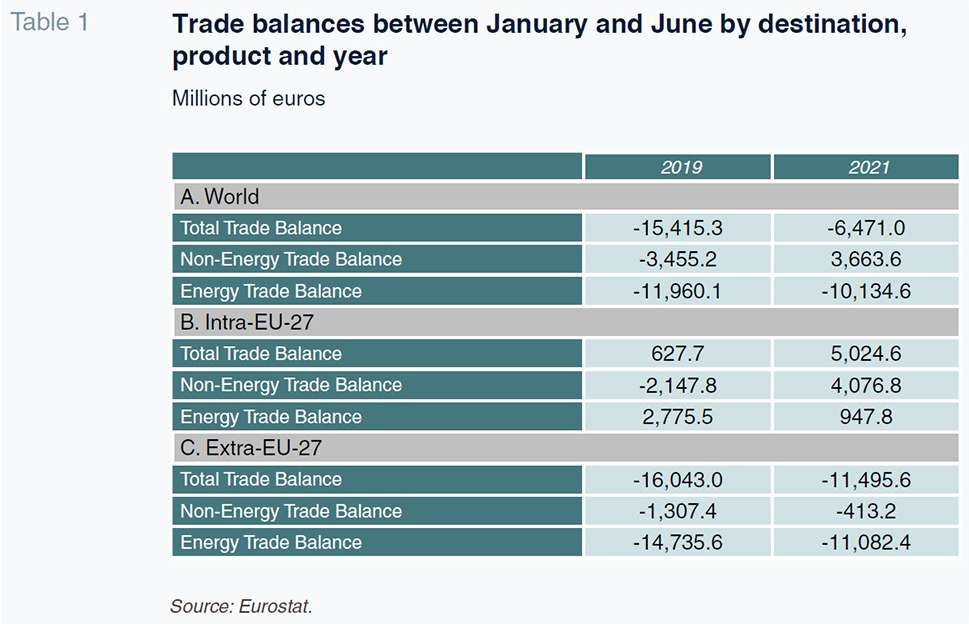
Interestingly, Table 1 highlights the shift from deficit to surplus during the first six months of the year, specifically from a deficit of over 3.4 billion euros to a surplus of more than 3.6 billion euros (Panel A of Table 1). This implies an improvement in the non-energy goods trade balance of over 7.1 billion euros in the first half of 2021 compared to the first half of 2019. As shown in Table 1 (Panel B), the bulk of the improvement in the non-energy trade balance stems from intra-EU trade, which has gone from a deficit of 2.1 billion euros to a surplus of nearly 4.1 billion euros. There has also been an improvement in the extra-EU non-energy balance (Panel C), albeit more modest. Specifically, the deficit narrowed from 1.3 billion euros in 2019 to just over 400 million euros in 2021.
To gain insight into which sectors have contributed to the improvement in the non-energy trade balance in the wake of the COVID-19 crisis, Table 2 breaks down the trade balances for the first six months of 2019 and 2021 into nine SITC product categories (excluding fuels). The table shows the non-energy balances based on destination and product category as well as presenting the change in the overall balance and contribution to the change in the overall balance by each category.
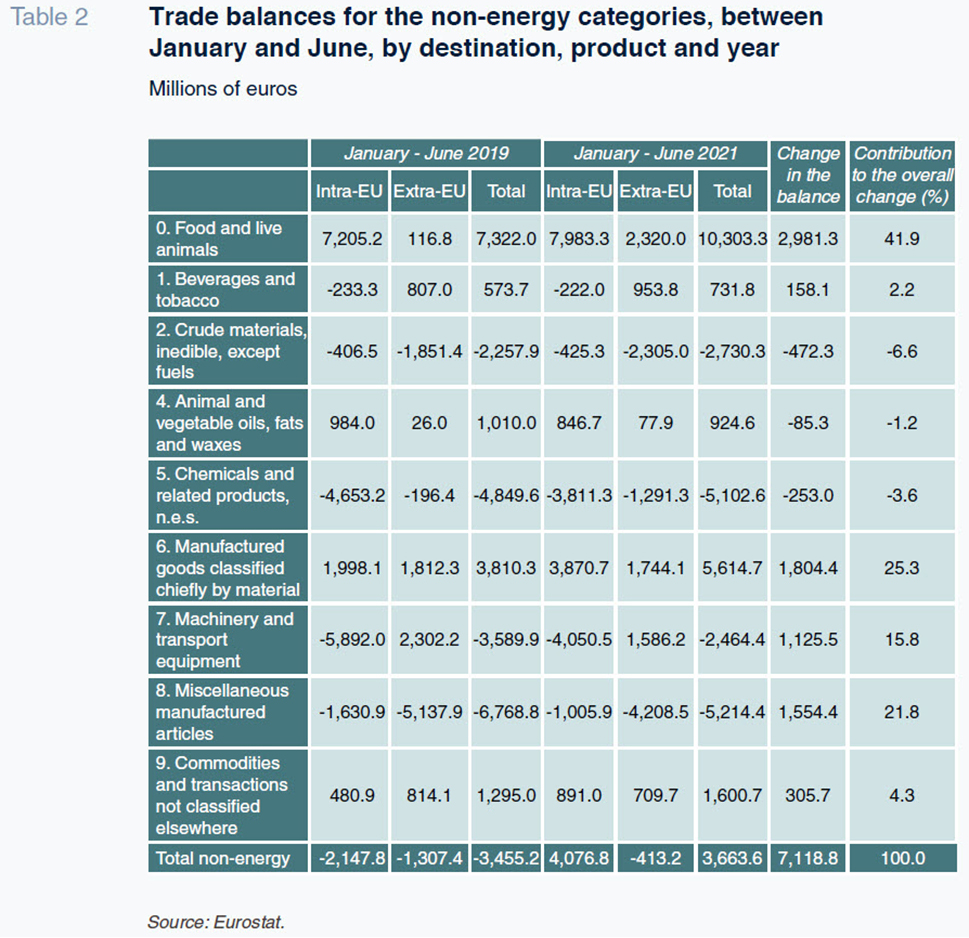
The biggest contribution to the improvement in the non-energy trade balance came from food and live animals (SITC category 0), which accounts for nearly 42% of the total improvement. Geography-wise, the improvement is concentrated in extra-EU flows, where the surplus widened significantly, from 116 million euros to 2.32 billion euros. Although the intra-EU balance of trade in food and live animals is much bigger, the improvement is more modest.
The two product categories associated with manufacturing (SITC categories 6 and 8) make a relatively similar contribution to the improvement in the overall balance. Chapter 6 –officially “Manufactured goods classified chiefly by material”– includes relatively less processed manufactured items such as leather, rubber, paper, textiles, etc., in addition to metals. Category 8 comprises more elaborate manufactured goods including apparel and footwear, furniture, scientific instruments and miscellaneous manufactured articles. Importantly, the manner in which the two categories contribute to the improvement is different. The existing intra-EU surplus in category 6 products improved considerably, from 2 billion euros to 3.87 billion euros, while the extra-EU surplus narrowed slightly. In the case of category 8, the contribution came by way of a reduction in the intra- and extra-EU deficits, with the latter falling from 5.14 billion euros to 4.21 billion euros.
Lastly, Table 2 reveals that the majority of categories made a positive contribution to the improvement in the overall trade balance in the first half of 2021, with the exception of crude materials (category 2), animal and vegetable oils, fats and waxes (category 4) and chemical products (category 5).
Conclusions
There is no recent precedent that explains the change in Spanish imports and exports during the COVID-19 crisis. The prevailing situation and outlook remain shrouded in uncertainty. While the drop in both imports and exports post-COVID-19 (close to 40% year-on-year) was comparable to the contraction in the wake of the economic and financial crisis of 2008, the rebound (with year-on-year growth in exports of over 70% in April 2021) has been far more dynamic.
The sharp recovery may be attributable to the resumption of the flows held up by the crisis. However, it may also be that the COVID-19 crisis has triggered structural changes in the Spanish economy’s trading patterns. However, it is not possible to provide a definitive explanation to these trends.
In 2019, Spain’s monthly trade deficit fluctuated between 1 and 5 billion euros. The monthly deficits post-COVID-19 have been oscillating within a narrower band and have not exceeded 2 billion euros. The improvement is chiefly attributable to intra-EU trade, where Spain has gone from virtually systematic deficits pre-COVID-19 to presenting recurring surpluses since January 2021.
It is worth highlighting that the non-energy trade balance has gone from a deficit of over 3.4 billion euros in the first six months of 2019 to a surplus of over 3.6 billion euros in the first half of 2021, i.e., an improvement of over 7.1 billion euros. Sector-wise, the food industry, driven mainly by extra-EU-27 trade, made the biggest contribution to the improvement in the overall trade balance. After food, the improvement in the non-energy balance is attributed to the improvement in the balance of trade in manufactured goods, both processed and less transformed articles, driven above all by intra-EU exports.
While it is too soon to talk about structural changes, the fact that the primary sector, an established pillar of Spanish exports with a proven and resilient productive base, is largely responsible for the improvement in the overall trade balance bodes well for the future of Spanish trade.
References
TORRES, R. and FERNÁNDEZ, M. J. (2021). Spanish economy in recovery mode: opportunities and challenges. Spanish Economic and Financial Outlook, Vol. 10, No. 4, July 2021.
XIFRÉ, R. (2015). The internationalisation of the Spanish economy: Progress, limitations and best practices. Spanish Economic and Financial Outlook, Vol. 4, No. 6, November 2015.
XIFRÉ, R. (2019). Opening up of the Spanish economy: Recent performance and pending reforms. Spanish Economic and Financial Outlook, Vol. 8, No. 6, November 2019.
Ramon Xifré. ESCI – Universitat Pompeu Fabra, UPF Barcelona School of Management, PPSRC – IESE Business School