
The drivers of business profitability in Spain: Size, sector and regional dynamics
Spanish business profitability has recovered to pre-crisis levels in line with the economic cycle, but remains deeply uneven across firms, sectors, and regions. Differences in productivity, firm size, and exposure to competition are some of the factors that explain the disparities in profitability levels.
Abstract: Spanish business profitability follows a clearly procyclical pattern, with the average return on investment reaching 6.7% in 2024, matching levels last observed in 2008 after more than a decade marked by crisis-related volatility. Beneath this aggregate recovery, however, profitability remains highly uneven across sectors, regions, and firm sizes, reflecting persistent differences in productivity, capital intensity, exposure to competition, and business strategies. Microenterprises—accounting for nearly 90% of firms with employees—continue to post the weakest returns, consistent with their pronounced productivity gap, while medium-sized firms currently outperform both small and large enterprises. Sectoral disparities are likewise substantial and persistent over time, with information and communication, electricity, and distributive trade at the upper end of the profitability distribution, and real estate and primary activities at the lower end. Regional differences are largely shaped by productive specialization and business demographics, illustrating how structural features of local economies condition firms’ ability to generate profits. Given the central role of profitability in ensuring business viability, supporting investment, and sustaining employment and public revenues, the evidence underscores the need for public policies that foster productivity growth—through stable and efficient regulation, incentives for reinvestment, and investment in human capital, technology, and intangible assets.
Foreword
For any economy to perform well, its productive structure needs to be populated by profitable companies. Only profit-making companies can grow (reinvesting their profits) and innovate, unlocking productivity gains and enabling them to compete in the marketplace. Profitability is also an enabler of job creation and better pay and helps sustain the welfare state by lifting public revenue.
In contrast, if the business ecosystem is populated by scantly profitable firms, it is less resilient to adverse shocks, if nothing else because unprofitable companies are unable to shore up their own funds, which exist precisely to cover unanticipated losses. If profits are slim, the ability to invest and, by extension, grow is jeopardised.
For all of these reasons, it is important to analyse business profitability, which reflects the efficiency with which companies use their inputs, providing an indicator of financial stability and the quality of their business models. To achieve the required profitability threshold, it is important to create a conducive climate, marked by adequate regulatory frameworks, institutional stability and productivity-friendly policies. Only in this manner will economic growth be sustainable, supported by profitable firms.
Against this backdrop, the goal of this paper is to analyse the profitability of the Spanish business ecosystem from different perspectives: over time, by sector, by region and by company size. This multidimensional analysis is possible thanks to the wealth of information provided by the Bank of Spain’s BExplora database, whose statistics run until 2024. Specifically, it provides information for the non-financial private sector since 2008 by region and province for 12 sectors of the economy and four company size categories (micro, small, medium and large) [1]. The analysis of the differences in profitability associated with business size is of particular interest, underlining the importance of size-driven productivity differences.
Profitability and the economic cycle
Business profitability is closely and consistently correlated to the economic cycle. During years of growth, the boom in demand and improvement in consumer and investor confidence allows businesses to make better use of their installed capacity and helps drive down unit costs (leveraging potential economies of scale), which translates into higher profits and margins. In contrast, during years of contraction, demand shrinks and confidence deteriorates in the face of greater uncertainty, translating into lower revenue and higher unit costs and exerting downward pressure on profits and margins. These transmission mechanisms explain why profitability is procyclical, while also fuelling a vicious circle which feeds the cycle: higher profits translate into higher investment and employment, feeding the expansion, whereas scarce profits or losses lead to job losses and make it impossible to invest, accentuating the contraction.
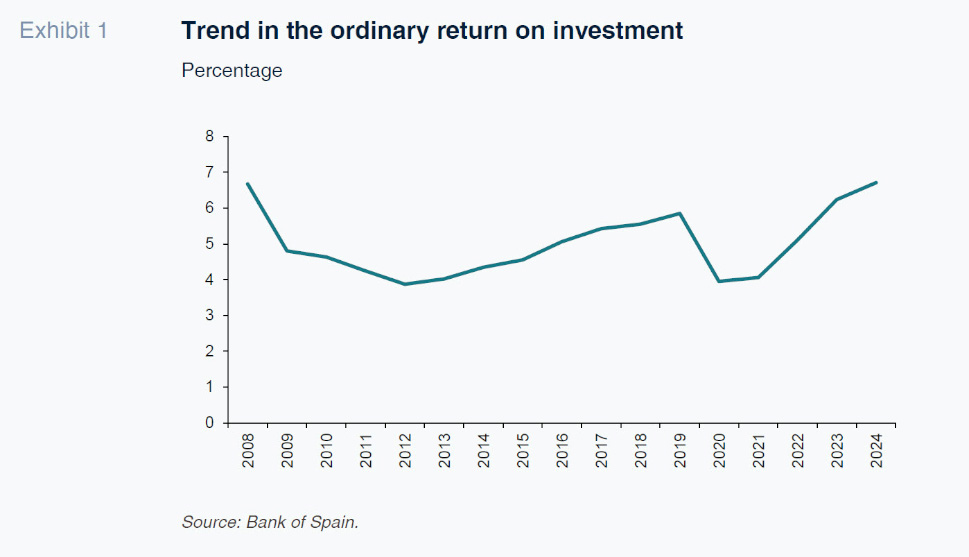
Exhibit 1 illustrates this clear correlation between business profitability and the economic cycle in Spain. In the year the Great Recession broke out, 2008, the Spanish economy reported a healthy return on investment of 6.7%, going on to hit a trough of 3.9% in 2012 (the year in which Spain had to ask for a bailout for its banks from Europe). From there, profitability embarked on a slow recovery until 2019, when it reached 5.8%. In 2020, the economic crisis unleashed by the Covid-19 pandemic triggered a contraction of 10.9%, pushing profitability down to 3.9%, similar to the 2012 figure. Since then, up until 2024, the economy has been clearly recovering, allowing business profitability to revisit the levels seen in 2008 (6.7%)
[2].
Profitability differences by sector
The economic cycle does not have the same impact on all areas of activity, affecting the various levels of profitability recorded by the various productive sectors. Some sectors, such as construction and activities exposed to certain types of consumption, tend to be more cyclical, so that their profitability fluctuates with greater intensity and marks bigger differences between the peak and trough of the cycle. Other more strategic sectors (energy, food and certain basic services, for example) are more stable throughout the cycle, spelling more stable profitability. However, irrespective of the effect of the economic cycle, there are structural factors (such as the intensity with which capital and labour are used, the risk assumed by each sector via exposure to business volatility, the degree of competition and the level of openness to international markets) that affect the level of profitability a sector can aspire to.
As shown in Exhibit 2, regardless of the year analysed, there are marked differences in profitability across sectors. Focusing on 2024 (the most recent year for which these figures are available), profitability ranges from a low of 2.6% (which is less than half of the average) in real estate activities to a high of 11.7% in the information and communication sector, so that the highest value is nearly five times the lowest. Profitability is also notably high in the wholesale and retail trade sector (11.4%) and the electricity sector (10.7%). Compared to 2019 (the year before the onset of the pandemic), there are some differences in the ranking but the same sectors lie at either extreme. In general, irrespective of the year analysed, certain sectors rank consistently in the top part of the ranking, including information and communication, electricity and the distributive trade. The same is true of the bottom end, where the real estate activities and primary sectors are regulars.
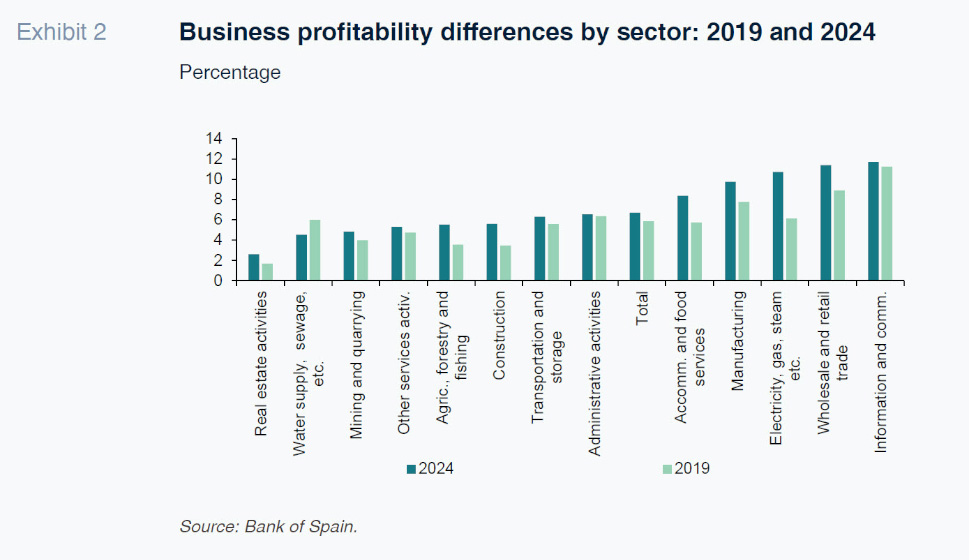
The comparison between 2024 and 2019 indicates that except for one sector (water supply and sewage), profitability has increased across the board, with the electricity sector standing out for its 4.6 pp increase.
Profitability and size
One aspect of profitability of particular analytical interest is the relationship between profitability and company size. Specific factors explain the positive correlation, including the differences in unit costs associated with size, the capacity to innovate and the quality of the human capital used. For these reasons, larger companies tend to present higher profitability levels, exhibiting their ability to leverage economies of scale, higher observed productivity levels, access to financing on more attractive terms and capacity to diversify into new markets and products, mitigating risk. In contrast, smaller companies tend to bear more onerous financial conditions, cannot unlock economies of scale, have less negotiating power with suppliers and are less productive. However, within the SME universe, it is important to distinguish again by size, as micro enterprises tend to pose the lowest profit levels, among other things because they are the least productive.
As shown in Exhibit 3, the differences in profitability by company size are significant regardless of the year analysed. The micro enterprises (those with fewer than 10 employees, which in Spain account for 89% of all companies with employees) are by far the least profitable; the differences are narrower across the rest of size categories. There is no linear correlation between size and profitability, although this condition does hold between 2008 and 2013 (profitability increases moving from one size category to the next one up). Since then, the medium-sized enterprises have been the most profitable, albeit only marginally more profitable than the small businesses. The large enterprises lost their profitability leadership in 2013 and the gap has been widening in recent years. In 2024, the return on investment at the large enterprises was 6.9%, compared to 9.5% at small businesses and 10.7% at the medium-sized firms. Among micro enterprises, profitability that year was just 4.1%.
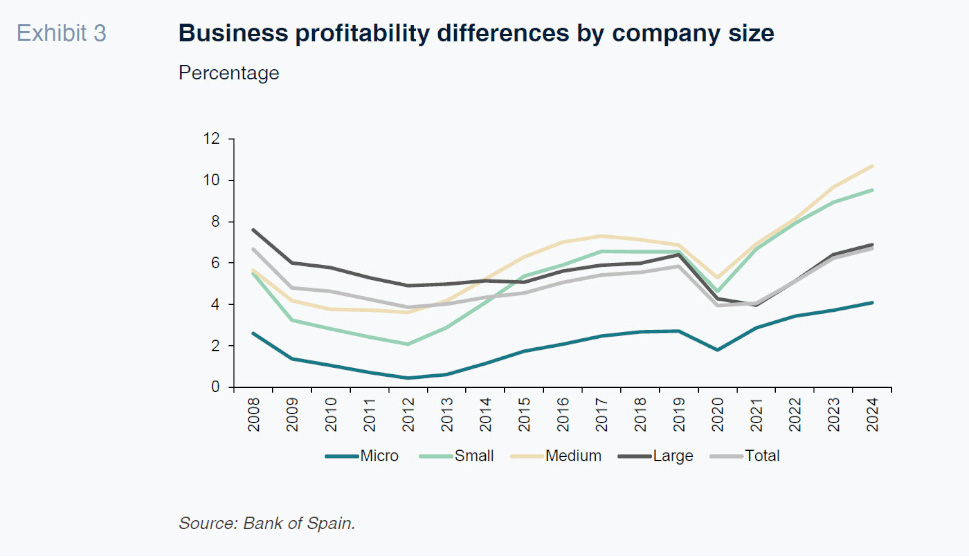
The fact that the largest companies are reporting lower profitability levels than the smaller companies (other than the micro enterprises) may be attributable to several factors. Firstly, the larger companies tend to be more focused on international markets, where competition is usually more intense, translating into tighter margins. Secondly, many large corporations strategically seek high sales volumes and global market shares, sacrificing profits and margins to a degree. The higher costs associated with international expansion derived from logistics, compliance efforts spanning multiple jurisdictions and organisational complexity may also influence their lower profitability; they are also more exposed to external factors such as exchange rate fluctuations and geopolitical uncertainty. The impact of these factors may vary by sector but help explain why certain larger companies report lower profitability levels than their smaller counterparts.
Productivity: Size matters
As already noted, productivity is a clear but not the only determinant of profitability. As a result, the productivity ranking need not necessarily imitate the profitability ranking.
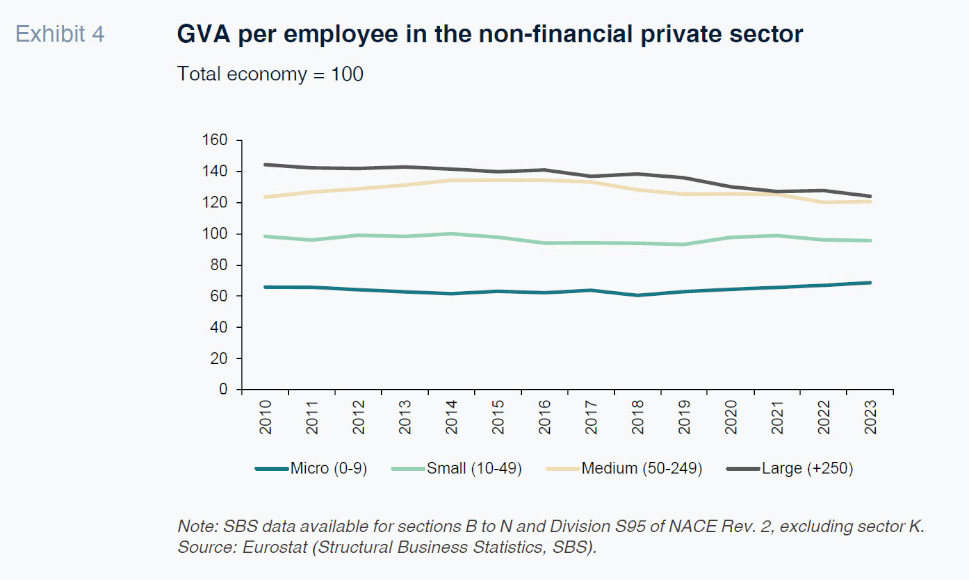
What the Spanish case tells us is that company size is crucial in explaining productivity differences among companies. This is borne out by Exhibit 4, which depicts GVA per employee for the entire non-financial private sector and by company size. In this case, regardless of the year analysed, there is a positive and continuous correlation between size and productivity moving from one size category to the next. Looking at 2023 (the most recent year for which this variable is available), labour productivity at the large enterprises is 24% above the average. At the medium-sized companies it is also 21% higher but at the small and micro enterprises, productivity is 4.4% and 31.3% below the average, respectively. These are sizeable differences that persist throughout time.
Profitability differences by region
We have seen that there are substantial differences in business profitability levels from one sector to another. It is important to remember this when interpreting the profitability differences by region, which are largely explained by the various productive structures characterising each region, although business demographics also play a role (for example, the higher the share of micro enterprises, the lower the region’s likely profitability mark). It is therefore logical for the regions more specialised in the more profitable sectors (those that use capital, technology and knowledge more intensely, which are more productive and better positioned to leverage economies of scale) to post higher profitability levels. In contrast, the regions where the less productive sectors are relatively more important are bound to be less profitable. In addition, as already noted, each sector tends to perform differently with respect to the economic cycle, similarly affecting regional profitability differences. Overall, productive specialisation conditions businesses’ ability to generate profits and may explain a substantial part of the regional differences in profitability.
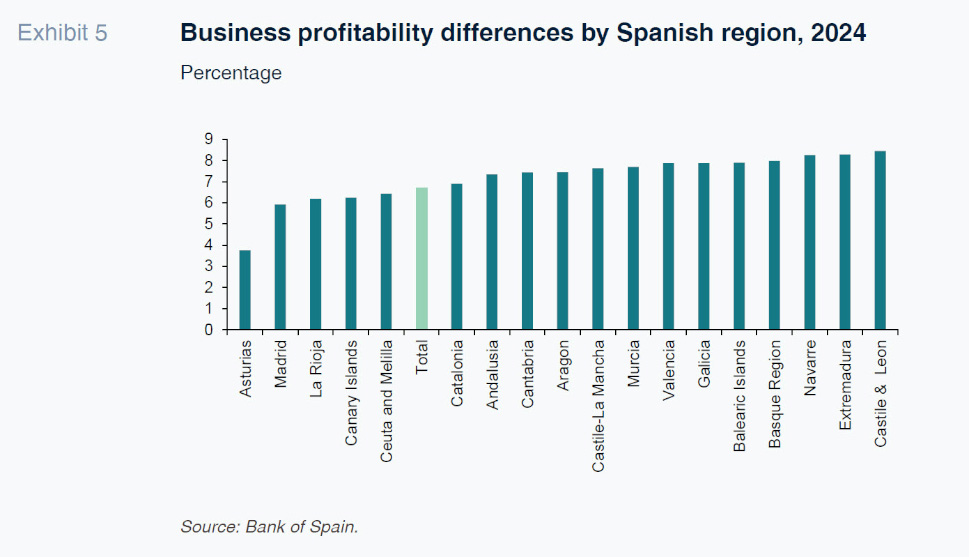
Focusing on the most recent statistics for 2024, we again see important differences in average business profitability levels by region (Exhibit 5). Compared to the national average of 6.7%, businesses in Asturias present an average rate of just 3.8%, compared to 8.4% in Castile & Leon. Average regional business profitability is also above the 8% mark in Navarre and Extremadura. The Madrid figure is a surprisingly low 5.9%. This may be attributable to the relatively high weight in its economy of the services sector, specifically administrative, real estate and professional services, among others, relative to higher margin sectors. The high business density encountered in Madrid also depicts a more competitive market, which translates into lower margins.
Key messages and takeaways
Business profitability performs in a clearly procyclical manner. The Spanish experience empirically confirms this correlation, borne out by a return on investment in 2024 (a year of clear growth) of 6.7%, which is similar to that observed in 2008 and well above the trough of 3.9% recorded during the worst years of crisis (2012 and 2020).
The economic cycle has an uneven impact on business profitability, varying significantly by sector. The more cyclical activities, such as construction and certain classes of consumer goods, present bigger profitability swings from cycle peak to trough, whereas profitability in more strategic or basic sectors is relatively stable. Beyond the cycle, structural factors such as capital intensity, business volatility (and therefore risk), competition intensity and openness to international markets shape sector profitability levels. The data show that these differences are persistent over time: some sectors rank systematically towards the top of the table, with others featuring consistently towards the bottom. In 2024, sector profitability ranged from very low levels in real estate activities to high percentages in information and communication, energy and the distributive trade.
The differences in profitability by company size are substantial irrespective of the year analysed. The micro enterprises are by far the least profitable, with the differences narrower across the other size categories. A linear correlation does not exist between size and profitability: although this condition holds between 2008 and 2013, since then, the medium-sized companies have been the most profitable, albeit not much more so than the small businesses. In 2024, profitability across large enterprises averaged 6.9%, compared to 9.5% for the small businesses and 10.7% at the medium-sized companies. Among micro enterprises, profitability that year was just 4.1%. Lower average profitability in the cohort of large firms compared to the SME universe may be attributable to several factors, including their orientation towards international markets, bringing greater exposure to competition, and/or different business strategies (based more on volume than profitability).
One factor that clearly affects business profitability is productivity. The Spanish evidence conclusively demonstrates the importance of size on productivity. The low productivity of the micro enterprises (which represent 89% of the population of businesses with employees), which in turn shapes their low profitability, stands out.
The are marked differences in business profitability by region, affected by productive specialisation and differential business demographics.
In addition to these messages gleaned from the empirical evidence provided, it is important to underscore the value of having a competitive and profitable business ecosystem, profits being a prerequisite for company viability. Thus, the authorities need to design economic policies that help companies be profitable, taking action around the factors that shape productivity and growth. That means creating an efficient and stable regulatory environment that reduces uncertainty and designing taxation to stimulate the reinvestment of profits and innovation. Productivity also remains a critical factor and can be enhanced by addressing its key determinants, including investment in intangible assets—central to digitalisation—as well as training and the adoption of new technologies.
Notes
The ordinary return on investment (our proxy for profitability) is defined as the ratio between ordinary net profit plus financial costs and net assets (equity + interest-bearing borrowings). Ordinary net profit is defined as gross value added less personnel costs plus financial income less financial costs less net depreciation and operating provisions.
The trend in the return on investment is similar to the pattern in the corporate mark-up, expressed as gross operating surplus over revenue, set down in the Bank of Spain report (2025).
References
BANK OF SPAIN. (2025). BExplore Regional Central Balance Sheet Data Office: A New Statistical Tool with Business Information by Autonomous Communities and Provinces.
BANK OF SPAIN. (2025). Business Margins Observatory (OME). Annual report, 2024. 23 October 2025.
Joaquín Maudos. Professor of Economic Analysis at the University of Valencia, Deputy Director of Research at Ivie and collaborator with CUNEF