
Economic profits and investment dynamics in Spanish non-financial corporations
Spanish NFCs earned modest economic profits averaging 3% of output between 2000 and 2024, fluctuating from 4–5% before the 2008 crisis to near zero after the pandemic. Investment closely followed the gap between these profits and the user cost of capital, while the sector shifted toward producing internally rather than buying intermediate goods.
Abstract: Spanish non-financial corporations generated modest economic profits averaging 3% of output over 2000–2024, though profits fell near zero during the 2009–2013 crisis and remained weak after the pandemic. Corporate investment mirrored these economic profits, rising when returns exceeded capital costs and stalling when profits were insufficient, even as output and employment recovered. Over the period examined, firms shifted from buying intermediate goods toward internal production, increasing the share of value added and producing more capital-intensive goods. This structural shift amplified the lag between growth in output and employment and the pace of investment, as firms prioritized profitability over rapid expansion of capacity. Accounting profits masked these dynamics, offering a misleading signal of incentives to invest. The patterns suggest that slow investment in recent years reflects rational adjustments to economic returns rather than widespread financial constraints, highlighting the importance of measuring opportunity costs alongside traditional profit metrics.
Foreword
Business profits are important for macroeconomic analysis for several reasons. [1] Firstly, together with wages, profits influence the formation of the prices of the goods and services sold in the market. Secondly, expectations about future profits shape corporations’ investment and hiring decisions, which, on aggregate, determine the fate of the economy’s productive capacity. Thirdly, profits act as a residual rather than a predetermined income stream, cushioning the effects of economic shocks and cyclical changes on the trend in unit labour costs. Lastly, business profits constitute the portion of value added that remunerates the providers of capital (complementing the other part, which is used to remunerate workers), thus more or less profit has consequences for income distribution. However, there is no single measure of business profit, and it is important to understand which metric is best suited to the type of macroeconomic analysis to be performed.
This paper estimates the annual economic operating profit of the universe of non-financial corporations (NFCs) in Spain between 2000 and 2024,
i.e., since the birth of the euro, and appraises its utility in informing production and investment decisions.
[2] Economic operating profit is calculated as the difference between the value of output and total costs, including intermediate consumption, employee compensation and the user cost of capital. The data for the value of output, cost of intermediate consumption and cost of labour come from the Spanish economy’s annual financial statements by institutional sector, published by Spain’s statistics office, the INE, particularly for the NFC sector. The cost of capital per se is not referenced in either the national accounts or the corporations’ accounting records, therefore, the estimation of economic profit requires prior estimation of this cost.
Corporations purchase intermediate inputs and labour services in the market. In theory, it is possible for them to likewise rent the capital services needed for production in the market. In practice, however, the production of goods and services is carried out using fixed and working capital that is owned by the corporations around which business activities are articulated for legal purposes. These capital services are provided in-house so that there is no market rental price that can be used to allocate a cost to them, hence the term “user cost of capital”. Accounting standards take stock of the costs of intermediate consumption and remunerated labour to calculate profit as these are explicit costs (market transactions), but do not factor in the user cost of capital, which constitutes an opportunity cost. Calculating the user cost of productive capital requires knowing the unit cost and stock of the capital services used by the Spanish NFC sector. The unit cost is calculated for this paper; the stock information comes from an earlier piece of research (Salas Fumás, 2025b).
The contents of this paper are primarily informational rather than analytical. In other words, profit is not explained as a result of ex ante business decisions, thus its performance is not expressly correlated with developments in technology, the economic cycle or relative prices. By way of new information, besides the estimates of the user cost of capital and economic profit, the analysis notably reveals changes in the relative weights of intermediate consumption and its corollary gross value added (“buy” versus “make”) in the value of NFC output and the remarkably close relationship between economic profit, as a proxy for the incentive to invest, and NFC net capital formation in Spain.
The paper is divided into a first section addressing the differences between accounting and economic profit and user cost of capital theory; section two estimates the user cost of capital; the third section is devoted to calculating economic profit as the bottom line in the NFC profit and loss statement for the period analysed; section four analyses the relationship between economic profit and investment in fixed capital; and the concluding section underlines the most important takeaways and the limitations of the study.
Accounting versus economic profit
The calculation of the accounting and economic profit generated by the production of goods and services for sale in the market, which is then applied to the estimate of NFC profits in Spain, is summarised in Table 1.
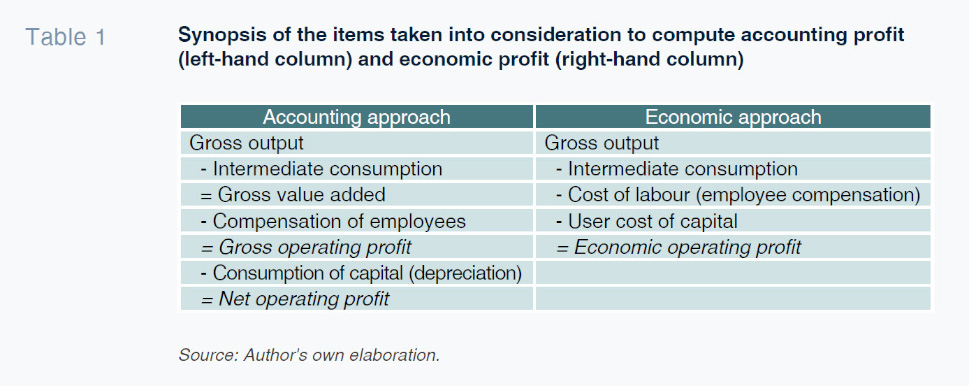
Both profit measures are calculated by subtracting the production costs incurred from revenue (value of the goods and services produced at their market sales prices), however, the costs taken into consideration are different for each. Accounting profit includes the costs of the inputs purchased in the market, intermediate goods and wage labour and also the consumption of capital services in the form of the depreciation sustained by a corporation’s productive capital during the financial year. Net operating accounting profit is the residual that remains after deducting from gross output the explicit costs of intermediate consumption, wages and the costs of replacing the capital consumed.
If corporations were to rent their capital assets in the market, the rental price would turn the cost of capital into an explicit cost and accounting profit would coincide with economic profit. However, high “agency” costs of rental (related with asymmetric information between capital owners and users; Jensen and Meckling [1976]) mean that it makes sense for businesses to organise their productive activity around legal persons —corporations— in which the law grants separate legal personality to purchase and hold owned goods, specifically including the capital goods needed for production. Corporations furnish themselves with the capital services needed to produce internally and there is no market price for benchmarking the cost of the transaction even though there is a cost of opportunity. Accounting standards, which would allow for the recognition of the rental of capital as a cost, do not contemplate the user cost associated with internal provision of the resource, as it constitutes an implicit or opportunity cost.
When the capital used in production is owned by the corporation that formulates a profit and loss statement, accounting profit is not a reliable measure of the economic “value” created by production because it ignores the opportunity cost of tying up their capital. Economic profit is a better proxy for the economic value created. However, the user cost of capital is not a publicly available metric and requires estimation, as explained next.
Calculating the user cost of capital
The theory
In economic theory, the user cost of capital emerges as a shadow price associated with the optimal value of a dynamic optimisation problem. The firm determines the volume of output and inputs per period in order to maximise the present value of its future cash flows, subject to two constraints:
(i) the technological constraint, represented by the production function; and (ii) the capital accumulation constraint, shaped by the stock at the start of the period, the flow of new investment and depreciation as a result of use and/or technological obsolescence.
The shadow price or cost of one unit of capital service corresponds to the capital accumulation constraint and is determined by (Jorgenson, 1963; Hall and Jorgenson, 1967):

And the total cost,

Where pK is the current market price per unit of capital service, R is the nominal annual after-tax return per euro of financing in alternative investments with similar risk to that of the corporation, pK=ṗK , which is the annual rate of change in the price per unit of capital service. δ is the annual rate of depreciation of the stock of capital over a one-year period of usage, u is the rate of tax levied on corporate profits, and K is the stock of capital service units.
The term
pKK is the stock of capital services valued at current replacement prices, hence


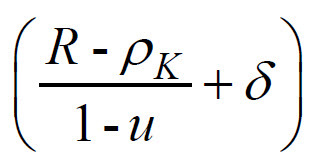
is the component of the cost per current euro invested in the stock of productive capital. It includes the financial cost component
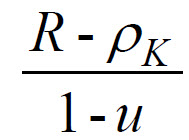

(the real pre-tax return expected by the providers of capital to cover the opportunity cost of not investing in other assets of similar riskiness) and the per unit loss of productive capital over a financial year,
δ.
Estimating user cost capital
Total user cost comprises a unit cost,
cpK, and a stock of units of capital services,
K. The source of the estimated stock of capital of Spain’s NFCs is Salas Fumás (2025b). The unit cost calculation is summarised in Exhibit 1.
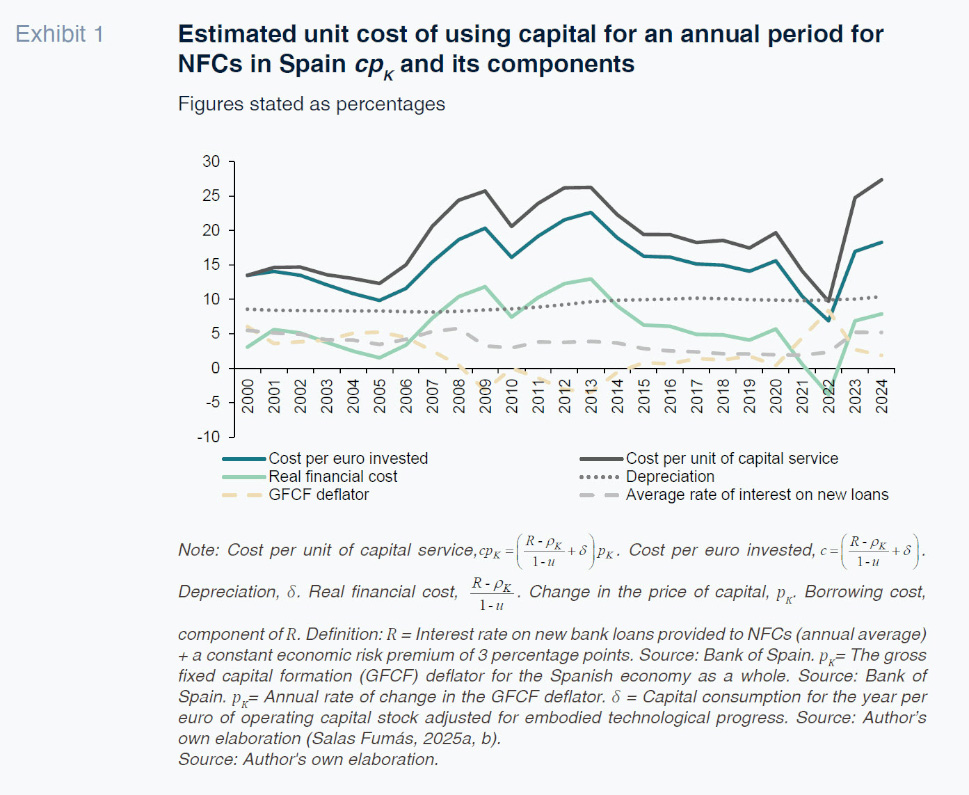
Average annual cost per unit of capital service, cpK, and per euro invested, c is 19% and 15%, respectively. This difference is explained by the trend in the market price per unit of capital service, pK, (trend in the GFCF deflator). The cost c = 15% is equal to 9%, capital depreciation (average), plus 6%, the real pre-tax financial cost (average).
User cost of capital exhibits considerable variability over time, ranging from 10% to 27%, due mainly to volatility in the price of capital assets. The pronounced drop in the user cost in 2021 and 2022, together with the swift increase in the following two years, is explained by inflation in asset prices during the bout of inflation (4.4% and 8.4%, respectively, compared with rates of growth of 1.79% in 2019 and 0.4% in 2020). Interest rates charged for bank loans varies over time in line with the ECB’s official interest rates, topping 5% in 2000, 2007-2008 and 2023-2024 and dipping below 2% in 2020 and 2021. The depreciation rate was around 8.5% until 2011, since when it has risen to a steady 10%, suggesting a shift in the composition of the corporations’ stock of assets to a shorter average useful productive life.
Geoeconomic and geopolitical turbulence in recent years likely raised risk premia, suggesting that the unusually low user cost of capital recorded in 2021 and 2022 may not fully reflect underlying financing conditions and would have been closer to the levels observed before and after that period.
NFC profit and loss statement
Exhibit 2 depicts the trend in the main items of the Spanish NFCs’ profit and loss statement between 2000 and 2024, using headings shown in the right-hand column of Table 1.
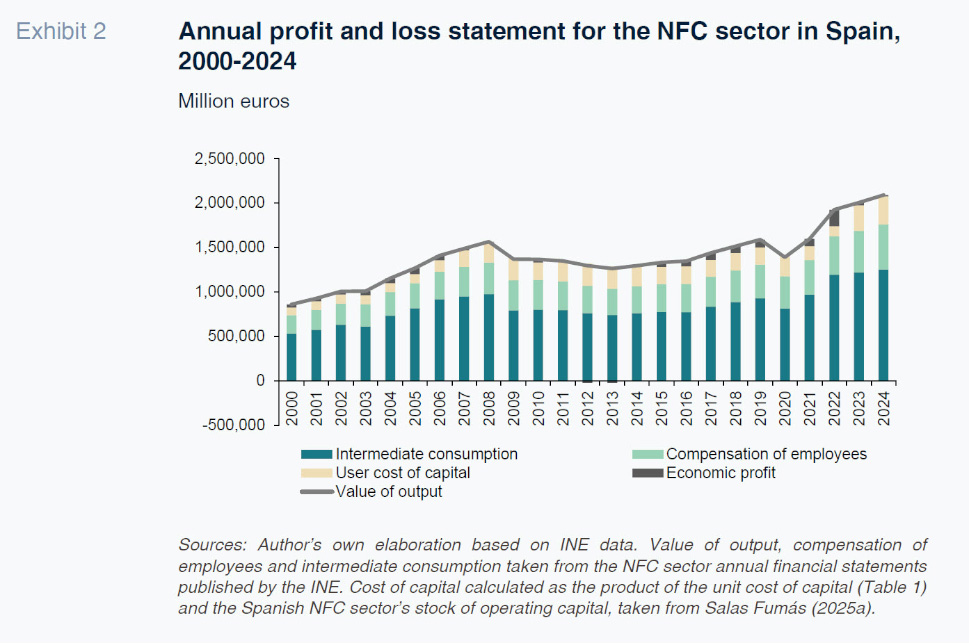
The value in current euros of the production of goods and services in Spain initially increased between 2000 and 2008, going on to contract until 2013, before embarking on a period of recovery interrupted by the economic fallout from the COVID-19 pandemic. The value of output in 2000, in current euros, was 0.86 trillion euros. In 2008, the end of the first growth cycle, the value of output, 1.57 trillion current euros, was nearly double that of 2000. In the five years between 2009 and 2013, gross output trended lower, ending that period at 1.26 trillion euros. From 2014, the value of output began to climb again and, having surmounted the adversity implied by the pandemic, amounted to more than 2 trillion current euros in 2024.
Until 2007, the cost of intermediate consumption grew faster than the value of output. The opposite was the case between 2008 and 2020, when intermediate consumption lost share in gross output, from 62% to 58%. Employee compensation, with the exception of 2020, has been relatively stable at around 24% of gross output. After 2020, intermediate consumption over gross output once again increased to 60%.
On average, throughout the entire period, the user cost of capital accounts for 13% of gross output, albeit varying considerably over time. In 2000, the user cost of capital totalled over 86 billion current euros, equivalent to 10% of the value of output, where it held steady until 2006. From 2007 on, the user cost of capital increased by proportionately more than gross output, peaking at 20% in 2013 (254.5 billion euros of imputed cost in absolute terms). Between 2014 and 2019, its share of gross output trended back down, to 12% in 2019. With the disruption caused during and after the pandemic, in 2024, the user cost of capital reached its highest level in absolute terms, at 317.3 billion current euros, 15% of the value of output that year.
Economic profits are modest in relative terms, albeit positive on average, at 3% of output or revenue. Expressed as margins, economic profits also vary over time: from a steady 4% – 5% until 2008, they headed towards or below zero between 2009 and 2013, recovering to pre-financial crisis levels between 2014 and 2019. During and right after the pandemic, economic profits were more erratic relative to revenue, marked by the episode of sharp inflation, and were close to zero in 2024.
The sum of the user cost of capital and economic profit yields the gross operating surplus, which is equivalent to accounting profit before depreciation charges. The gross accounting surplus averages 16% of output over the period analysed (14% until 2007 and 17% in 2008). The relative stability in accounting profit over output in the NFC sector masks uneven trends in its two components: the user or opportunity cost of capital and economic profit. This implies a loss of informational content compared to the insight gleaned by separating accounting profit into the user cost of capital and economic profit.
Breakdown of the profit and loss statement: "Buy” or "make”
The value of NFC output is made up of intermediate consumption and its complement, gross value added. The latter in turn includes employee compensation, the user cost of capital and economic profit (or loss). Intermediate consumption denotes the costs incurred by the NFCs to purchase the goods and services used in their production processes from the market (including imports from abroad). The value added —the difference between the value of the Spanish NFC sector’s output and the value of the resources purchased from the market— represents the increase in the value of the inputs purchased from outside the firm created by transforming them using labour services (direct and indirect) and capital services. Corporations decide whether to buy more and reduce the value added through internal production, or vice versa, produce more in-house and buy less from the market, implying a more, in the case of the former, or less vertically integrated NFC sector in Spain, in the case of the latter.
Exhibit 3 shows the share of intermediation consumption over the value of output over the period analysed and the composition of gross value added in terms of the relative shares of employee compensation, user cost of capital and economic profit. Between 2000 and 2006, intermediate consumption’s share of output increased from 62% to 65.4%. Therefore, during those years, the sector bought relatively more and made relatively less. From 2007 on, the share of intermediate consumption fell and that of value added increased: the NFCs bought fewer intermediate goods and services from outside and replaced them with internal production. As a result, the share of intermediate consumption decreased from 65.4% in 2006 to 59% in 2009. since when it has barely budged with the exception of the year of the pandemic when the share of intermediate consumption increased briefly.
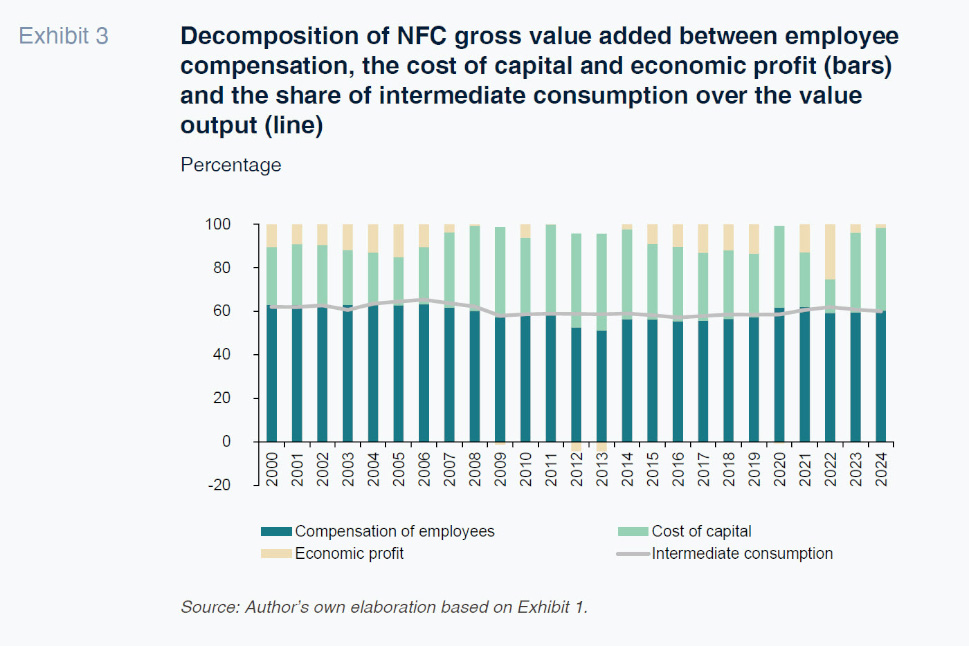
The shift towards making more and buying less coincided with a change in the composition of gross value added, marked by a higher weight of the cost of capital and lower weight of employee compensation, from 63% in 2000-2006 to 56% in 2013 and beyond. The share of employee compensation in gross output, however, has been remarkably steady at around 24%. The difference between the share of employee compensation in output relative to value added suggests a bias in the make-or-buy shift: the products and services made by the sector as a result of this shift are more capital intensive than those produced in the past.
[3]
The conclusion, necessarily tentative, of the findings this far can be summed up as follows: In 2006, the cost of capital increased on the back of the increase in the ECB’s interest rates in response to underlying inflationary pressure. Expectations shifted. The outlook was for slower growth in demand and production. In 2008, the international financial crisis not only weighed on growth but drove it into negative territory; demand, output and employment contracted, as did utilisation of the productive capacity accumulated during the prior period of growth. The deflation of the prices of capital goods during the debt crisis increased the opportunity cost of capital and some of the capital stock was withdrawn. However, in parallel, the Spanish NFCs attempted to increase utilisation of available productive capacity by replacing purchases with manufacturing and, within manufacturing, prioritising relatively capital-intensive goods and services.
Economic profits and investment
The theory
Corporations select their desired stock of productive capital at any point in time with a view to maximising their economic value (maximising the discounted present value of the cash flows generated by the sale of the goods and services they produce to the market). The optimal or desired stock depends on exogenous factors such as market conditions, technology and decision-maker information. Adjustment costs explain why the differences between the current and desired stock are not eliminated immediately but rather gradually via annual investment flows.
Theoretically, the speed of adjustment between the current and desired stock is determined as the equilibrium between minimising the adjustment costs and minimising the loss of opportunity attributable to a stock of capital other than the desired level. Investment theory (Tobin, 1969) establishes a positive linear correlation between the rate of investment and the ratio between the economic value of an additional unit of capital and its replacement cost (marginal q). Given that the marginal q is not observable, the empirical literature tends to use the average q as a working proxy (Hayashi, 1982). Since in our case we do not have either the marginal or the average q, the proxy used for the incentive to invest is the relationship between the rate of operating profit (return on operational assets) and user cost per unit of capital. When the return is higher than the cost, a firm is motivated to add capacity as this would add value, the more so the bigger the difference. To the contrary, if profitability is equal to or less than the cost, the decision consistent with the theory of investment would be to maintain capacity (when they are equal) or reduce it.
Profitability, user cost and investment rate for the NFC sector on aggregate between 2000 and 2004 are shown in Exhibit 4. The gross return on operating capital is defined as the ratio between the annual gross operating surplus and operating assets valued at current replacement prices at the end of the year. User cost of capital is the real opportunity cost per euro of capital at replacement prices, c (Exhibit 1). The net investment rate is equal to the difference between gross capital formation and capital consumption in current euros, divided by the stock of operating assets in current euros.
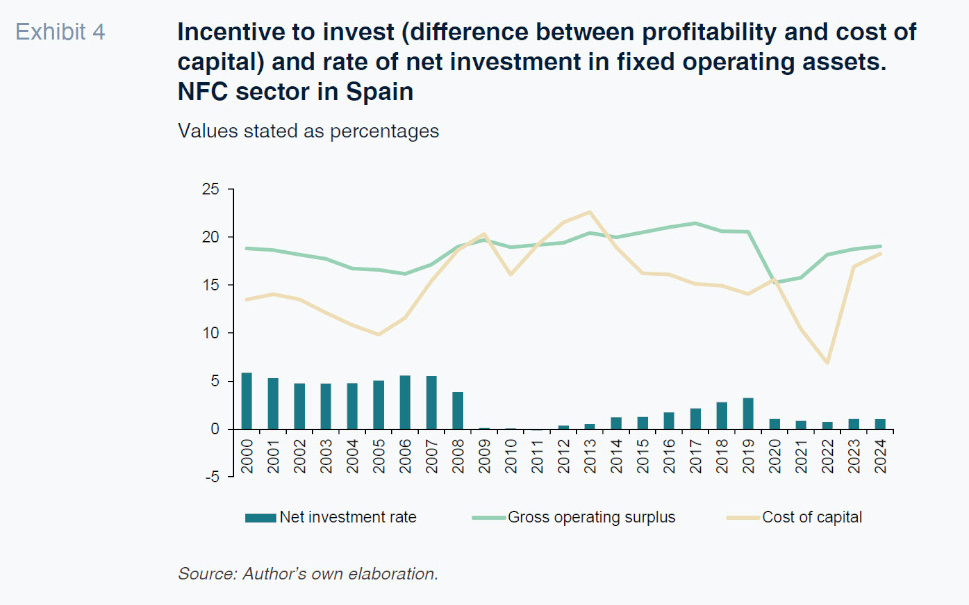
Between 2000 and 2007, the return on capital was well above the cost of capital and the net investment rate reached 5% per annum (close to the pace at which the stock of capital services increased). Between 2009 and 2013, the return on and cost of capital were virtually the same, the incentives to add capacity disappeared and the net investment rate was virtually zero. The incentive to increase productive capacity returned between 2014 and 2019, and the net investment rate trended upward over the years. The pandemic interrupted that growth, causing the net investment rate to decline. It has remained very low until the end of the period. This evidences the lag in the recovery in corporate investment in recent years relative to the rebound in growth and employment. The explanation for this lag according to Exhibit 4 is the lack of an incentive to invest: the return on capital remains below 2019 levels and the cost of capital has come under pressure via a risk premium altered by economic and political tensions.
Exhibit 4 evidences the limitations of using the return on capital calculated using accounting profit, instead of economic profit, as a measure for the incentive to invest. In the years prior to 2007, accounting profit trended lower while the net investment rate remained at a high; between 2009 and 2013, on the other hand, accounting profit increased while the net investment rate remained at close to zero. The incentives to invest that accompanied the growth in the rate of investment between 2014 and 2019 came from a drop in the user cost of capital, as profitability remained virtually flat. The lack of economic incentives, with profitability still below pre-pandemic levels and a volatile cost of capital could explain why corporate investment is lagging the recovery in growth and employment since the health crisis.
[4]
Investment theory assuming increasing adjustment costs implies the need for positive economic profits even in competitive markets as those profits are needed to offset the costs associated with the gradual adjustment of the stock of capital. The economic profit estimated in this paper does not explicitly factor in adjustment costs, thus the positive margins observed during the periods of positive net investment can be interpreted as necessary to offset those costs. In this sense, the average economic profit margin over gross output, of around 3% between 2000 and 2024, should not necessarily be interpreted as evidence of extraordinary windfalls or insufficient competition in the NFC sector as a whole in Spain, but rather as an indication of the economic costs associated with the accumulation of productive capital, when positive.
Conclusions and implications
This paper provides new information about the earnings performance of the NFCs that produce goods and services in Spain for sale in the market. The profit and loss statement drawn up aims to answer certain questions about the trend in economic profits in the NFC sector and find a plausible explanation for the trend in corporate investment. Economic profit calculations are not automatic, requiring the estimation of the user cost of capital, a variable of interest in its own right as a price estimate for an important production input. The profit and loss statement was elaborated in the paper starting from the value of output rather than value added, as is more common, allowing for an assessment of the effects of the corporations’ decisions to “buy” (more intermediate consumption) or “make” (more value added) through the composition of the value of output. Our analysis detects a shift, from 2009 on, towards make over buy, evidenced by an increase in the share of gross value added in NFC output in Spain from that year, presumably substituting national production for imports.
Evidence presented for 2000-2024 also reveals a trend in the net rate of investment in capital that is, in general terms, aligned with what the economic models explaining corporate investment would predict. Episodes of greater net investment coincide with periods in which the return on capital is clearly above the cost of using it, whereas the periods of stagnation or contraction in the stock of capital coincide with periods of slim or nil economic profit. The results suggest that the weakness in corporate investment since the global financial crisis —and more recently in the post-pandemic period— reflects relatively weak incentives to invest, once the user cost of capital and higher risk premia during periods of macroeconomic uncertainty, inflation, and financial volatility are taken into account. The decoupling between the recovery in output and employment and the trend in aggregate NFC investment in Spain in recent years is not necessarily due to the existence of widespread financial restrictions or anomalous corporate conduct but rather an adjustment in the desired stock of capital consistent with the prevailing economic incentives in terms of the trade-off between profitability and the cost of capital.
From a structural perspective, the paper signals that the existence of positive economic profits is compatible with competitive markets in the presence of relevant adjustment costs. The estimated average economic profit margin for the NFC sector on aggregate of 3% over a period of 25 years should not be interpreted as evidence of extraordinary profits or insufficient competition, but rather the buffer needed to offset the costs associated with the gradual adjustment of productive capacity.
The paper’s findings underline the importance of the user cost of capital as a key determinant of corporate investment. The policies that affect this cost, including monetary policy, how capital is taxed, depreciation schedules and investment incentives, may have a significant impact on the accumulation of capital, even in the absence of substantial changes in corporations’ accounting profitability.
Secondly, the analysis suggests that the traditional indicators based on accounting profits provide an incomplete signal of the incentives to invest. To study investment over cycles and diagnose its key drivers, it is important to complement these metrics with measures of economic profits that factor in the opportunity cost of capital.
Thirdly, the results highlight the role of macroeconomic uncertainty and risk premiums. Episodes of high inflation, financial volatility and geopolitical uncertainty can increase the cost of capital and weaken the incentive to invest, even when apparent profitability is high. In this context, all of the factors that contribute to macroeconomic stability (economic policy credibility, regulatory visibility, etc.) can have a two-fold influence on investment: by impacting both profitability and the cost of capital.
Lastly, the results urge caution when interpreting corporate profits from the standpoint of competition. On the one hand, the mark-up and accounting profit are not sufficient indicators of market power as they do not consider the user cost of capital. On the other hand, given adjustment costs, the existence of positive economic profit margins may indicate the need to finance the adjustment in productive capacity and not necessarily the existence of excessive market power.
The paper has limitations that should be taken into consideration in appraising specific findings. The aggregate data impede recognition of the heterogeneity of the business ecosystem. The cost of capital and economic profit estimations need being complemented by robust analysis of the underlying assumptions (for example, measurement of the risk premium, rate of capital depreciation, taxation, etc.). It would be preferable to expand the analysis to separate out the price and quantity effects in the composition of the profit and loss statement, which for this paper have been taken together.
Notes
Some are expressly mentioned in the reasons provided in justifying the creation of the Business Margins Observatory (OME for its acronym in Spanish) in 2022 https://www.observatoriomargenes.es/wme/es/
The contents of this paper are based on a more in-depth paper by the same author on business profits in Spain since joining the euro (Salas Fumás, 2025a).
The observed or estimated amounts of revenue and costs are the result of aggregating the individual production decisions of each corporation in order to maximise its economic profit. Albeit of great interest, this paper does not correlate the observed values with the exogenous technology, demand and market demand parameters that explain them as equilibrium values. Karabarbounis (2024) establishes this formal correlation to explain the trend in the compensation of employees in gross value added across developed economies.
If the analysis is widened to factor in gross investment as well as net investment, we see that in 2019, the gross investment rate was similar to that of 2007, whereas the net investment rate in 2019, of 3%, was below that of 2007, of 5%. The fact that the net investment rate was lower in 2019 than in 2007 while the gross investment rate was similar is explained by the difference in capital depreciation rates, which have trended higher throughout the period analysed. The higher depreciation rate suggests changes in the composition of the non-financial assets on the NFCs’ balance sheet, from a longer average useful life (slower depreciation) to a shorter one (faster depreciation).
References
HALL, R., and JORGENSON, D. (1967). Tax policy and investment behavior.
The American Economic Review, 57(3), 391-414.
https://www.jstor.org/stable/1812110HAYASHI, F. (1982). Tobin’s marginal q and average q: A Neoclassical Interpretation.
Econometrica, 50(1), 213–224.
JENSEN, M., and MECKLING, W. (1976). Theory of the firm: Managerial behavior, agency costs and ownership structure.
Journal of Financial Economics, 3(4), 305-360.
JORGENSON, D. (1963). Capital theory and investment behavior.
The American Economic Review, 53(2), 247-59.
https://www.aeaweb.org/aer/top20/53.2.247-259.pdfKARABARBOUNIS, L. (2024). Perspectives on the Labor Share.
Journal of Economic Perspectives, 38(2), 107–136.
https://www.aeaweb.org/articles?id=10.1257/jep.38.2.107SALAS FUMÁS, V. (2025a).
Veinticinco años de beneficios empresariales en España [Twenty-five years of business profits in Spain]. Investigaciones de Funcas, 20.
https://www.funcas.es/documentos_trabajo/veinticinco-anos-de-beneficios-empresariales-en-espana/SALAS FUMÁS, V. (2025b).
Activos y pasivos de las sociedades no financieras en España: 2000-2024. [Assets and liabilities of non-financial corporations in Spain: 2000-2024]. Investigaciones de Funcas, 6.
https://www.funcas.es/wp-content/uploads/2025/05/ACTIVOS-Y-PASIVOS-DE-LAS-SOCIEDADES-NOFINANCIERAS-EN-ESPANA-2000-2024.pdfTOBIN, J. (1969). A General Equilibrium Approach to Monetary Theory.
Journal of Money, Credit and Banking, 1(1), 15–29.
Vicente Salas Fumás. Professor Emeritus at the University of Zaragoza