
The macroeconomic drivers of fiscal sustainability
Spain’s debt ratio has fallen more than four percentage points since 2019, outperforming most euro area economies thanks to strong growth and favorable financing conditions. Yet demographic headwinds and persistent productivity gaps are emerging as key risks to maintaining long-term fiscal sustainability.
Abstract: Public debt ratios across advanced economies remain well above pre-pandemic levels, but Spain stands out as an exception within the euro area. After peaking at 120% of GDP in 2020, Spain’s debt ratio declined to 107.5% in 2024—almost five percentage points below the EU average and nearly ten points lower than in France or Italy. This improvement reflects a favorable interest rate-growth differential, strong labor market performance, and robust immigration inflows that expanded the tax base. Interest payments have fallen to just 2% of GDP, half their 1990s level, allowing debt reduction without major fiscal consolidation. Yet this benign dynamic is unlikely to persist. Demographic projections indicate that age-related spending will rise by over five percentage points of GDP by 2070, while potential growth remains constrained by low productivity and a maturing labor force. Ensuring fiscal sustainability will therefore require structural reforms to boost growth and preserve the credibility of Spain’s public finances in a less forgiving macroeconomic environment.
Introduction
In its latest World Economic Outlook, the International Monetary Fund (IMF) cautions about escalating fiscal pressures for advanced economies. Many of these governments find themselves with constrained fiscal space in an environment characterized by sluggish economic growth and elevated interest rates. Given substantial future spending requirements on age-related issues, defense, or climate change, ensuring the sustainability of debt is likely to necessitate modifications to current fiscal plans. This challenge is pertinent to most European economies, some of which are encountering difficulties in their budgetary processes and are increasingly experiencing market pressure on their government debt, as exemplified by France in 2025.
In this article, we examine the recent evolution of government debt among major European countries, with a particular emphasis on the Spanish economy. We analyze how macroeconomic developments influence the trajectory of public finances and consider potential scenarios for the years and decades ahead.
A long-term drift towards higher debt
Over the past several decades, many advanced economies, including European economies, have witnessed an increase in their government debt-to-GDP ratios. This phenomenon is prevalent, and while there are variations among countries, a combination of slower economic growth, escalating pressure from aging-related expenditures, and two significant crises are responsible for the apparent common trend observed across high-income nations.
Spain experienced a similar trajectory, although in recent years the evolution of debt has been more favorable compared to some of the other major EU countries. If we consider 2019 as the starting point for comparison and utilize the current projections by the IMF for the next five years, among the largest four EU countries, Spain is the only one where the government debt-to-GDP ratio in 2030 will be below that of 2019 by approximately 4.6 percentage points of GDP. Italy’s debt is projected to increase by 3.6%, while Germany and France’s debt is expected to rise by 15 and 30 percentage points relative to 2019. If we consider the end of 2020 as our starting point, the decline in debt in Spain would be even more substantial, approximately 26% of GDP.
[1]
What explains the difference in behavior across these economies? Can we learn something about future years or about best practices?
A comprehensive examination of the extended historical context reveals a more nuanced narrative. Exhibit 1 illustrates the trajectory of government debt for the four largest European Union nations from 1992 to 2025. In all instances, debt has experienced an upward trend, albeit with distinct narratives for each country. Germany’s debt increased marginally from 40% to 60% over the 33-year period, with a substantial portion of this rise occurring during the global financial crisis or the preceding years of reunification. Italy, similarly, affected by the 2008 crisis, exhibits a comparable pattern, albeit with a consistently higher debt level throughout the observed period.
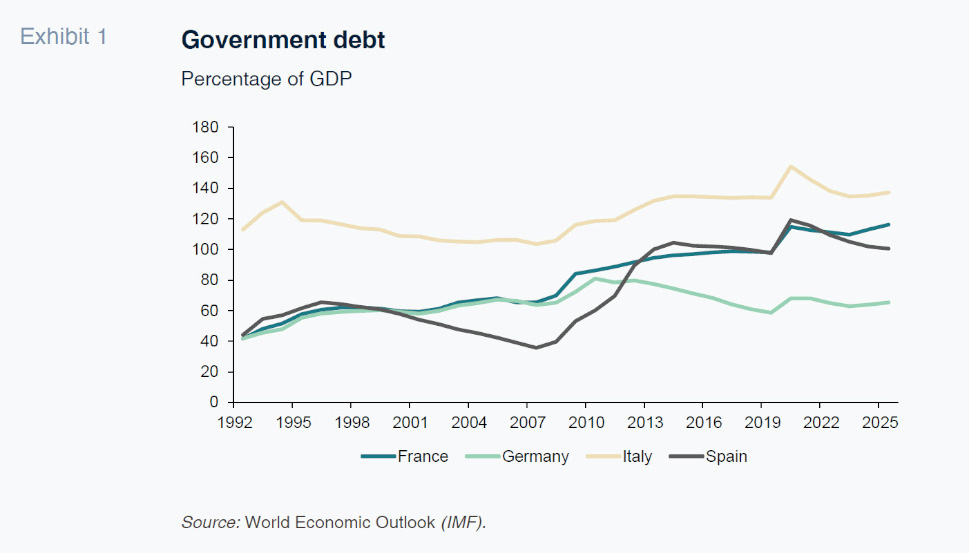
In contrast, France and Spain present a divergent story characterized by significantly larger increases, reaching approximately 60% and approaching 100%, respectively. However, these two nations exhibit notable disparities, particularly in relation to the global financial crisis. While France’s debt trajectory remains relatively stable over the period, Spanish debt experienced a substantial decline prior to 2007, followed by a sharp and rapid increase in the subsequent years. Since 2012, the evolution of these two countries has become more aligned, with the exception of the post-pandemic period.
The macroeconomic drivers of debt and its sustainability
The drivers of the evolution of the debt to GDP ratio (dt) can be expressed by the standard debt dynamics equation that includes as relevant factors the interest rate (it), GDP growth rate (gt) and the primary balance expressed as percentage of GDP (pbt)
Under the assumption of small interest rates and GDP growth rates, we can rewrite the increase in the debt to GDP ratio between any two years as
This expression has a straightforward interpretation: the first term represents the automatic change in debt linked to the relative difference of the two macroeconomic factors (interest rates and growth rates). The second term represents the accumulation of debt associated to current spending and taxes. From this expression we can easily calculate the primary balance that ensures that debt stays stable as the product of difference between interest rates and GDP growth rates and the ratio of debt to GDP.
The pattern of Exhibit 1 of increasing debt means that fiscal discipline was not enough to stabilize government debt as a percentage of GDP. For some countries primary balances were most times below the level required to stabilize debt, and they display a continuous drift towards higher debt. For others, it was during periods of economic crisis that large deficits pushed towards increases in debt.
In this article we want to focus on the role that the macroeconomic factors (it and gt) played in explaining the debt dynamics, with a focus on Spanish economy. Periods where interest rates are low or GDP growth rates are high will create dynamics of decreasing debt even in the absence of fiscal discipline. These two variables play a large role explaining the dynamics of Exhibit 1. And, more importantly, they are crucial in understanding the potential scenarios in the years ahead.
In the realm of interest rates, the narrative remains consistent across all four countries, albeit the global financial crisis exerted some temporary additional pressure on Italy and Spain. These are decades characterized by a global decline in real interest rates. This phenomenon was compounded by decreases in inflation during the preceding years, particularly for Spain and Italy, resulting in a substantial reduction in nominal interest rates. A straightforward illustration of the significance of this decline is the reduction in the burden of debt (measured as interest payments as a percentage of GDP, Exhibit 2). This figure demonstrates a downward trend even in the presence of increasing debt levels. For instance, in the case of Spain, interest payments as a percentage of GDP decreased from approximately 4% to levels around or below 2% for a significant portion of these years. France has also witnessed a decrease in interest payments, despite an increase in debt. Italy, however, stands out as an exception. as debt remained relatively stable and benefitted from a very large decrease in interest rates.
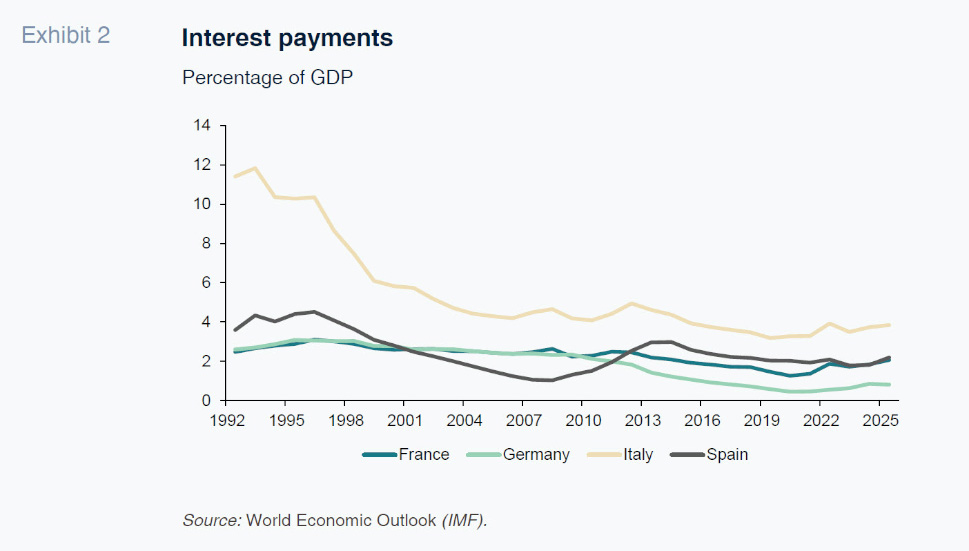
This trend has stopped or has been reversed in recent years as interest rates have increased, and debt levels remain elevated. Of course, interest rates are still far from the levels of previous decades, and interest payments remain low by historical standards.
But what really matters for debt dynamics is the difference between nominal interest rates and GDP growth rates. For example, during the early years in this sample, decreases in inflation helped reduce nominal interest rates but this also reduced nominal GDP growth rates, having a minimal effect on debt sustainability calculations. To see the interaction of these two factors, we calculate their difference in Exhibit 3. [2]
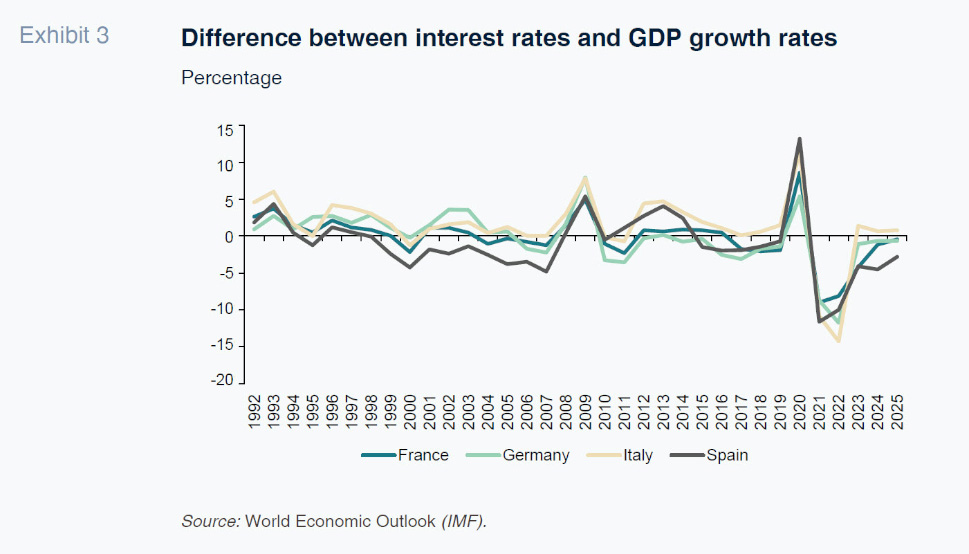
This exhibit presents a compelling narrative illustrating the profound impact of macroeconomic conditions on the evolution of debt. The 2000s witnessed a decade characterized by a relatively low or negative difference between these two variables, primarily due to rapid growth rates and a declining interest rate environment. This phenomenon holds particular relevance for Spain. While other nations also experienced declines in this difference, the magnitude of these declines was significantly smaller. For approximately a decade, Spain maintained a substantial negative differential between the two variables.
The global financial crisis marked a significant departure from this trend. The initial deceleration in growth rates, coupled with the subsequent surge in interest rates stemming from the sovereign debt crisis, resulted in an episode of a notably high disparity between interest rates and growth rates. In Spain’s case, this substantial swing from negative to positive aligns with the corresponding fluctuations in debt-to-GDP ratios, which had been declining until 2007 before experiencing a more rapid increase post-2008 compared to any other nation. [3]
The COVID-19 cycle presents a strikingly similar narrative. The initial surge in the numbers attributable to the GDP collapse in 2020 is followed by an episode of a highly negative disparity between interest rates and growth rates, primarily driven by elevated inflation that was not offset by corresponding increases in nominal interest rates. This situation facilitated debt reduction efforts among European countries during those two years. The subsequent period from 2023-2025 witnessed a return of this difference towards zero or positive territory for Italy, France, and Germany. In Spain’s case, the difference remains negative, bolstered by substantially higher real growth rates compared to the other three economies. [4]
From population to employment to GDP
Based on our previous analysis, the positive evolution of GDP during certain years was instrumental in the reduction of the debt-to-GDP ratio of the Spanish economy, distinguishing it as an outlier compared to the other three EU countries. Given that interest rates are likely to remain similar across all euro economies in the future, going forward GDP growth rates will be the primary determinant of the pressure on debt and primary balances. Consequently, estimating potential output growth is crucial in the analysis of debt sustainability.
Potential output growth is influenced by a combination of extensive growth (employment and capital) and productivity increases. In the case of Spain, real GDP growth changes over the previous decades were highly correlated with employment growth. The years when Spanish GDP outperformed that of the other EU countries coincided with years of rapid employment growth, while productivity remained closer to that of the other countries or below.
Increases in employment were largely driven by increases in population, which were fostered by significant fluctuations in migration flows. The two periods where Spanish GDP growth overperformed and, as a result, the debt-to-GDP ratio behaved better, coincided with periods of rapid population growth. The pre-2007 period and the most recent years are periods where population growth in Spain outpaced that of the other countries (Exhibit 4). Conversely, the period during which debt exploded coincided with the years with the weakest population growth.
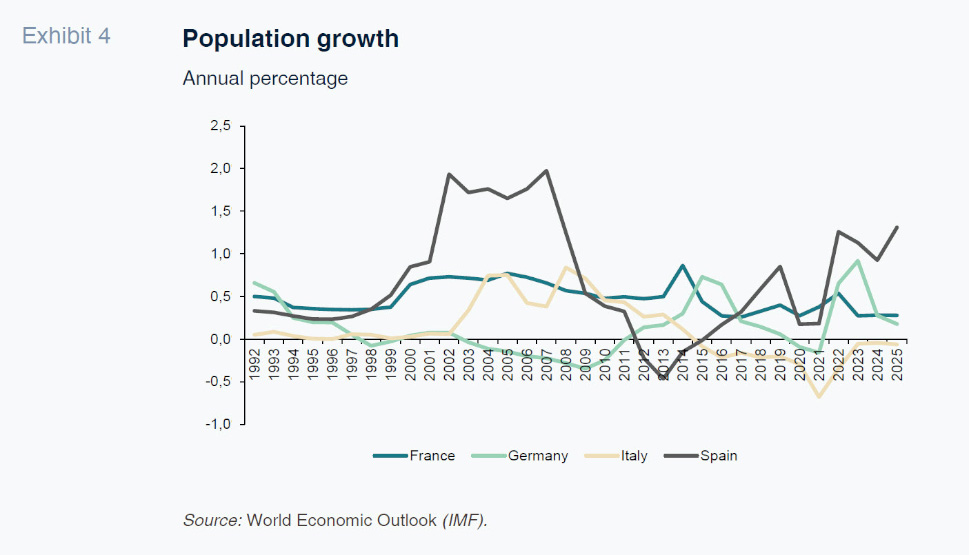
To be clear, causality runs in both directions, with migration shaping economic conditions and migration also responding to economic conditions. But the point is that it is crucial to recognize the influence of population growth on GDP growth rates and, consequently, on the dynamics of the debt-to-GDP ratio in Spain over the past decades.
Looking ahead
We start with a quick debt sustainability exercise for Spain for the coming five years. The IMF projects an average interest rate on Spanish debt of approximately 2.5% over that period (IMF, 2025). Currently, Spain’s primary balance stands at approximately -0.5% of GDP, which aligns with the estimated structural primary balance by the European Commission (European Commission, 2025). To sustain the debt-to-GDP ratio, and assuming a 2% inflation rate, real growth would necessitate a 1% increase. This figure is significantly lower than what was observed in recent years. Consequently, forecasts indicate a further decline in the debt-to-GDP ratio over the next five years. This positions Spain in a more favorable position compared to other countries, particularly France, which exhibits a substantially larger deficit and a slower growth rate.
Nevertheless, as acknowledged by the debt sustainability analysis conducted by the European Commission, the years following 2030 may present more formidable challenges. Two key factors will exert pressure on government finances. Firstly, potential GDP is anticipated to decelerate. This is attributed to two phenomena. First, the aging population, which is likely to result in a decline in the working-age population as a percentage of the total population. In addition, migration is expected to stabilize at levels significantly lower than those observed in recent years.
To gain insight into how migration has surpassed previous forecasts, we examine data from five years ago. In 2020, projections by the National Statistics Institute and the Independent Authority for Fiscal Responsibility (AIReF) for the five years ahead, until 2025, indicated an annual migration flow of approximately 200,000. However, the actual flow exceeded expectations by a factor of up to three, resulting in a significant boost to employment and GDP.
Currently, projections by the same Spanish authorities and the European Commission suggest a return of migration flows to 200,000 per year. These projections, combined with the low productivity performance in Europe (including Spain), lead to estimates of potential output approaching 1% by the 2030s.
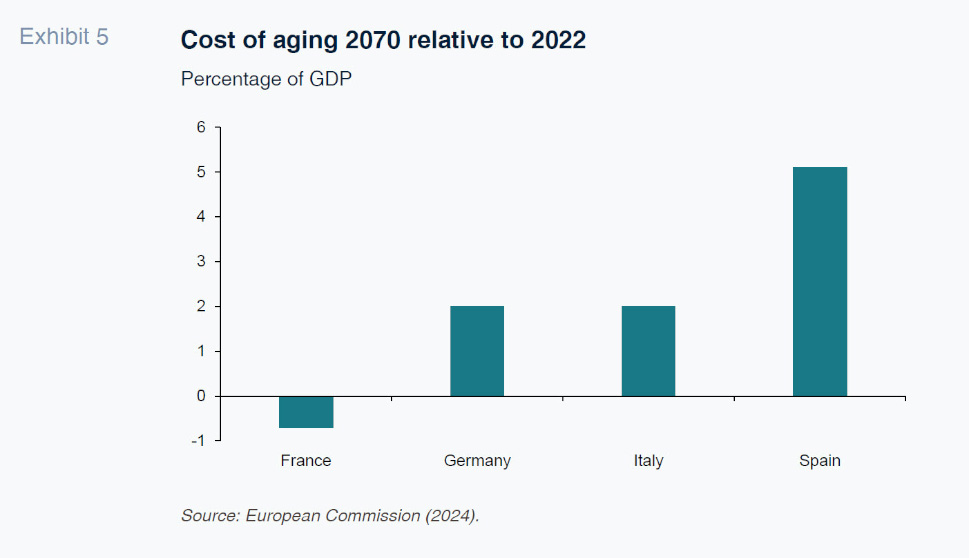
The second challenge arises from the costs associated with aging. This issue affects all EU countries, but the magnitude varies across them. In Spain, the European Commission estimates the cost of aging to be approximately 5 percentage points by 2070, relative to a baseline year of 2022 (European Commission, 2024). This figure is substantial, and significantly higher than in the other three countries, which poses a challenge to the sustainability of current budgetary plans. Relative to the other three European countries, Spain appears to be the country with the most pressing need for adjustments.
Conclusion
Over the past several decades, governments in most advanced economies have experienced significant increases in their debt levels. These increases underscore the challenges faced by governments in maintaining primary balances that align with a stable debt-to-GDP ratio. While in certain countries, such as France, the debt trajectory remains relatively consistent over time, in Spain, the evolution of the debt-to-GDP ratio is significantly influenced by macroeconomic factors. Fluctuations in interest rates and GDP growth rates are closely correlated with variations in the value of this ratio. Notably, Spanish government debt has decreased as a percentage of GDP during periods of robust GDP growth and relatively low interest rates.
Although the projection for the next five years indicates further declines in the debt to GDP ratio under the assumption of sustained growth, the situation is likely to become significantly more challenging after 2030. Potential growth rates are anticipated to decline due to a combination of limited productivity growth, reduced migration flows, and an aging labor force. This, coupled with a substantial burden on the government budget stemming from an aging population, places the trajectory of Spanish government debt in an unsustainable position, necessitating a substantial adjustment (European Commission, 2025).
Notes
Germany and France will still see increases of 7% and 13% while Italy will see a decrease of 16%.
Nominal interest rates calculated as the ratio of interest payments to debt to GDP using data from the World Economic Outlook (IMF). Nominal GDP growth rates calculated as the sum of real GDP growth and CPI inflation (also from IMF World Economic Outlook).
The effects of a large positive difference between interest rates and growth rates extend beyond the direct and mechanical effects. When growth is weak, governments run primary deficits that put even more pressure on sustainability.
Once again, it is crucial to comprehend that these elevated growth rates not only contribute to sustainability mechanically through the debt sustainability equation but also by fostering discipline in primary balances.
References
EUROPEAN COMMISSION. (2024). Aging Report, 2024. Institutional Paper, 279, April 2024.
EUROPEAN COMMISSION. (2025). Debt Sustainability Monitor, 2024. Institutional Paper, 306, March 2025.
IMF. (2025). World Economic Outlook, October 2025. Washington D. C.: International Monetary Fund.
Antonio Fatas. INSEAD and CEPR