
Scaling up: Lessons from Spain’s fastest-growing medium-sized firms
Medium-sized enterprises hold a distinctive position in Spain′s corporate landscape, combining sufficient scale to shape economic activity with the flexibility to keep adapting and growing. Among Spain′s medium-sized enterprises, the 100 firms with the strongest cumulative growth since 2008 combined rising productivity, sustained investment and lower debt levels, allowing them to grow sustainably without compromising their financial resilience.
Abstract: Medium-sized enterprises occupy a distinctive position in Spain′s corporate landscape, combining sufficient scale to shape economic activity with the flexibility to keep adapting and growing. Among this group, a subset of 100 firms that already qualified as medium-sized in 2008 went on to record the highest cumulative growth rates in the sample through 2024. These firms expanded without diluting their productivity: their revenue per employee grew at an annual rate of 10.7% between 2019 and 2024, roughly twice the pace of the broader sample since 2008. Investment kept pace with that growth, and their return on assets reached 8.5% in 2024, the highest level in the series. Labour costs per employee rose too, but more slowly than revenue, showing that their competitiveness has not come from holding down wages. They also grew without leaning more heavily on debt, financing their expansion mainly through funds generated internally. These patterns point to investment, productivity and financial prudence as the traits that distinguish firms capable of sustained growth from those whose expansion proves temporary.
Medium-sized enterprises in Spain’s corporate sectorThe headline figures characterising Spain’s business ecosystem often lead to misleading conclusions. One of the most common is that “there is a dearth of medium-sized enterprises in Spain”. While their share in percentage terms may seem negligible —they account for less than 1% of the business population— the picture changes when viewed through the lens of their economic contribution. The reality is that Spain is home to almost 12,000 companies,
[1] which, out of a census of approximately 3.3 million enterprises, recorded around 312 billion euros of revenue in 2024 (which is equivalent to nearly 20% of Spanish GDP) and employed 1.3 million people (7% of wage-earners in Spain).
Far from constituting a marginal segment, these mid-sized businesses are key economic players with a significant ability to generate income, jobs and investment. Moreover, their footprint is not limited to the major metropolitan areas but extends nationwide, acting as an economic catalyst in regions with very diverse productive structures.
As an intermediate link between the dominant presence of micro and small businesses and large enterprises, whose business model —generally more global and complex— cannot always be directly extrapolated, medium-sized enterprises represent a particularly interesting benchmark for a significant part of the Spanish business landscape. Indeed, medium-sized enterprises combine sufficient scale to have a significant impact on economic activity with a high degree of organisational and strategic flexibility.
Another key takeaway from our analysis of the factors that shape their development is that this cohort is an exponent of business consolidation. In most cases, reaching this threshold entails evolving from the smaller size categories and overcoming the most vulnerable stages of the business life cycle. This aspect is particularly relevant in Spain, where high business turnover is a key determinant of the country’s capacity for growth, with annual business start-up and closure rates of around 10% and approximately half of all newly incorporated companies not surviving beyond five years.
Logically, not all medium-sized enterprises have followed the same growth path. The sample includes companies that, having reached the size threshold, have remained relatively stable, alongside others that have continued to grow consistently, further increasing their scale, productivity and ability to generate value.
This heterogeneity is not surprising. The OECD (2021) notes that a very significant share of companies (nearly half of the total in both the U.S. and Europe) do not have explicit growth ambitions. That does not necessarily imply reduced competitiveness, productivity or efficiency. What it does underline is that policies and strategies that target business performance should not necessarily hitch themselves exclusively to growth in size.
[2]There is, however, another group of companies whose strategy does involve consistently increasing in size. In these instances, the challenge is not only to grow but to do so sustainably and accompanied by more productivity, profitability and investment. It is precisely these companies that the OECD has coined as ‘scalers’: businesses able to grow on a sustained basis over prolonged periods of time, which, thanks to their ability to generate jobs, fuel productivity and catalyse the business ecosystem, play a particularly important role in economic growth.
Beyond their direct contribution, the OECD highlights these firms’ exemplary value by serving as role models for the purposes of identifying practices and strategies conducive to being replicated by other companies with growth ambitions.
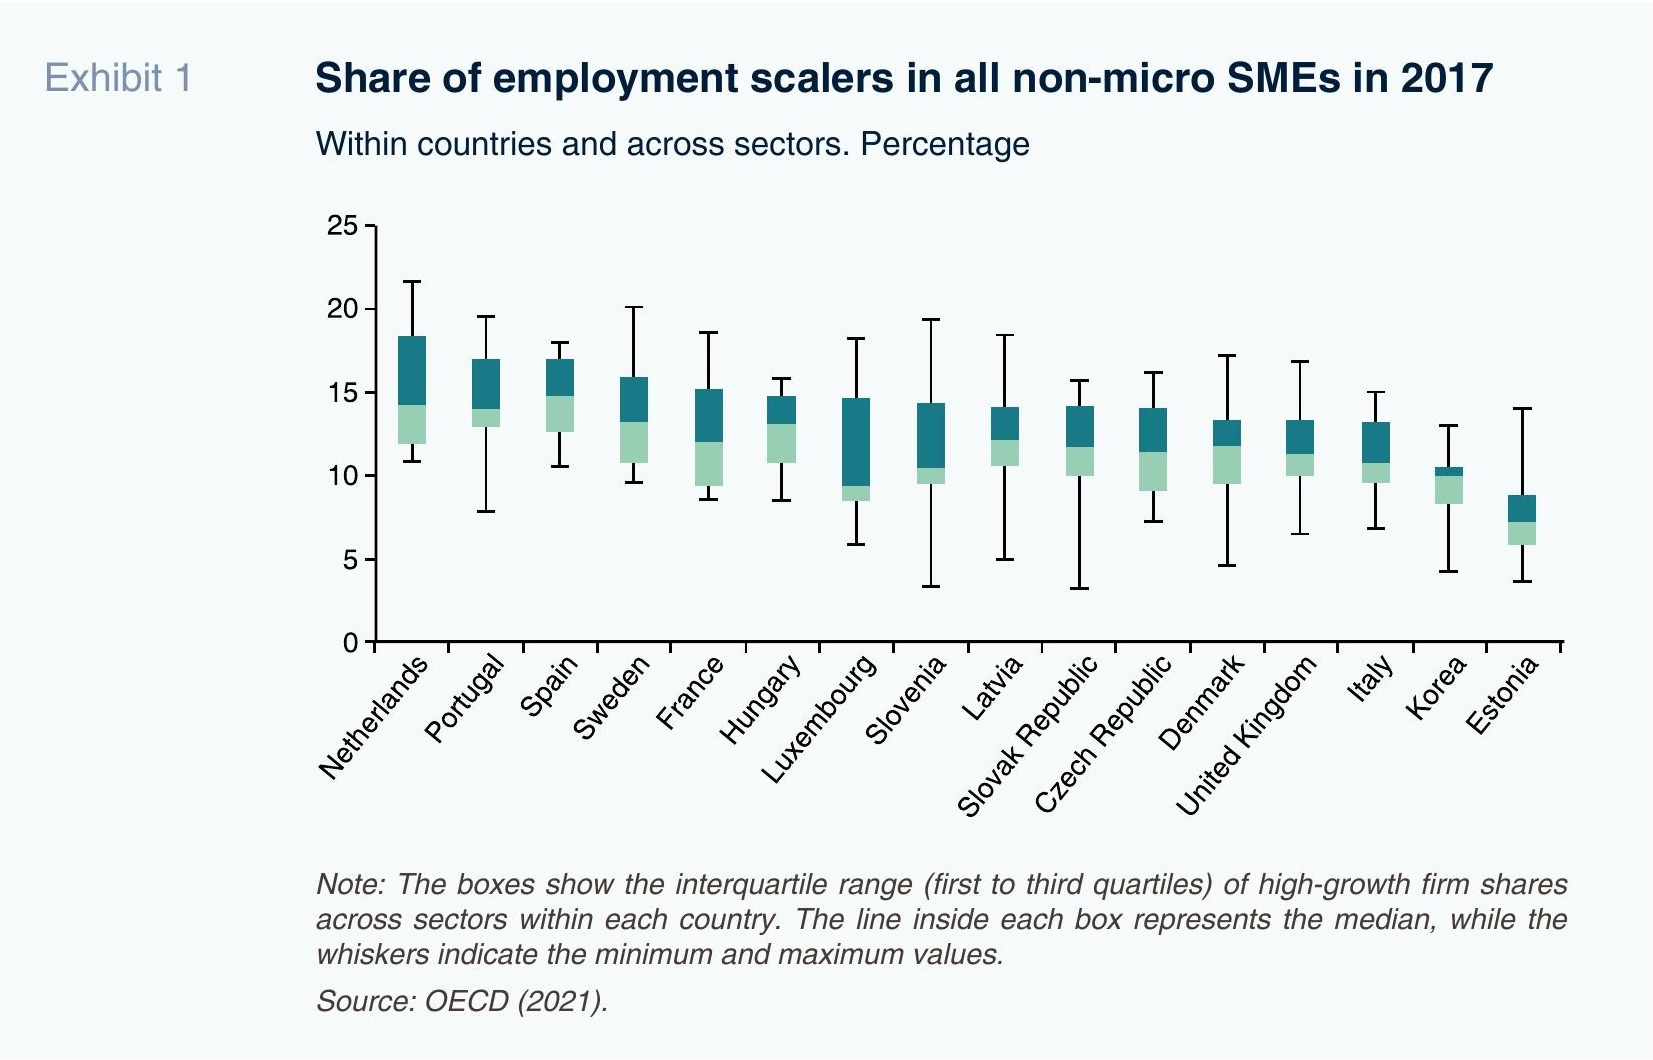
Spain has one of the highest shares of scalers in the OECD. As we will analyse next, the term “scaler” should not be misconstrued by limiting it to small businesses. The mid-size segment also includes businesses that are capable of exceptional growth during long periods of time.
Identifying the growth leaders
A start-up has an easier time scaling up because it starts from a small base. For start-ups, the challenge is to adapt to their new scale and stabilise financially. The situation is different for companies that, having already achieved a relevant scale, manage to deliver significantly above-average growth rates for prolonged periods of time. Sustained growth at these companies can hardly be attributed, at least not exclusively, to circumstantial factors or favourable economic tailwinds but reflects consistent strategic decisions, an appropriate business model and an ability to continually adapt.
With the aim of identifying the aspects that determine growth in this second category of companies, this section analyses a sample of firms that qualified as medium-sized in 2008, either in terms of employment (between 50 and 250 employees) or turnover (between 10 and 50 million euros), selecting those that registered the highest cumulative annual rates of growth between 2008 and 2024. From the overall sample, we selected the 100 growth leaders with a view to analysing the hallmarks of the companies which, starting from an established position, managed to sustain growth over a period of 16 years.
The analysis draws from the SABI database, which compiles information on all of the firms that deposit their financial statements with the Companies Register. The sample excludes listed companies, public organisations, state-owned companies and financial institutions. We only analysed companies with full financial information for the entire period analysed, prioritising the use of consolidated financial statements and, when the latter were not available, separate financial disclosures.
Snapshot of the top 100 medium-sized scalers
Although the top 100 growth leaders were selected on the basis of their performance over a broad time horizon, the analysis outlined next focuses on a shorter period, between 2019 and 2024, with the aim of capturing these companies’ most recent track record in order to best depict their current performance and situation. Our interest lies in understanding the nature of these companies’ outperformance and the underlying drivers.
The first distinguishing feature of the companies analysed is that their expansion does not start from a small base. They were all already medium-sized companies at the start of the period, which implies that they had moved beyond the initial stages of consolidation and were operating with well-developed business structures. Nevertheless, they virtually doubled their revenues on aggregate between 2019 and 2024, from 7.17 billion euros to 14.08 billion euros. That translates into average annual growth of 17.5%, a figure that remains very high even if the time horizon is extended back to 2008 (annual growth of 16.9%). These figures demonstrate that we are not looking at growth associated with economic tailwinds but rather a sustained growth trajectory.
That revenue momentum has been accompanied by a noteworthy ability to create jobs. Between 2019 and 2024, these companies’ aggregate headcount increased from 53,225 to 75,692, implying the creation of over 22,000 jobs in just five years. This tells us that these businesses’ growth has not been driven exclusively by efficiency gains or M&A activity but also capacity expansion.
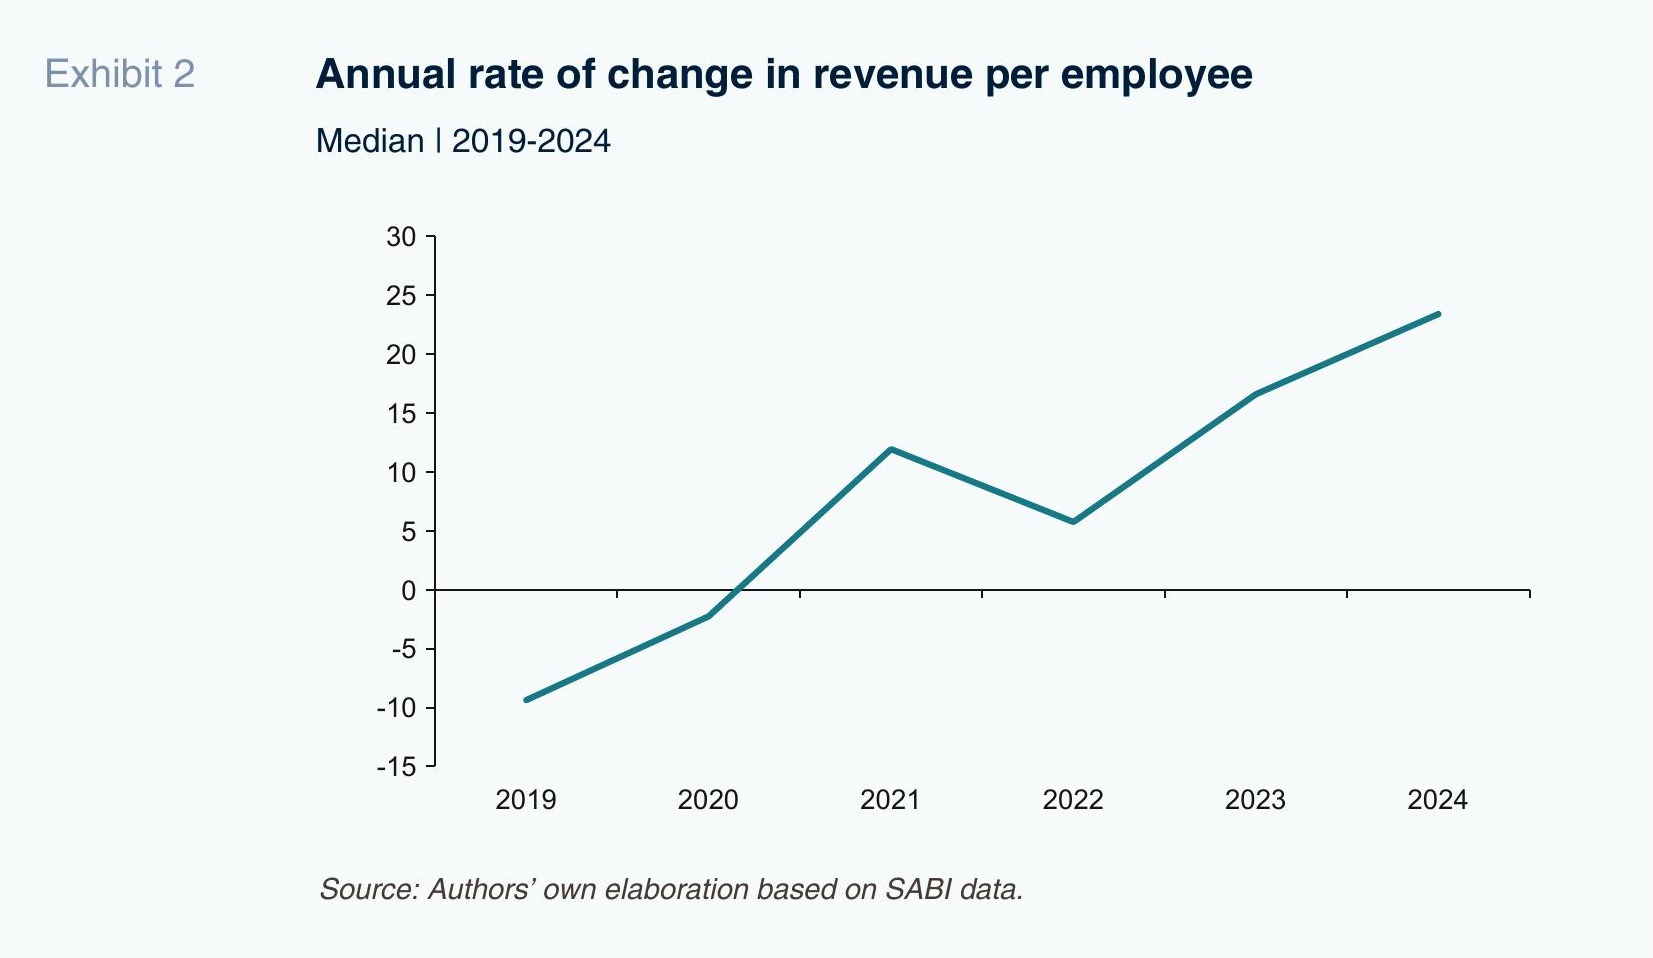
However, the feature that best defines these companies’ performance is the quality of the growth generated and not simply its intensity. The growth in volumes and employment has been accompanied by a very significant increase in productivity. Using revenue per employee as our proxy, the median value for this group of 100 leaders increased from 152,000 euros per employee in 2019 to 252,000 euros in 2024, annual growth of 10.7%. That pace of growth is virtually twice that observed in the entire period (2008-2024: 5.9%). Moreover, it has intensified consistently, marking the highest reading in the series in 2024.
In addition, the observed productivity gains proved consistent with a positive trend in labour costs per employee. During the period analysed, staff costs per employee increased by approximately 3% per annum, from 37,000 to 43,000 euros. However, the share of staff costs over revenue decreased from 24.7% to 18.7% over the same timeframe, as the companies’ topline growth far outstripped the growth in their labour costs. In other words, for every euro earmarked to remunerating their employees, the 100 top-performing medium-sized scalers are currently generating almost 30% more revenue than five years ago. This pattern shows that their competitiveness does not stem from a strategy of labour cost contention but rather an enhanced ability to generate added value.
It is essential to note that the productivity gains are not a transient phenomenon but rather the result of sustained investment. On aggregate, these firms’ investing activity increased by around 60% between 2019 and 2024, depicting an ongoing effort to add capacity, modernise and develop their businesses. Although investment intensity measured as a percentage of revenue declined over the period, it is not attributable to a drop-off in investment but rather the extraordinary and even higher growth in the denominator. As a result, the reduction in the ratio of investment over revenue reflects these companies’ ability to transform that capital expenditure into revenue growth.
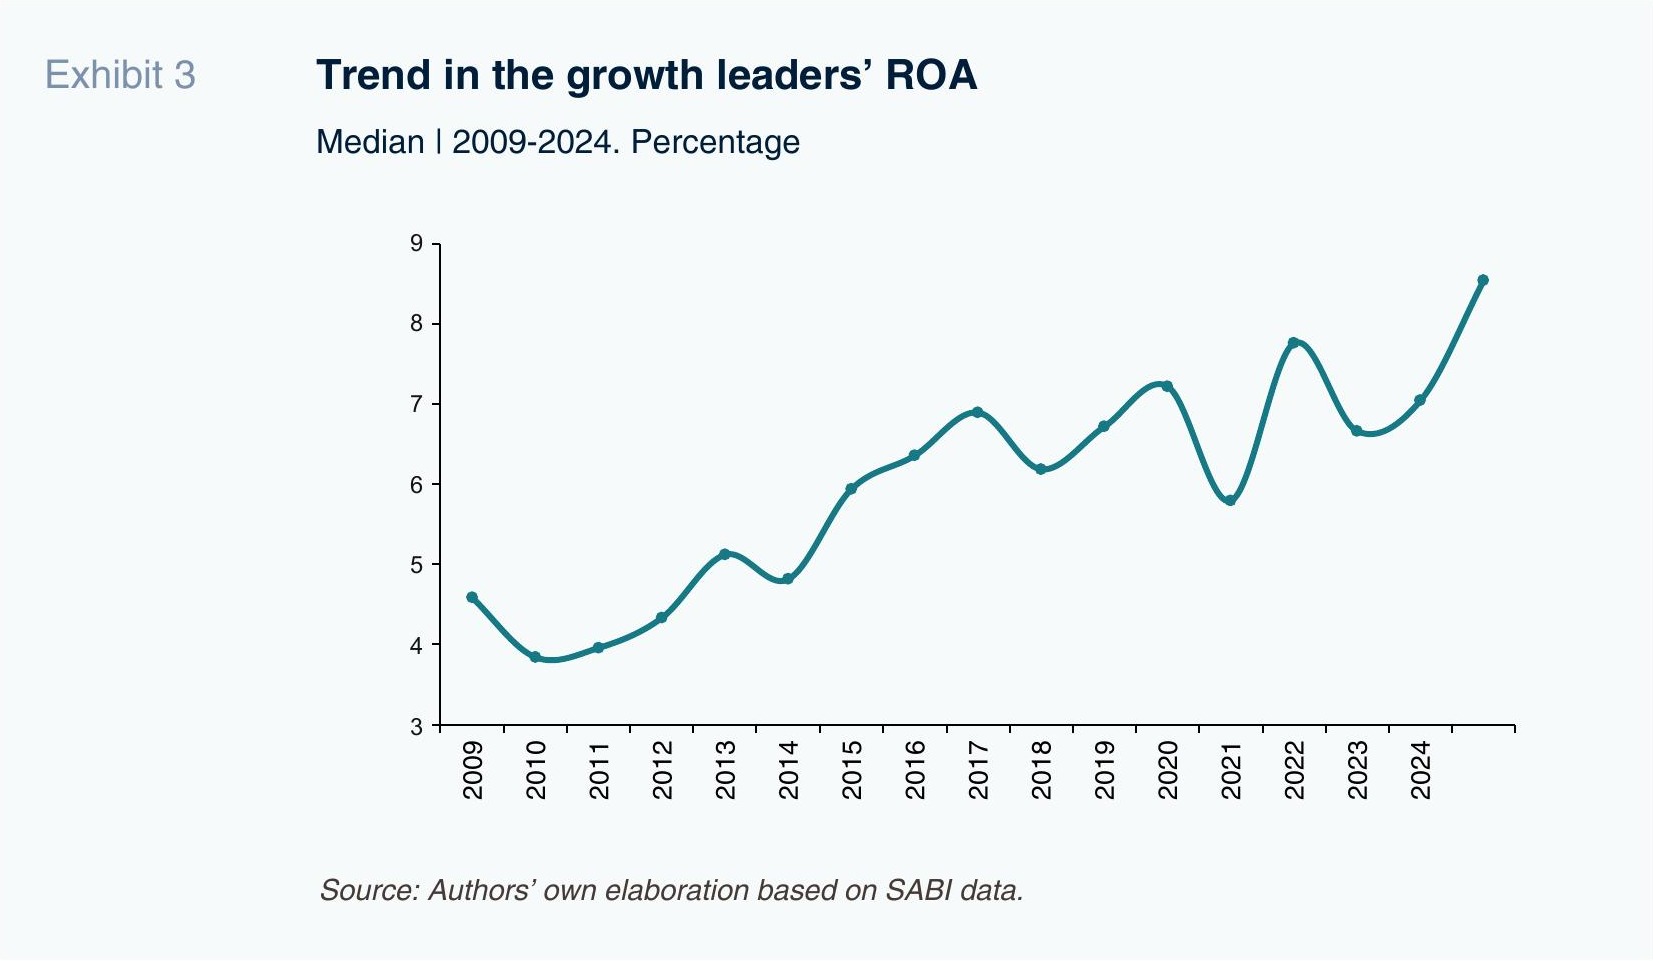
The trend in profitability reinforces this interpretation. Their return on assets (ROA) marked the highest reading in the series in 2024 at 8.5%, up 18% from the 2019 equivalent. What this indicates is that the increase in investment, in addition to unlocking sustained revenue growth, helped deliver more efficient use of the firms’ assets and honed their ability to generate profits.
These findings are consistent with the international evidence, which identifies a close correlation between productivity and business growth. A number of studies show that the companies that go on to enjoy periods of sharp growth tend to present higher initial levels of productivity, profitability and investment intensity. In addition, the companies that post higher productivity gains enjoy a higher probability of becoming high-revenue-growth firms (Moschella et al., 2019; Coad, 2010; Arrighetti and Lasagni, 2013; Du and Temouri, 2015). The metrics for the subset of companies analysed here endorse that correlation: their growth has not been limited to more revenue and employment but has been accompanied by a sustained improvement in revenue per employee, investment and profitability.
Another significant finding is that the growth experienced by the companies in our sample was not accompanied by a significant increase in indebtedness. To the contrary, their borrowings accounted for just 8.2% of total assets in 2024 and came down consistently throughout the period analysed. This deleveraging points to prudent financial management whereby business expansion is funded primarily by funds generated internally, underpinned by a capital structure that is solid enough to finance their growth without significantly increasing their exposure to financial risk.
Note, lastly, that these companies’ growth is not concentrated in a single region or specific sector of the economy. The 100 medium-sized growth leaders are highly diversified geographically and sector-wise, with our sample including companies from 13 Spanish regions and the five major sectors of economic activity. This diversity confirms that standout growth can be achieved in very different business environments and is not limited to a single area of specialisation.
Nevertheless, the analysis does reveal a predominance of services sector activities. Specifically, 74 of the 100 top performers belong to the services and wholesale-retail sectors. The most populated subsector is the wholesale trade (16 companies), followed by technological activities and information technologies (9 companies). The growing relevance of the latter highlights the increasingly important role played by knowledge-intensive activities as an engine of business growth.
What drives sustained growth among these leading companies?
The analysis of the drivers underlying the performance of the subset of growth leaders yields a number of conclusions, which serve as a final summary. Aligned with the OECD’s focus on scalers, the analysis allows us to identify business management strategies with the potential for replication. The idea is not to present a single model for success but rather to signal some of the traits shared by this group of medium-sized enterprises which have managed to stay on a growth trajectory for a prolonged period of time.
Firstly, their growth should be assessed on its quality and not only on its intensity. Revenue growth is just one dimension of business performance. The evidence gathered shows that the real success comes when topline growth is accompanied by job creation, productivity gains and higher profitability. When this happens, the growth takes on a qualitative character, translating into more value generation and not only revenue growth.
Productivity is not an automatic consequence of growth. More scale does not in itself guarantee efficiency gains. The companies analysed demonstrate that intense job creation can be compatible with very significant growth in revenue per employee, indicating that their growth has been accompanied by organisational, technological or business improvements. Although the evidence is not conducive to drawing conclusions as to cause and effect, it does show that growth and productivity can go hand in hand when business scaling is underpinned by investment and internal business model transformation.
Their commitment to investing is another key takeaway. The performance of the 100 growth leaders reveals that the growth observed was accompanied and enabled by an ongoing investment effort. The addition of more capacity, incorporation of technology and development of new markets appear to form part of the business scaling process. The overlap between higher investment volumes and profitability gains suggests that capital expenditure helps generate more value, in addition to unlocking scale.
Access to finance is also relevant for business growth. However, the analysis indicates that the businesses’ financial structure needs to facilitate rather than dictate the growth strategy. The leading firms’ financial management is characterised by lower leverage and healthy cash flow generation. Their financial caution would not appear to have constrained their growth; to the contrary, it seems to have given them the room to invest continually and navigate a particularly challenging economic environment in the wake of the pandemic-induced recession of 2020. This highlights the fact that debt is a tool at the service of business strategy, which companies must be able to tap but must under no circumstances use as a permanent substitute for the business’s intrinsic ability to generate recurring funds.
Lastly, the highly diverse regional and sector mix presented by the top-performing scalers tells us there is more than one growth model. The success stories observed abound in both traditional activities and knowledge-intensive sectors and are well distributed around most of Spain. More than the business carried out or the geographic location of the firms, the analysis suggests that the common denominators lie with the ability to invest on an ongoing basis, unlock productivity gains and manage their finances so as to accompany their growth without compromising their financial equilibrium.
Notes
The European Union defines medium-sized enterprises as firms with fewer than 250 employees, annual turnover of less than 50 million euros and under 43 million euros of assets.
Radiografía del tejido empresarial español: en busca del crecimiento, a report published by Afi in 2025 whose title translates as Snapshot of the Spanish business ecosystem: In search of growth.
References
FUNDACIÓN AFI EMILIO ONTIVEROS. (2025). Radiografía del tejido empresarial español: en busca del crecimiento [Snapshot of the Spanish business ecosystem: In search of growth]. Madrid: Fundación Afi Emilio Ontiveros.
FUNDACIÓN AFI EMILIO ONTIVEROS. (2026). Top 100 líderes de crecimiento 2026: las empresas medianas líderes en crecimiento aceleran su productividad sin frenar el empleo ni los salarios [Top 100 growth leaders in 2026: The fastest-growing medium-sized enterprises are boosting productivity without cutting jobs or pay]. Madrid: Fundación Afi Emilio Ontiveros.
OECD (2021). Understanding Firm Growth: Helping SMEs Scale Up. OECD Studies on SMEs and Entrepreneurship. Paris: OECD Publishing.
OECD (2025). OECD Compendium of Productivity Indicators 2025. Paris: OECD Publishing.
Pablo Guijarro and Irene Peña. Afi