European banks’ annual reports: Comparative analysis of complexity and tone
In recent years, financial reporting across European banks has, on average, become more complex, reflecting the more challenging operating environment faced by banks. Focusing on improving readability and tone of financial reporting could represent one way to increase the clarity and transparency of quantitative financial disclosures.
The increased complexity and intensity of banks´ operating environment has raised the need for transparency in financial reporting to all stakeholders. In the face of more onerous reporting obligations imposed by regulators and standard setters, empirical evidence suggests banks´ reporting has actually become more complex. In particular, the way banks are using linguistic features probably reduces the clarity and brevity of their quantitative reports. Surprisingly, banks from non-Anglo-Saxon countries make an effort to produce more concise and readable reports than their Anglo-Saxon counterparts. As regards the tone of reports, as expected, during the crisis years, report language was more negative and uncertain, reflecting overall concerns over macroeconomic and financial market conditions. In the case of Spain, evidence suggests that financial reports were more readable and optimistic compared to the European average, although readability measures were more volatile.
Introduction and background
Recent reports on the financial services industries reveal that banks’ business models and financial products became more complex in the last years. This led to an increase in profitability on average, but on the downside also increased the risk position of financial institutions (Oliver Wyman, 2015). Due to this increased complexity in operations, it is crucial that banks report their financial (risk) position and performance in a clear and concise way to all stakeholders (shareholders, creditors, regulators, and government agencies among others). A Financial Times article reported that banks and other financial companies “are publishing annual reports that are overly complicated and indigestible” (FT, 2014; KPMG, 2012). In recent years, mandatory reporting under International Financial Reporting Standards (IFRS) and U.S. Generally Accepted Accounting Principles (US-GAAP) required further disclosures of information to increase the transparency of annual reports and to strengthen the communication between banks and investors. As this increased the complexity of understanding the reports, the International Accounting Standards Board (IASB) started an initiative on disclosures in 2011 that aims at making disclosures less complex and finding new ways of reporting specific accounting information more efficiently. With regard to European banks, a report titled Assessment of Banks’ Pillar 3 Disclosures (2009) has been published by the Committee of European Banking Supervisors (CEBS). CEBS comes to the conclusion that “banks have made a huge effort to provide market participants with information, allowing a better assessment of their risk profile and their capital adequacy” and also mentions that “banks have notably heightened the level of quantitative and qualitative disclosures on their credit risk and securitizations activities.” Nevertheless, the overall “reporting burden” still leads to annual reports that significantly increased in length and complexity. Although the focus of standard setters and regulators is on the complexity of quantitative content included in the financial reports (e.g., information related to asset quality, tier-1 capital, liquidity and performance), the way banks make use of linguistic features of the qualitative information may also alter the transparency and conciseness of the reported information. Overall, it may impact the usefulness of the quantitative disclosures.
In this study, we analyze the narrative of annual reports to investigate the way in which financial reporting information embedded in banks’ annual reports is disseminated to investors. Specifically, we examine different lexical properties (readability/complexity and tone) of the information provided by banks in their financial reports. For this purpose, we use different linguistic metrics previously used in the context of financial disclosures.
Especially in the current globalized economy, investors and users of financial statements face the challenge of dealing with information published in different languages. With the aim to reach a broader set of investors, more firms and banks in non-English-speaking countries use English, the lingua franca, for financial reporting purposes. Providing information in English may reduce information frictions faced by investors across countries and it, in turn, increases the company’s investor base and analyst following, as suggested by prior studies (Jeanjean et al., 2015). This is particularly relevant in Europe given the diversity of languages and cultures that coexist in a relatively small geographic area. The potential benefits conferred through the publication of annual reports in English are contingent upon the extent to which the documents contribute to an effective communication of relevant information which can be interpreted by shareholders, individual investors, analysts, the general public and other users of financial information (Loughran and McDonald, 2014). Our focus is on European banks that provide financial information in English language.
Sample and methodology
We use data from Thomson Datastream and the European Banker to identify the top European financial institutions during the period 2005-2012. Our original sample comprised of 72 European financial institutions from 18 countries. Financial data was collected from ORBIS (Bureau van Dijk Electronic Publishing). To compute the linguistic metrics, we use the annual reports published in English language, which were downloaded from the banks’ websites. We excluded those banks for which the annual reports published in English language were not available. The original file format of the document was in PDF format. These files were converted into pure text and then parsed with software programs written to obtain the various linguistic measures. Due to the security settings of the PDF files, some of the documents could not be converted into pure text which reduced our sample to 69 banks.
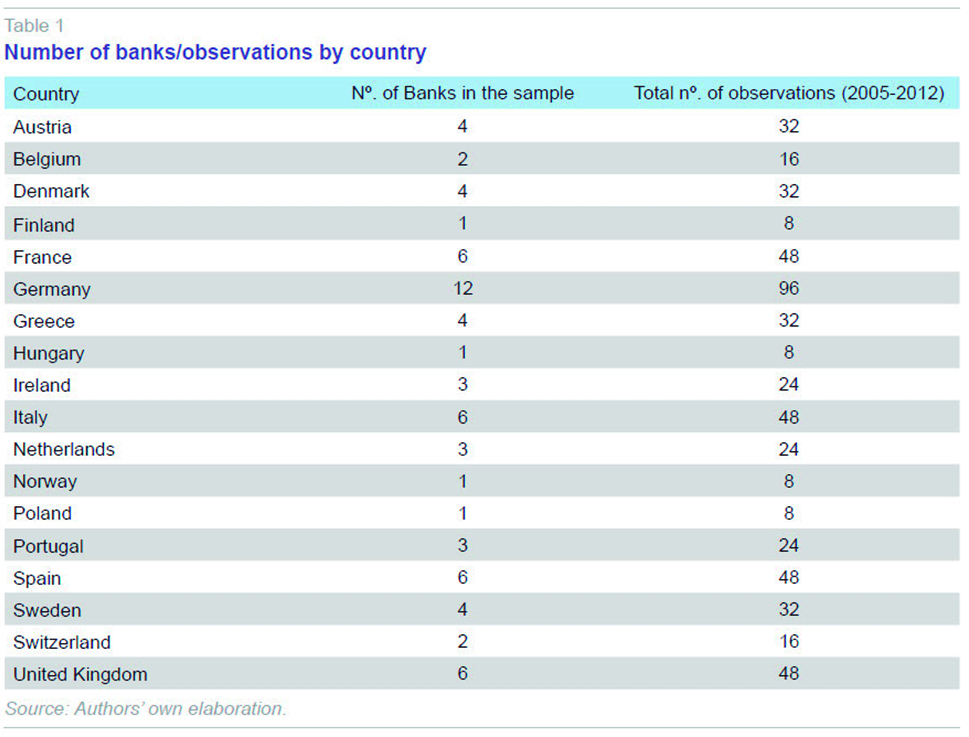
Table 1 provides information about the number of banks included in the sample and the total number of observations per country. We have a complete panel of 69 banks located in 18 different European countries, with 552 observations for the period 2005-2012. All countries are European Union (EU) member states except Norway and Switzerland. Of the 16 EU countries included in the sample, 5 do not belong to the Eurozone (Denmark, Hungary, Poland, Sweden and the United Kingdom (UK)). The largest number of observations comes from Germany (12 banks) followed by France, Italy, Spain and the UK (6 banks in each country). Around 70% of the banks in the sample are listed in stock markets and the average size is 203 million euro (minimum 11.3 million euro and maximum 2,200 million euro).
Most prior studies have analyzed the readability of 10-K (annual) and 10-Q (quarterly) reports submitted to the Securities and Exchange Commission (SEC) in the US (Li, 2010). There are several differences between our sample and the 10-K (or 10-Q) filings: First, the structure of annual reports varies from country to country; second, in many cases, the annual report is not a translation of the official document submitted to the regulators (the local-language annual report) but a document prepared on a voluntary basis to communicate financial information to a large base of potential investors and analysts. As a result, the content and structure of the English-language annual report varies significantly from bank to bank even in the case of banks located in the same country. Given the nature of our sample, we do not compute the complexity and tone metrics for the different sub-sections of the document but for the document as a whole.
We use various linguistic metrics to measure the complexity of the financial reports. The most basic and frequently used metric developed for determining readability of documents is the FOG index (Gunning, 1969). The FOG Index measures the complexity of a text as a function of the average number of words per sentence and the percentage of complex words. Higher values of the index correspond to more complex text. The formulae of the FOG Index and its interpretation is provided in Table 2.
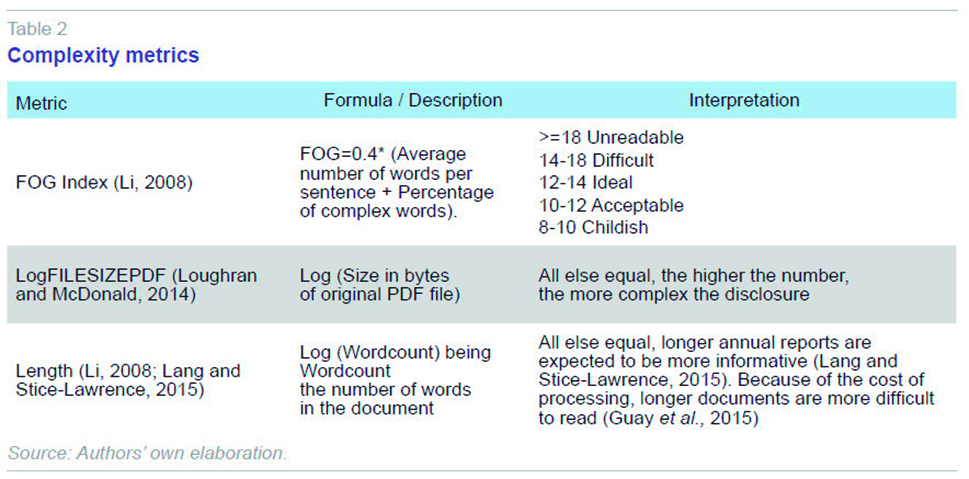
Several recent studies have used the FOG index as a proxy for the complexity of annual reports (e.g., Lang and Stice-Lawrence, 2015; Guay et al., 2015). Furthermore, the SEC has even contemplated the use of the FOG index as a standard metric to identify poorly written corporate documents. As noted by prior studies, the FOG Index has significant advantages as a metric of linguistic complexity: it is an objective measure (not based on surveys or opinions) that can be computed for any narrative disclosure and it provides a measure of the overall syntactic complexity of written communications (Lehavy et al., 2011). However, this metric is not free of criticism. For example, Loughran and McDonald (2014) demonstrate that the FOG index is poorly specified in financial applications. In their view, the first component of the index is misspecified and the second is difficult to measure. They argue that file size is a better proxy for readability because it “does not require document parsing, facilitates replication, and is correlated with alternative readability constructs” (Loughran and McDonald, 2014). Accordingly, we also consider the variable LogFILESIZEPDF, defined as the logarithm of the size of the PDF file measured in bytes as a proxy for the complexity of the financial reports. All else equal, the higher the number of LogFILESIZEPDF, the more complex the disclosure. Other researchers (e.g., Li, 2008; Guay et al., 2015) propose the number of words as a proxy for the complexity of financial documents. This variable is likely to capture the amount of disclosure as well as the complexity of the disclosure (Li, 2010). Under the assumption that the cost of processing longer documents is higher, longer document are considered to be more difficult to read (Guay et al., 2015). In some studies, this variable is used as a proxy for informativeness, suggesting that all else equal, longer documents are expected to be more informative (Lang and Stice-Lawrence, 2015). Following prior studies, we use the natural logarithm of the number of words to account for a non-normal distribution across all banks (variable LENGTH). The advantage of using this metric is that it is simple to calculate; the downside is its high correlation with respect to the amount of disclosure.
To obtain measures for the tone of financial narratives, we use Loughran and McDonald’s (2011) six sentiment word lists (uncertain, positive, negative, litigious, strong modal and weak modal) created specifically for measuring the tone of financial documents.
[1] The lists include 285 words denoting uncertainty (
e.g., risk, believe and
assume), 354 positive words (
e.g., beneficial and
successful), 2,349 negative words
(e.g., loss, against, failure and
decline) and 871 litigious words
(e.g., contract and
lawsuits). Two lists refer to modal words, which are used to express possibility (weak modal words, for example
may, could, and
possible) and necessity (strong modal words, such as always,
must and
will). Some words appear in more than one list (for example, words like
unpredictable appear on both the list of uncertain and negative words). These lists have been applied specifically to 10-Ks and newspaper articles (
e.g., Jegadeesh and Wu, 2013).
A final sentiment score of the text is calculated using the proportional weight, i.e., the ratio of the sum of frequency of occurrences in that document of each word in the word list to the total number for words in the document (variables UNCERTAIN, POSITIVE, NEGATIVE, LITIGIOUS, MODALSTRONG and MODALWEAK). Following Davis et al. (2012), we also compute the language measure NET_OPTIMISM defined as the difference between the percentage of positive words and the percentage of negative words. This type of metric is not free of criticism. Previous work analyzing the positive tone of text suggests that the measure of positive sentiment is often challenging because positive words are often wrapped around in negative phrases (Loughran and McDonald, 2011). To mitigate this problem, we included a window of words around the focal phrase to account for these instances. Like in the case of the linguistic metrics, we compute the tone metrics for the entire document.
Complexity and tone of banks’ financial reports 2005-2012
Table 3 presents the summary statistics of the complexity metrics. Besides the variables described above (FOG index, LENGTH and LogFILESIZEPDF), we also provide information about the size of the TEXT document (FILESIZETEXT), the number of words (WORDCOUNT), and the change in the FOG index (∆FOG Index) and in the length of the document (∆LENGTH ). For completeness, we show the descriptive statistics of all complexity metrics even though we focus our analysis on the FOG Index.
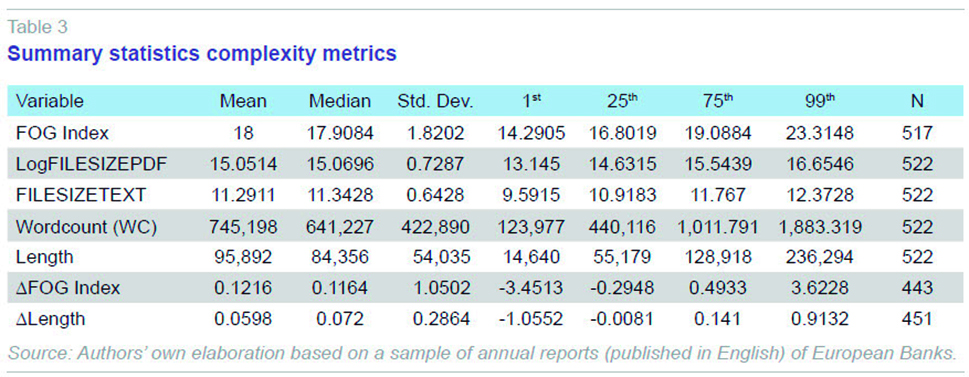
The mean and the median of the variable FOG are 18.00 and 17.91, respectively. This suggests that, following the standard interpretation of this index (see Table 2), the financial reports of banks are very difficult to read and empirically supports the criticism provided by regulators and investors. Besides the already complex and unclear quantitative disclosures provided by financial institutions in their annual reports (FT, 2014; KPMG, 2012), the transparency of financial reports may be negatively affected by the linguistic features of the qualitative information and narratives included in the documents.
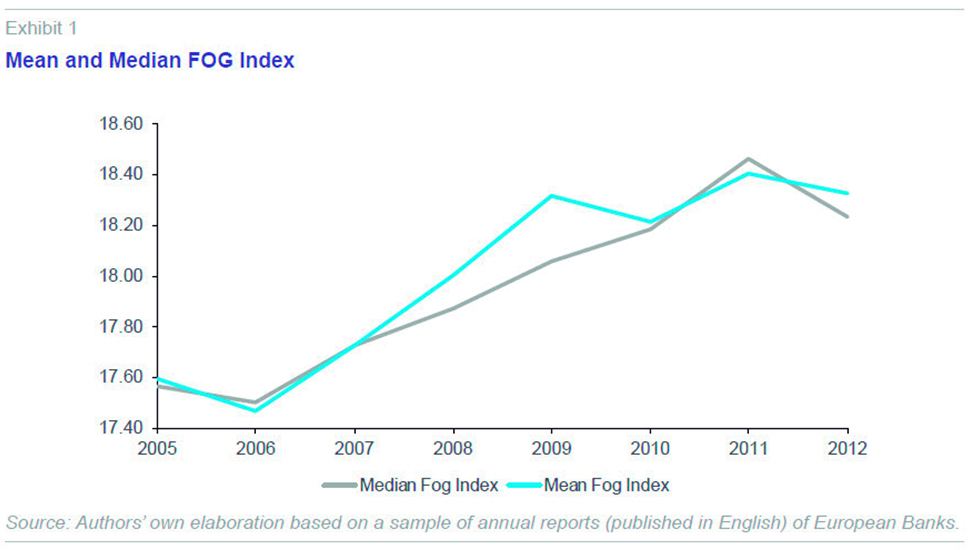
Exhibit 1 shows the mean and median of the FOG Index for the sample firms for the period 2005-2012. We observe a consistent increase of the FOG Index after 2006 to 2011, suggesting an increase in the linguistic complexity of banks’ disclosures during the years of the economic and financial crisis. Although regulators and standard setters demanded clear and concise financial reporting during the recent financial crisis, our evidence suggests that the way banks used linguistic features in their reports reduced the clarity and brevity of the quantitative disclosures.
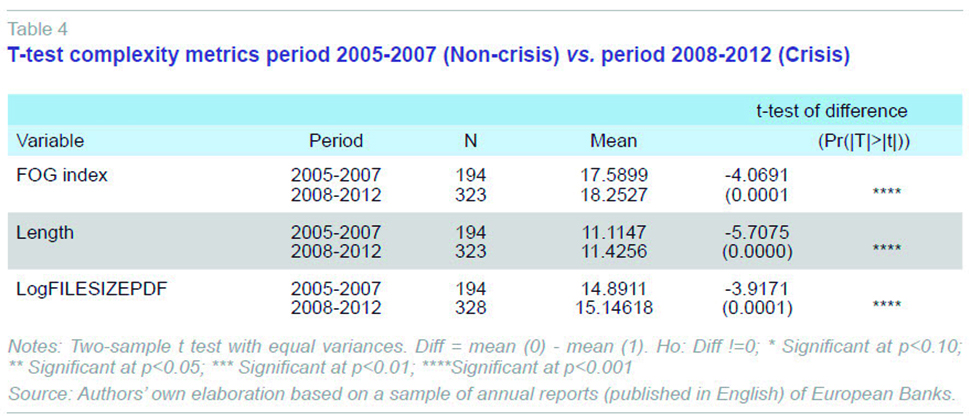
We run a t-test to compare means of the linguistic metrics for the years 2005-2007 (before the financial crisis) and the period 2008-2012. The results reported in Table 4 suggest significant changes in the readability, length and size of the annual reports from the years 2005-2007 to the period 2008-2012. That is, the mean of the FOG index for the crisis period (2008-2012) is significantly higher than that for the non-crisis period (2005-2007). Similarly, the size of the report measured in number of words (LENGTH) and in the size of the PDF file (LogFILESIZEPDF) increased during the financial crisis.
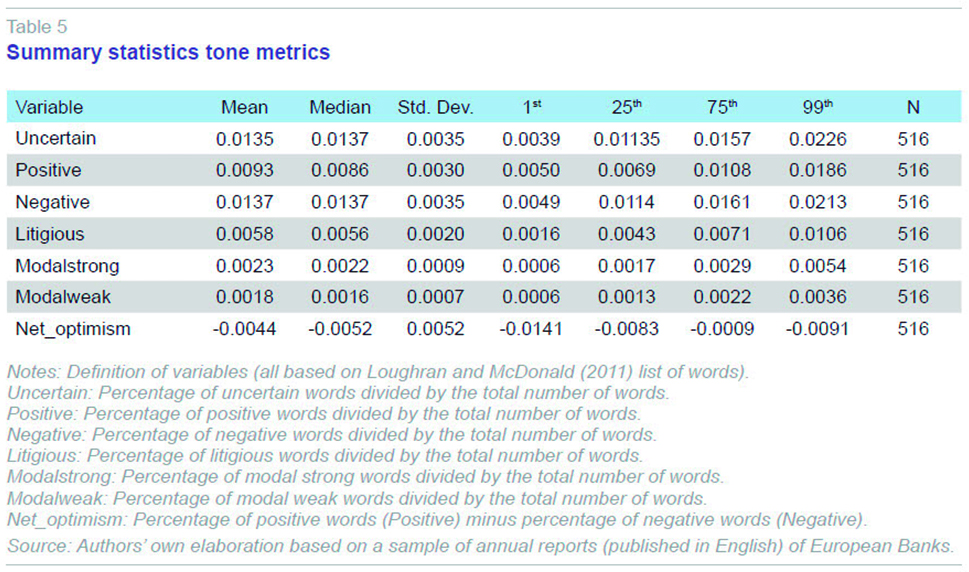
The tone metrics for the complete sample are reported in Table 5. We find that the proportion of negative words used by European financial institutions during the period 2005-2012 was 1.37%, slightly higher than the proportion of uncertainty words (1.35%) and the proportion of positive words (0.93%). The mean of the variable NET_OPTIMISM is negative, which is not surprising if we expect annual reports to capture information not only about the economic and financial position of the entity but also about the macroeconomic environment. On average, the reports have 0.58% of litigious words. Regarding the proportion of modal strong and modal weak words, the average percentages are 0.23% and 0.18% respectively.
A t-test for the means of the tone metrics for the crisis and non-crisis periods suggests that there are significant differences (see Table 6). Except for the modal strong words, we find significant differences for the tone metrics of reports published in the period 2005-2007 compared to those published in 2008-2012.
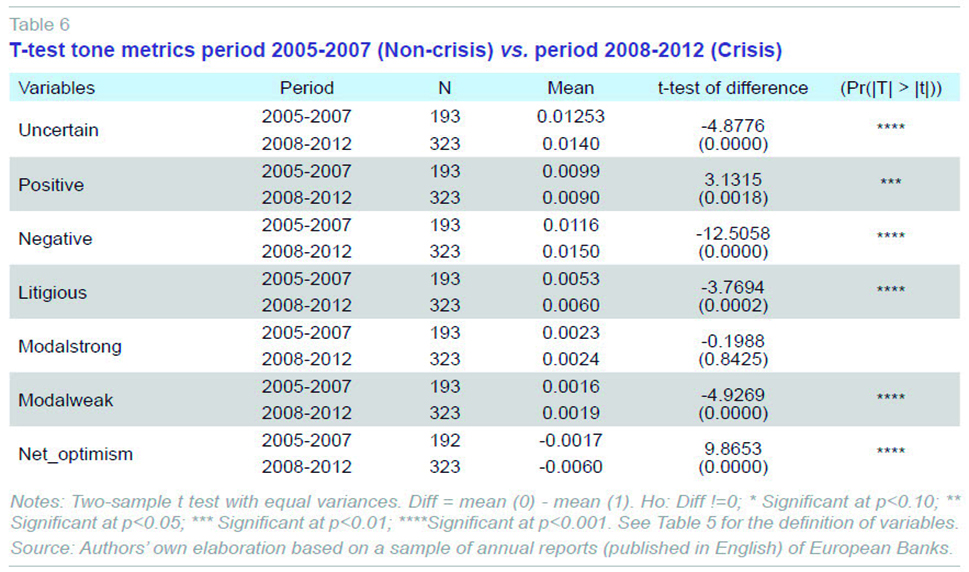
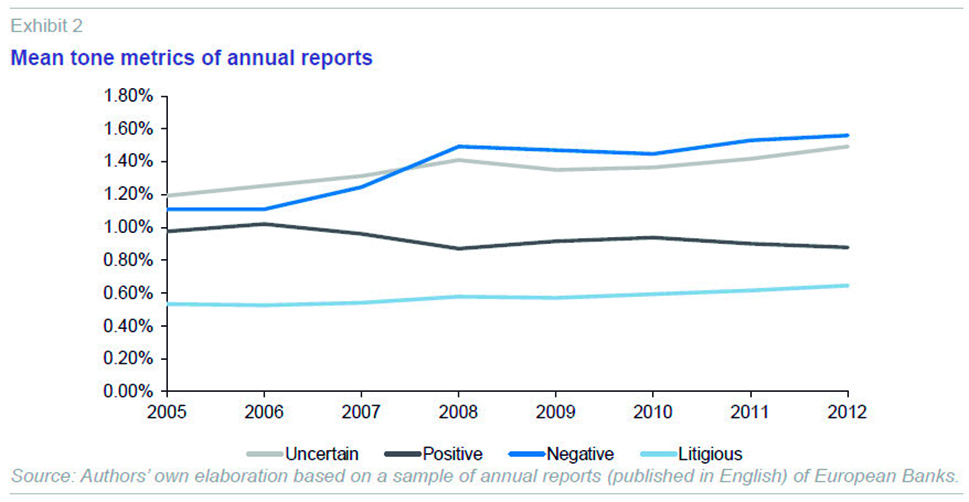
As showed in Exhibit 2, the annual reports during the crisis period contain significantly more negative and uncertain words and less positive words than the reports published in the period 2005-2007. These reports also have more litigious words and more modal weak words. Overall, the annual reports published during the crisis are more pessimistic.
Differences within Europe: Cross-country comparisons
Does the home country language make a difference in the complexity and tone of the narratives of banks’ annual reports?
Our sample is comprised of annual reports published in English from banks located in different countries with different languages. Previous research suggests that there are significant differences in financial reporting in English depending on the language of the home country of the company (e.g., Lundholm et al., 2014). To explore the potential influence of the home country language on the disclosure characteristics of the reports, we consider whether the banks are located in English-speaking countries. One could argue that banks headquartered in Anglo-Saxon countries (Ireland and the UK) have an advantage when disseminating financial reporting information in a more concise and understandable way than their non-English-speaking counterparts (all countries in Table 1 except Ireland and the UK) due to their proficiency in the English language.
The results of the t-tests for the equality of means (untabulated) suggest that there is a significant difference between the complexity metrics of banks of different countries depending on whether or not the bank is located in an English-speaking country. Annual reports of banks located in Anglo-Saxon countries are more complex and difficult to read than the reports published by banks located in non-Anglo-Saxon countries. Specifically, banks in Anglo-Saxon countries have on average, a higher FOG index and longer size (variable LENGTH). We also observe a weak significant difference (p-value <0.10) in the case of the variable LogFILESIZEPDF. A potential explanation for these findings is that non-Anglo-Saxon banks are very cautious, on average, when translating their reports into the English language. In addition, we should also take into account that in some cases the annual reports published in English are not a translation of the annual report prepared in the official language of the country of origin but a summary or a simplified version of such document. Our results are in line with the findings of Lundholm et al. (2014). Overall, these results suggest that banks from non-Anglo-Saxon countries make an effort to write more readable reports in English than their Anglo-Saxon counterparts.
When comparing the tone metrics for Anglo-Saxon countries and non-Anglo-Saxon countries, our results (untabulated) suggest that there exist significant differences in the means of the percentage of uncertain, negative, litigious and modal weak words. Our findings indicate that annual reports produced in English-speaking countries contain more positive, negative, litigious and uncertain words. That is, banks located in Ireland and the UK communicate more non-neutral sentiments in the annual reports than banks located in other countries.
Does the severity of the crisis at a country level make a difference in the complexity and tone of the narratives of banks’ annual reports?
The impact of the crisis on the economy in general and on the banking sector in particular has not been homogenous across countries. Moreover, several European countries were so badly affected by the crisis that their governments were forced to seek external financial assistance. We test whether there are significant differences in the disclosures of banks located in countries that received funds provided by the European Stability Mechanism or its predecessors (the European Financial Stability Facility (EFSF) and the European Financial Stabilization Mechanism (EFSM)). Specifically, we compare the complexity and tone metrics of banks located in Greece, Ireland, Portugal and Spain (the four bailed-out countries) with the rest of the banks included in the sample.
The results for the complexity metrics (untabulated) suggest that there are no significant differences in the readability of annual reports produced by banks located in the bailed-out countries, except for the variable LogFILESIZEPDF. We do find, however, significant differences in the tone of the annual reports. Contrary to our expectations, the annual reports produced by banks located in Greece, Ireland, Portugal and Spain include more optimistic words and less pessimistic words. This result seems to suggest that those banks located in the bailed-out countries adopt a more optimistic tone in their annual reports in an attempt to alleviate the potential negative effect of the economic situation at a country level on their stakeholders. They include a significantly higher percentage of legal and litigious words.
Spanish banks’ annual reports compared to their European peers
In order to examine the characteristics of the annual reports provided by Spanish banks, we look at their FOG Index and the LENGTH variables and compare them to the same metrics for all European banks included in the sample (see Exhibits 3-4-5). Exhibit 3 shows the median level of FOG index for all banks versus banks in Spain from 2005-2012. We observe that while the median FOG Index for all banks shows a general upward trend, the median FOG index for Spanish banks suggests that their financial reports were more readable compared to the median fog index of all banks. The readability index for the non-Spanish banks increased from 2006 to 2011 suggesting that the annual reports were more complex over time, as noted before. The FOG index for Spanish banks shows a different pattern: it increased significantly in 2008 with no significant variations in 2009 and 2010. For the years 2011 and 2012, the readability of the annual reports of Spanish banks was significantly higher than the readability of the reports published by their European peers.
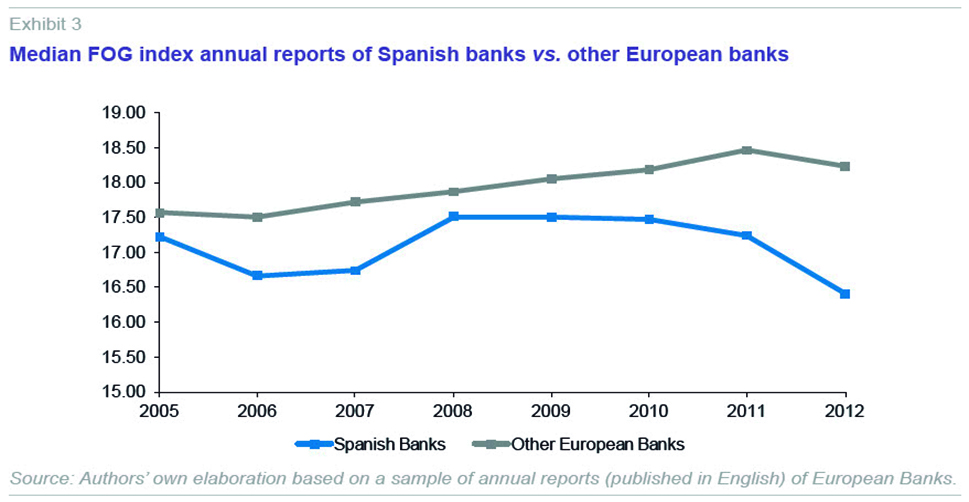
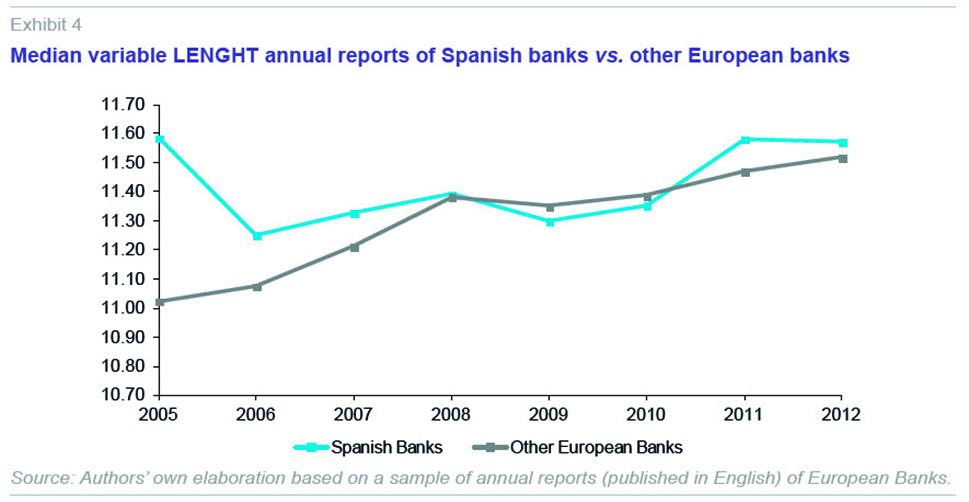
Exhibit 4 shows the median level of LENGTH for the Spanish banks included in the sample compared to the other European banks. We observe that over time the length of the Spanish banks’ annual reports is similar to the length of other European financial institutions. While there was a significant difference in the first years examined (2005-2006), for the period 2008-2012 there are no significant differences in terms of size between both subsamples. Overall, while Spanish banks’ annual reports were significantly longer than those of their European counterparts, since 2008 there are no significant differences and both groups of banks show an increased size in their annual reports in the years of the financial crisis.
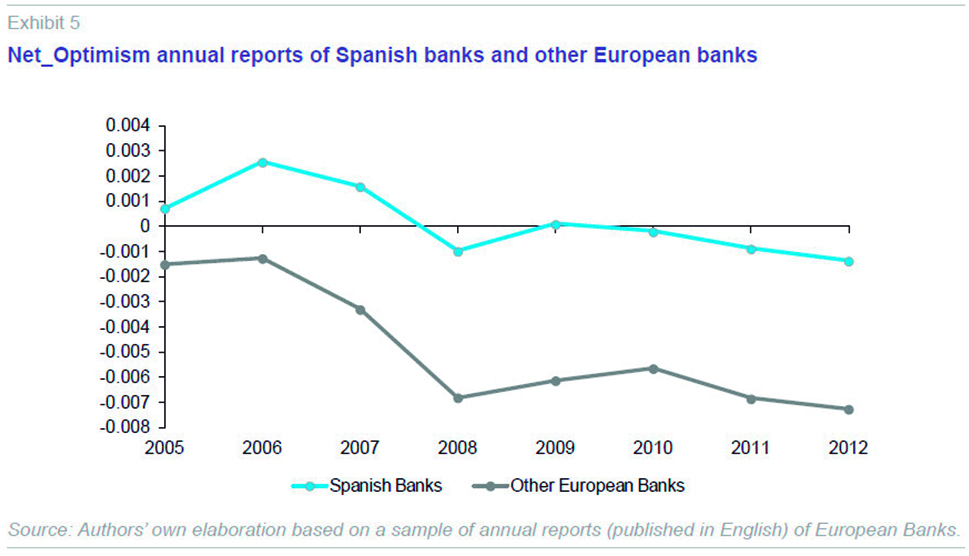
As far as the tone metrics is concerned, Exhibit 5 shows the evolution of the variable NET_OPTIMISM for Spanish Banks compared to their European peers. Overall, Spanish banks’ annual report are consistently more optimistic than the reports produced banks located in other European countries. While the trend is similar for both groups, the gap in the tone of Spanish banks and other European banks increased after 2008.
Conclusion
Our results for a sample of European banks’ annual reports for the period 2005-2012 suggest that the complexity of the narratives in the reports increased over time. We also observe an increase in the percentage of negative, uncertain and litigious words in the annual reports during the period. The change in the tone of the reports reflects the significant deterioration of macroeconomic conditions in Europe and the concerns about the financial markets at the end of the year 2008. Both the increase in the complexity of annual reports for all banks over time and the more pessimistic tone, specifically after the onset of the financial crisis in 2008, can be interpreted as reflecting the increased intensity and complexity of banks´ operating environment.
The complexity and the tone of messages and narratives influence individuals’ behavior and judgment. Overall, we recommend that readability and tone measures should be incorporated by banking regulators and supervisors and accounting standard setters when formulating new rules and policies on disclosures and footnotes for financial institutions, as a focus alone on improving the quantitative disclosures in the annual report might be reduced if the language used by preparers potentially conceals those clear and concise financial disclosures.
Note
References
CEBS (2009),
Assessment of Banks’ Pillar 3 Disclosures, Published by the Committee of European Banking Supervisors. Available at
https://www.eba.europa.eu/documents/10180/16151/Assessment-of-Pillar-3-disclosures.pdfDAVIS, A. K.; PIGER, J. M., and L. M. SEDOR (2012), “Beyond the numbers: Measuring the information content of earnings press release language,”
Contemporary Accounting Research, 29(3): 845-868.
FINANCIAL TIMES (2014), “Bank annual reports too long or ‘complex,” by SAM FLEMING and HARRIER, AGNEW.
http://www.ft.com/intl/cms/s/0/3e0ad926-ef0b-11e3-acad-00144feabdc0.html#axzz3ntD1EqJT (June 08 2014, 3:03pm).
GUAY, W.; SAMUELS, D., and D. TAYLOR (2015), “Guiding through the Fog: Financial statement complexity and voluntary disclosure,” WP University of Pennsylvania, http://papers.ssrn.com/sol3/papers.cfm?abstract_id=2564350GUNNING, R. (1969), “The Fog index after twenty years,“
Journal of Business Communication, 6(2): 3-13.
JEANJEAN, T.; LESAGE, C., and H. STOLOWY (2015), “Why do you speak English (in your annual report)?,”
The International Journal of Accounting, 45: 200-223.
JEGADEESH, N., and D. WU (2013), “Word power: A new approach for content analysis,”
Journal of Financial Economics, 110(3): 712-729.
KPMG (2012),
Users demand improvements in the quality of annual reports! KPMG, DK Document. LANG, M., and L. STICE-LAWRENCE (2015), “Textual Analysis and International Financial Reporting: Large Sample Evidence,” University of North Carolina
WP 2015.
http://papers.ssrn.com/sol3/papers.cfm?abstract_id=2407572LEHAVY, R.; LI, F., and MERKLEY, K. (2011), “The effect of annual report readability on analyst following and the properties of their earnings forecasts,”
The Accounting Review, 86(3): 1087-1115.
LI, F. (2008), “Annual report readability, current earnings, and earnings persistence,”
Journal of Accounting and Economics, 45: 221-247.
— (2010), “The Information Content of Forward-Looking Statements in Corporate Filings-A Naïve Bayesian Machine Learning Approach,”
Journal of Accounting Research, 48(5): 1049-1102.
LOUGHRAN, T., and B. MCDONALD (2011), “When is a liability not a liability? Textual analysis, dictionaries, and 10-Ks,”
The Journal of Finance, Vol. LXVI(1): 35-65.
— (2014), “Measuring readability in financial disclosures,”
The Journal of Finance, LXIX(4): 1643-1671.
LUNDHOLM, R.J.; ROGO, R., and J. ZHANG (2014), “Restoring the Tower of Babel: How Foreign Firms Communicate with US Investors,”
The Accounting Review, 89: 1453-1485.
OLIVER WYMAN (2015), Managing Complexity: The State of the Financial Services Industry,
http://www.oliverwyman.com/content/dam/oliver-wyman/global/en/2015/jan/SoFS-2015/State_of_the_Financial_Services_Industry_Report_2015.pdf
Nieves Carrera. IE Business School and IE University
Jie Mein Goh. Beedie School of Business and Simon Fraser University
Ronny Hofmann. IE Business School and IE University