
Trump’s tariff war: Limited impact, diverging effects across partners
Despite headline-grabbing tariff announcements, the average burden on most U.S. trading partners remains moderate. While China has been hit hard, the EU and other allies have faced relatively modest increases.
Abstract: Since 2025, U.S. tariff policy under President Trump has generated significant uncertainty, marked by frequent announcements of steep “reciprocal” tariffs followed by partial reversals or diluted deals. Nonetheless, customs revenue data reveal that the average effective tariff rate applied to most trading partners has remained moderate, far below the levels suggested by headline announcements. China stands out as the exception, facing average tariffs close to 40%, with more than four-fifths of its exports subject to duties, notably above the share affected under the Smoot-Hawley Act. By contrast, the EU continues to enjoy relatively favorable access to the U.S. market, with tariff rates substantially below those applied to major Asian competitors. While the aggregate impact on U.S. imports has so far been modest, sharp divergences across countries are reshaping market shares, with China losing ground and the EU maintaining stable exports.
Introduction
So far, so good. The seemingly earth-shattering ‘reciprocal’ tariffs, announced by U.S. President Trump and then partially implemented since April have had little impact on trade flows so far. U.S. imports have stabilized after the rush in March to beat the tariffs, and the market share of the EU has remained constant, with EU exports to the U.S. up about 40 billion euros during the first semester of this year.
The recent EU-U.S. “
framework agreement” has been widely criticized as a capitulation. But its implementation would only confirm the relatively advantageous position of the EU in terms of access to the U.S. market, as the tariff rates facing EU exporters remain far below those of China and also slightly below those facing other Asian competitors, such as Korea or Japan. Only Canada and Mexico are in a significantly better position than the EU because most of their exports to the U.S. remain still duty free. But these two economies are too small to constitute significant competitors.
How to measure tariffs in (almost) real time
Trump’s tariff policy consists of a bewildering succession of announcements of high tariffs, often followed by vague ‘deals’ with headlines rates much lower than the “reciprocal” tariffs announced on April 2nd. At the same time, it is often not clear whether announced rates are actually applied.
Given the rapid changes in rates, announced and implemented, it is difficult to obtain an overall picture of where U.S. trade policy stands. The U.S. uses the globally Harmonized System of the WTO which, at the most detailed (10 digit) level, has about 20 thousand tariff lines. Moreover, as each of the over 150 U.S. trading partners can now face different tariff levels, there might be up to 3 million different tariff rates to consider. To put together an overview of U.S. tariff policy in the form of an average tariff one would have to combine the tariff lines with the data on bilateral imports, requiring potentially another 3 million pieces of information. Even calculating a simple average tariff rate for the U.S. is thus no simple task.
Fortunately, there exists a much simpler approach to gauge the restrictiveness of U.S. tariff policies. One can simply divide tariff revenues by imports. This simple ratio of two numbers represents the average effective tariff actually applied – as opposed to announced tariff schedules. The U.S. Treasury publishes data on customs revenues and imports with a delay of about 6 weeks. This source can thus yield close to real time data.
The ratio of customs revenues to imports is sometimes called the effective tariff rate or the average collected rate. This measure yields often very different results than the average tariff rates estimated based on Trump’s policy announcements.
[1] For example, when announcing the 3 months pause in reciprocal tariffs on April 9
th, the President announced that during this period all countries would face a baseline tariff of 10%, with much higher rates applying to China. This should have meant that the average tariff rate should be above 10%. However, the average rate collected in May/June remained (across all countries) at around 9%.
Average rates versus dutiable rates
Most countries exempt a sizeable share of imports from paying duties. This is the case typically for raw material imports for which there are no domestic producers to protect. Even Trump follows this pattern. These so-called non-dutiable imports should be taken into account when one wants to measure the distortions caused by tariffs.
A useful variant of the effective rate is the average dutiable rate defined as customs revenues divided by dutiable imports. This rate is higher than the average tariff rate, with the difference between the two a function of the share of dutiable imports in overall imports. For Canada and Mexico this difference is essential to go beyond headlines.
A widely accepted general principle in economics implies that it is better to apply a moderate tax on the entire economy than to tax some sectors very heavily and exempt others. In trade policy this means that any unequal tariff structure that combines zero rates on some imports with very high rates on the remaining portion of imports will incur greater total efficiency costs than a uniform tariff that spreads the tax burden evenly across all imports (Gros, 2025a). This is one of the reasons why the Smooth Hawley Act of 1930 was so destructive. It imposed tariffs of around 60% on a variety of goods worth about one third of U.S. imports at the time. The average tariff rate of Smoot Hawley is thus often reported as around 20%. However, the distortionary effect was much larger than a uniform tariff rate of 20%. Gros, 2025 shows that one can approximate the distortionary effect of levying a high tariff on a fraction 1/n of all imports by multiplying the average tariff rate by the square root of n. In the case of Smoot Hawley, this means that its distortionary effects were equivalent to a uniform tariff rate of 20%*SQRT(3) or about 34%. Trump’s tariffs remain so far much below this benchmark (except for China).
The sharp increase in customs revenues collected over the last month has attracted much attention. However, revenues collected in both May and June have remained below 10% of imports and, as of June 2025, slightly less than one half (46%) of U.S. imports were subject to duties. The average dutiable rate was thus, at close to 20%, more than twice as high as the average effective rate. In July monthly tariff revenues increased to about 26 billion USD, still only about 10-11% of imports (of goods). If one applies the above formula to calculate the distortionary effect of the present (20% rate on roughly one half of imports) on the U.S. one arrives at the equivalent of a tariff rate of about 14% on all imports (10%*SQRT(2)).
Different trading partners get different treatment
Both the average effective rate and average collected rate on dutiable imports can also be calculated on a bilateral basis. For a country that follows the Most Favored Nation principle of the WTO, there should be little difference in rates across trading partners. However, Trump is blatantly disregarding MFN principles. There are thus large cross-country differences in the bilateral average tariff rate. The first difference is between China and the rest of the world. Over 80% of U.S. imports from China are now subject to duties, with rates mostly around 40%.
Among the other trading partners, the dutiable rates are much lower, usually around 20%. But there are large differences in the share of their exports to the U.S. subject to duties. About 60% of EU exports to the U.S. are dutiable, but for Canada and Mexico this share is below 20%.
Further differences in effective rates can arise from differences in the composition of trade. For example, imports from Gulf states consist mainly of petroleum products that are duty free, while imports from Bangladesh consist mainly of textile products that had already been subject to substantial tariffs in the past. With Trump these differences across countries have escalated by an order of magnitude.
Table 1 provides an overview of the two concepts of average tariff rates for the U.S., and, as a memorandum item the share of imports covered by duties at three points in time: 1933 (after the Smooth Hawley Act), 2015 (pre-Trump) and the latest available data. Ten years ago, the difference between the rates faced by China and the rest of the world was about 2 percentage points, now it is close to 30 percentage points on both measures.
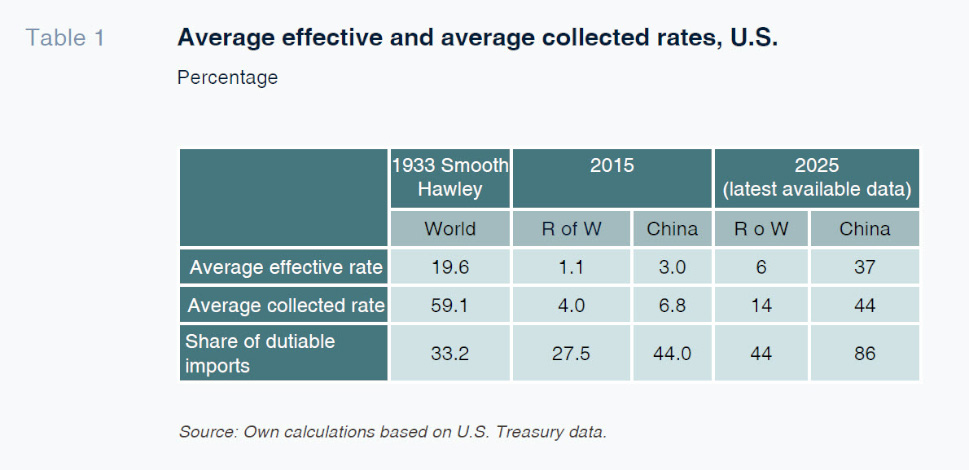
The figures in Table 1 suggest that China is already now facing tariff rates of the same order of magnitude as those of the Smooth Hawley tariffs.
[2] The main difference being that by now over 4/5 of all Chinese exports to the U.S. are dutiable (Smooth Hawley had exempted 60% of imports from all tariffs). The average for the rest of the world remains much lower. But even here there are large differences across different countries.
In general, the cross-country differences are much higher for average rates than for dutiable rates. For example, Canada and Mexico still face very low average effective rates (2–4%, respectively) because most of their exports to the U.S. are exempted from duties. The high headline figures on some specific products like steel do not change this average that much because the share of these sectors in the trade with the U.S. is limited. The rates on those products that are dutiable are relatively elevated (over 20% in both cases). Public attention focuses naturally on these high rates, but their overall impact should be limited.
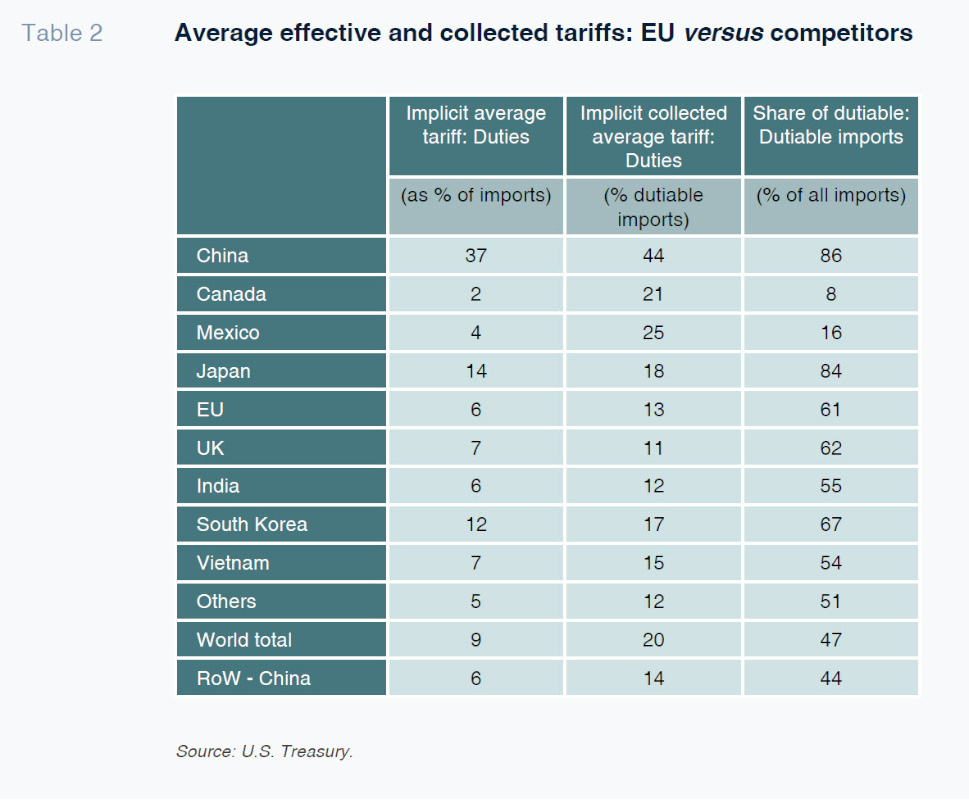
Somewhat surprisingly, the share of Japan’s export to the U.S. that is dutiable is at 80% similar to that of China, but the rates are much lower (on average about 15%).
For the EU, one can observe a similar, but much more attenuated phenomenon. The average rate on dutiable products is 13%, but the overall effective rate is only 6% because of the still relatively large proportion of exports to the U.S. that are not dutiable (e.g. pharmaceuticals). The difference between the EU and the UK is minor, but the data might not yet reflect the impact of the UK-U.S. agreement. More in general, the EU seems to face easier market access in the U.S. compared to its major developed Asian rivals, Japan and South Korea. Moreover, EU producers have a very large advantage relative to their most important rival, namely China, that faces an average effective rate about 30 percentage points higher.
These relative tariff rates suggest that Mexico and Canada will be the main beneficiaries of Trump’s trade policy as exporters from these two countries should be able to capture additional market shares in the (shrinking) U.S. import market. EU exporters should be able to hold their market shares in the U.S. as they gain relative to China, moreover, increased Canadian and Mexican exports to the U.S. might well require more machinery and other inputs from Europe.
Since the U.S. is the EU’s largest export market one could have expected a significant negative impact from the tariffs. But this has not materialized so far.
Different Member States have different exposures to the U.S. Germany has the biggest exposure, with exports to the U.S. accounting for almost 3.5% of GDP, for France it is only 1.8% of GDP and for Spain the U.S. market is even less important accounting for about 1% of GDP. One can observe a tight correlation between the importance of exports to the U.S. and the reaction of national policy makers to the EU-U.S. trade deal. In countries with little exposure to the U.S., like France and Spain, the reaction has been much less negative than in Germany which has the highest exposure.
Impact on trade flows
Some of Trump’s tariffs have been in force for a number of months. One should thus be able to see a first impact. The very short run data is difficult to interpret because during the month of March imports increased considerably in an attempt to beat the looming tariffs. However, this ‘hump’ should now have been offset by lower imports as traders draw down their inventory. However, somewhat surprisingly, this has not happened yet. The total imports for the first half of 2025 are still somewhat above the value of last year. The main reason for this low impact of the tariffs on imports might be the fact that, as documented here, average tariffs have so far remained much below the very high values announced in early April.
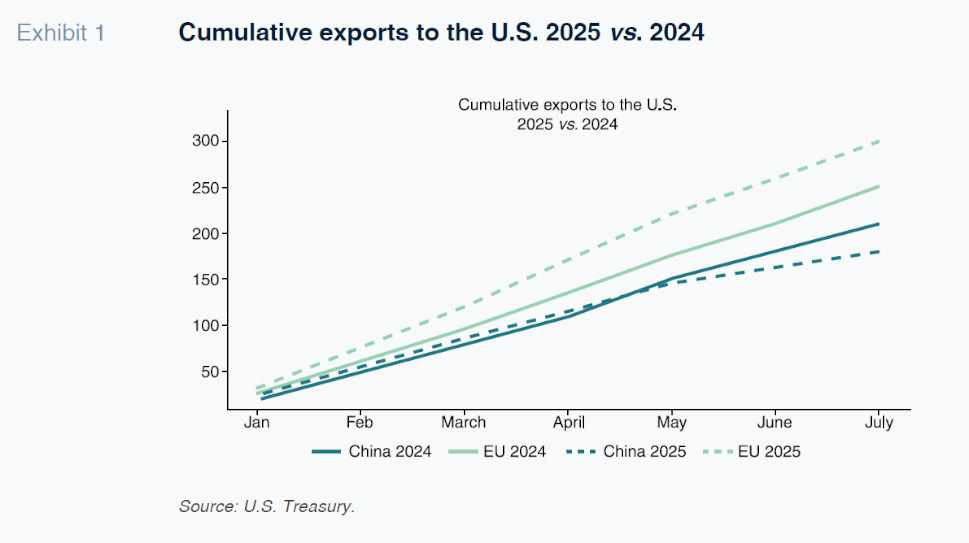
However, the differences across countries are much larger than the average (average around 10%, but China close to 40% against EU below 10%). One would thus expect that there should be substantial shifts in market shares, even given mostly unchanged imports. This is indeed what one observes for China, whose share in U.S. imports has dropped considerably, (from around 14% to 7%), whereas that of the EU has remained roughly constant at 14%. Exhibit 1 below shows the evolution of the divergence in cumulative exports to the U.S. by the EU and China.
Conclusions
The impact of Trump’s tariff war has so far been rather limited. U.S. imports seem rather stable, except for those from China. The main reason for this limited impact is that average tariff rates have remained below 10% for most countries (but close to 40% for China). Policymakers and media have focused attention on the products with high tariffs. But they are of limited overall importance if one uses the data on tariff revenue collected as proposed here.
Exports to the U.S. amount to about 2.8% of EU GDP. A sharp drop in these exports could thus have had a significant impact on the European economy. However, this has not happened. Exports to the U.S. have been higher by about 40 billion euro during the first half of this year relative to the same period of 2024, imparting a small positive boost to the otherwise sluggish EU economy. However, Chinese exports to the U.S. have fallen by about 20 billion USD. The wide-spread notion that the U.S. has gone soft on China and has hit its allies particularly hard is thus not borne out by the data. All in all, it seems that apart from distribution of market shares, Trump’s tariffs have been remarkably ineffective.
Notes
Many estimates combine past import data with announced rates to calculate the average tariff rate. But both elements lead to overestimates. The July estimate of the Yale budget lab arrives at an estimate of an average tariff of around 17% although it also contains a chart with customs revenues as a percentage of imports that would have suggested a much lower value. https://budgetlab.yale.edu/research/state-us-tariffs-july-23-2025
On the economic consequences of Smoot Hawley see Gros (2025b).
References
Daniel Gros. IEP Bocconi