
Spain’s corporate sector: Strong deleveraging, persistent divergence
Spanish corporations have undergone a sharp deleveraging in the last decade, leaving aggregate indebtedness below the EU and eurozone averages. However, behind this aggregate figure lie significant differences by company size, sector, and region.
Abstract: Spanish corporations have reduced their leverage substantially over the past decade, leaving the aggregate debt-to-GDP and debt-to-profitability ratios below the EU and eurozone averages. Indeed, between 2015 and 2024, the ratio of Spanish corporations’ debt to GDP decreased by 25.8pp to 63.6%, which is 9.5pp below the eurozone average. This adjustment is also reflected in the decline in the debt-to-net assets ratio, which fell to 34.9% in 2023, its lowest level in almost a decade. Yet, such progress masks significant variation across firms and regions. Larger enterprises remain far more indebted than smaller firms, and leverage is highest in capital-intensive sectors, such as utilities and communications, compared with lower levels in activities like mining or agriculture. Construction and real estate also stand out for the sharp deleveraging they have undergone since the financial crisis. By region, Asturias shows the highest leverage (42.5%), more than twice Galicia’s low of 16.2%. These divergences reflect variations in economic structure, firm size distribution, and profitability. Overall, Spain’s corporate sector is on firmer financial ground, but leverage remains concentrated in certain types of firms and regions.
Foreword
Corporations finance a portion of their investments and growth by taking on borrowings, in the form of fixed income securities or loans. In this sense, the use of debt should not be seen as a negative. However, excessive indebtedness leaves corporations vulnerable to external shocks, such as an increase in borrowing costs or cyclical downturn eroding their sales and, by extension, their ability to service their debt. When borrowings are too onerous, the ability to honour payment commitments narrows, as does the capacity to tackle unforeseen developments (as a result of impaired solvency), as well as undermining borrowers’ image and credibility vis-a-vis creditors and customers.
These negative aspects of surplus indebtedness were manifest in the credit bubbles of the past, which fuelled excessive borrowings on the part of corporations (and households). When those bubbles burst, large-scale economic crises are unleashed. This bubble bursting has been observed in many countries, Spain being no exception, as we saw with the financial crisis of 2008, which unleashed significant wealth and job destruction. That is why it is so important to monitor the trend in leverage ratios, including in the public sector.
As shown in this paper, the excessive leverage levels of the recent past (when a real estate and credit bubble formed) have been left behind in the private sector. Public and private debt dynamics have different origins (the public deficit in the case of the public sector). Our focus in this paper is on corporate debt, specifically that of private sector non-financial corporations.
The value added by this paper is primarily to analyse the considerable differences that exist in the debt ratio
[1] across the Spanish corporate ecosystem along several dimensions: sector of activity, company size and region. We will see how the aggregates mask substantial differences along all three of the dimensions analysed.
This analysis is possible thanks to the very recent publication of a new database by the Bank of Spain, namely BExplora,
[2] which contains, among other statistics, the debt ratio (debt/net assets) over a considerable timeframe, the most recent data dating to 2023. Thanks to those figures, in this paper we provide an analysis by sector, company size and region.
To that end, this paper is structured as follows: Firstly, we analyse Spain in the European context in terms of the ratio of corporate debt to GDP, which reveals intense deleveraging in Spain to leave this metric below the European average. Next, we focus on the sustainability of Spanish corporate debt by comparing the ratio of debt to gross operating surplus, again at the European level. In the following sections, we turn to the Spanish corporations’ debt/net assets ratios, analysing the trend in this metric over time, by company size, sector of activity and region. The paper closes with a few conclusions.
Corporate indebtedness: Spain in the European context
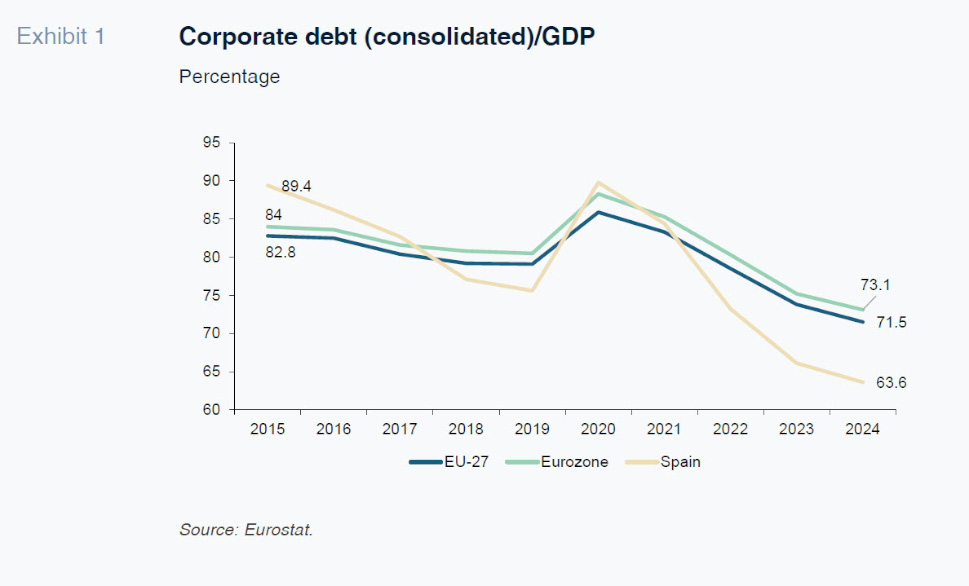
As shown in Exhibit 1, Spain’s corporations have deleveraged intensely in the last decade. Whereas in 2015 the ratio of (consolidated) debt/GDP [3] in the Spanish non-financial corporation sector was 6.6 percentage points (pp) above the EU-27 average (89.4% vs. 82.8%), by the end of 2024, it was 7.9pp below that average (at 63.6%, 9.5pp below the eurozone average). Spain converged with the European average in 2017 and since then (with the exception of the year of the pandemic, when GDP collapsed), it has been stretching away from that benchmark, recording a maximum gap in 2024. Indeed, between 2015 and 2024, the sector deleveraged by 25.8pp in Spain, which is more than twice the drop in this ratio in the EU-27 (11.3pp) or the eurozone (10.9pp). In 2024, Spain ranked tenth on the ranking (from least to most leveraged) in terms of sector debt/GDP in the EU-27, which runs the gamut from a maximum of 278% in Luxembourg to a minimum of 27.6% in Romania. Compared to the largest eurozone economies, sector leverage stands at 59.1% in Germany, 90.9% in France and 55.9% in Italy.
The sharp drop in corporate indebtedness in Spain is mirrored in the trend in the stock of outstanding bank credit to the resident private sector (which also includes the credit extended to households), which is down sharply from the high recorded at the end of 2008. Specifically, that stock has contracted by 36% from that maximum reading (as of April 2025, the latest data available). In the case of corporate credit, the contraction from the maximum value is even bigger, at 47%, which means that the current outstanding stock is nearly half the size it was 15 years ago.
Debt sustainability
Although it is common to use the debt/GDP ratio to analyse indebtedness, this ratio should be interpreted with caution as it does not contrast the corporations’ debt with their ability to repay it. As a result, the most rigorous indicator of debt sustainability is the ratio of debt to gross operating surplus (GOS), as the latter represents the income a company has for servicing its debt.
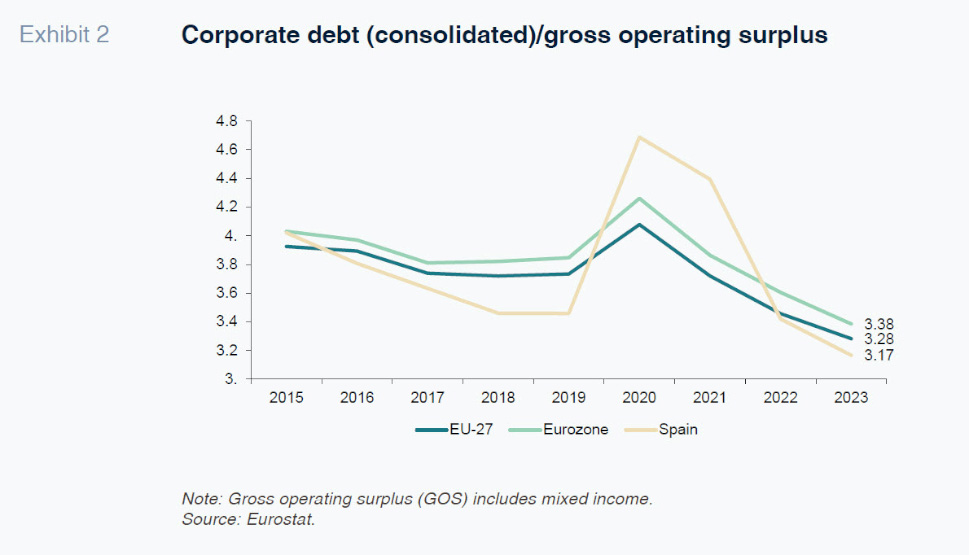
As shown in Exhibit 2, the downward trend in the debt sustainability indicator was truncated in 2020, when corporate profits collapsed as a result of the pandemic, which they did far more intensely in Spain than in the EU-27/eurozone. The downward trend resumed in 2021 to put this ratio at 3.17 in Spain by 2023 (last year available), below both the EU-27 average of 3.28 and the eurozone average of 3.38. This reading is higher than the equivalent values in Italy (2.58) and Germany (2.59), but better than the figures for France (3.36) and Portugal (4.95). This figure tells us, using the 2023 figures, that it would take a little more than three years of gross profits to repay the Spanish corporations’ debt.
Corporate leverage in Spain
The third indicator of corporate leverage is the debt/net assets ratio. The Bank of Spain recently started to publish this indicator in its BExplora database, providing statistics from 2008 to 2023 at the national, regional and provincial levels. It allows interesting decompositions, including by company size (micro, small, medium and large) and by sector (14 in total).
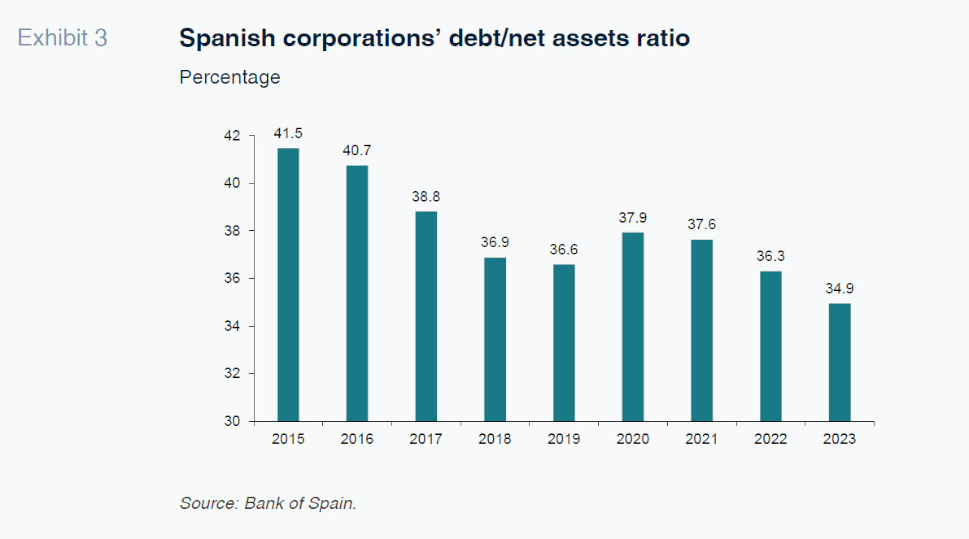
As depicted in Exhibit 3, the deleveraging already observed using the debt/GDP ratio is also evident when looking at the weight of debt relative to corporate net assets. Specifically, it has fallen from 41.5% in 2015 to 34.9% in 2023 (last year available), implying a 6.6pp drop in eight years: once again the year of the pandemic proved an exception, with the downtrend continuing thereafter to leave this metric at a low in 2023. Capitalisation is the flip side of the leverage coin: in the years analysed (almost a decade), the Spanish corporate sector’s solvency has improved, signalling strength and reduced vulnerability
vis-a-vis future crises or rate hikes.
Leverage and company size
These average leverage ratios mask considerable differences by company size. Using the most recent data, which date to 2023, it is the micro enterprises (fewer than 10 employees) which present the lowest leverage, at 22.6%, compared to 39.3% for the largest enterprises (more than 200 employees). The debt ratio rises in line with company size: to 24.2% in the case of small enterprises, 29.2% for the medium-sized enterprises; and as already noted, 39.3% among the largest firms. The biggest jump is observed in this last cohort, where the ratio is 10pp higher than the next smallest company size category (medium-sized). This pattern of increasing leverage in tandem with company size is reproduced across the majority of productive sectors.
Going back in time to quantify the intensity of the deleveraging effort, the biggest improvement in capitalisation is observed among the micro enterprises, whose debt/net assets ratio has been cut by 13pp, well above the 7.6pp of deleveraging etched out by the large enterprises. Therefore, while there is a positive correlation between company size and leverage, there is a negative correlation with size in the intensity of the deleveraging undertaken since 2015.
Sectoral differences in corporate leverage ratios
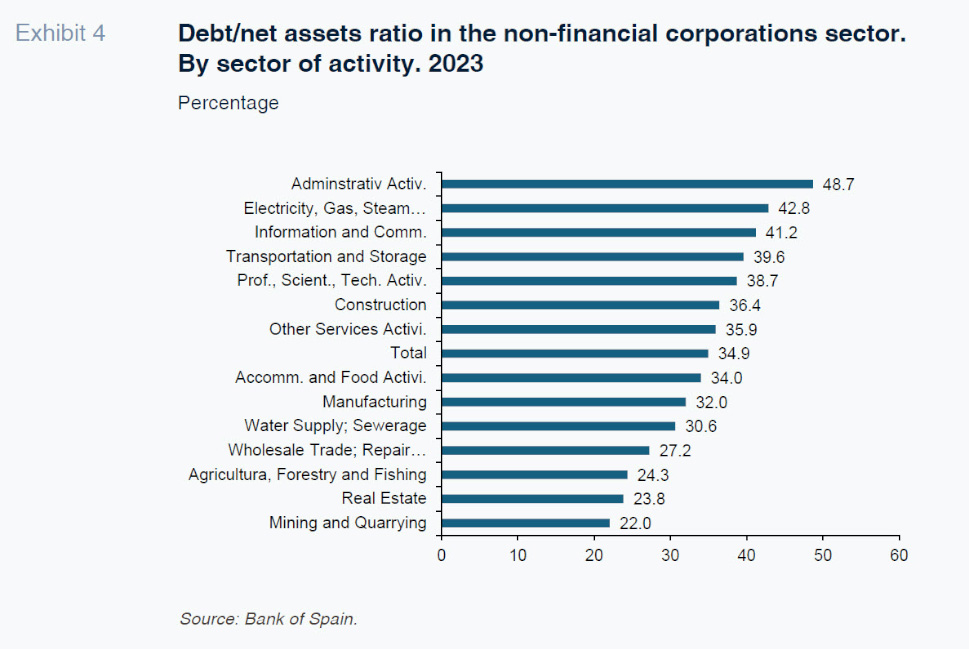
The wealth of information offered by the Bank of Spain’s new database allows us to analyse differences in the debt ratio by sector of activity, which, as shown in Exhibit 4, vary significantly using the 2023 data. The Administrative sector presents the highest leverage ratio, at 48.7%, followed by the utility sector (42.8%). Those figures contrast with numbers of around or below 25% in agriculture, forestry and fishing (24.3%), mining and quarrying (22%) and real estate activities (23.8%). The leverage ratio fell in all sectors between 2015 and 2023 except for administrative activities, the information and communication sector and the utility sector.
The sharp deleveraging etched out by the construction (-16pp) and real estate (-14pp) sectors stands out. Looking back even further in time to when the real estate bubble burst in 2008, the construction sector presented a leverage ratio of 56.8%, so that it has shed nearly 21pp of indebtedness in the interim. These figures are mirrored in the trend in the volume of credit extended by the Spanish banks to the players in these two sectors of the economy. From the highs around the time of that bubble (September 2008 in construction and July 2009 in real estate), the stock of outstanding credit extended to these sectors has contracted by 84% in construction and 78% in real estate activities. The volume of credit provided to these sectors at one point accounted for nearly half of all corporate credit, a share that has since fallen to 18%.
In interpreting these sector differences, it is important to consider the different levels of capital and labour they use. In capital intensive sectors it is logical to have to rely more on debt financing.
Regional differences in corporate leverage ratios
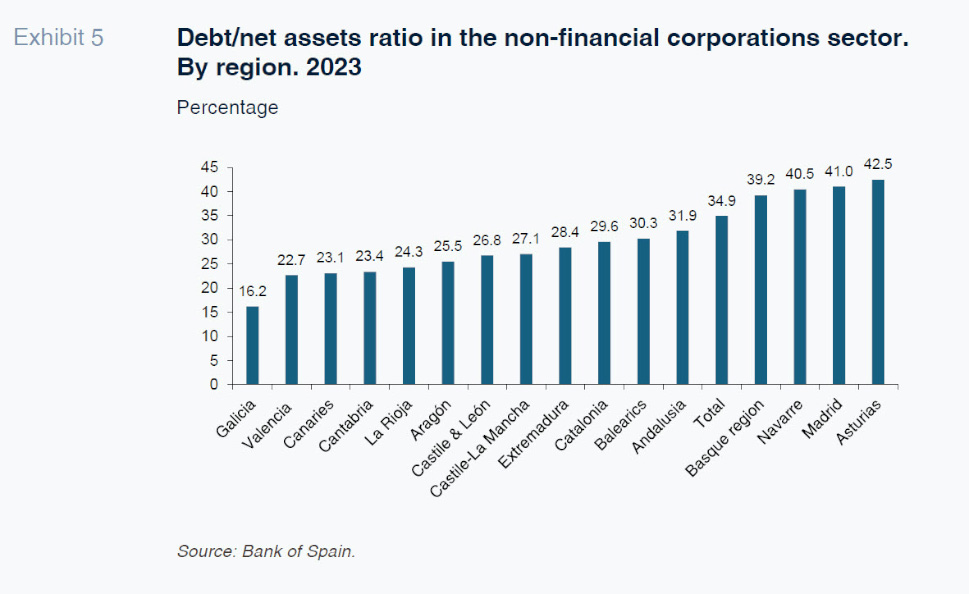
The regional breakdown similarly reveals considerable dispersion, with the highest value (42.5% in Asturias) more than two and a half times the lowest (16.2% in Galicia). Above the national average lie the Basque region, Navarre, Madrid and Asturias, while Valencia, the Canaries, Cantabria and La Rioja, in addition to Galicia, lie below the 25% mark.
These sizeable regional differences may be attributable to several factors, including the productive structure of their economies (given the significant differences observed in leverage levels by sector), the breakdown of their corporate ecosystems by company size (the larger the enterprises, the higher the blended leverage ratio) and the profitability of their companies (the more profitable, the less indebted), among others.
Conclusions
The wealth of information analysed signals the importance of company size and sector of activity in explaining the difference in Spanish corporations’ debt/net assets ratios. There is a clearly positive correlation between size and indebtedness, influenced by the smaller companies’ greater reliance on bank credit as a source of financing, in contrast to the large enterprises, which can tap the debt markets directly. The higher indebtedness of the large corporations leaves them more vulnerable to external shocks (such as rate increases), although their reduced dependence on bank debt tends to play in their favour, as this is the segment that tends to become tightest in episodes of financial crisis.
Sector-wise, the results reveal significant differences, partially explained by the idiosyncratic characteristics of each sector (such as differences in the use of capital versus labour, translating into higher or lower financing requirements), in addition to access to bank credit. In nearly all sectors for which there is information, the leverage ratio has come down, with the deleveraging undertaken in the construction and real estate sectors standing out.
The importance of company size and sector in explaining corporate leverage ratios likewise explains the differences observed across the various regions of Spain, where the ratio in the region with the highest reading (Asturias) is 2.6 times above that of the region with the lowest debt/net assets ratio (Galicia).
At any rate, notwithstanding the differences observed by sector, company size and region, the effort made by Spain’s corporations to deleverage in recent years is remarkable. It has left the non-financial sector’s debt/GDP ratio below the EU-27 and eurozone averages since 2021, opening up a gap that has been widening since then to a maximum of 8pp in 2024. Thanks to this effort and the recovery in profitability in the wake of the pandemic, the corporations’ debt sustainability has improved, with the sector’s aggregate debt/GOS ratio likewise below the EU-27 and eurozone averages since 2022.
Notes
Debt ratio=(interest bearing borrowed funds)/(equity + interest bearing borrowed funds + adjustments to value the tangible fixed assets at market prices).
Corporate debt includes loans and debt securities and does not include borrowings from other corporations.
References
BANK OF SPAIN. (2024). BExplora: A new statistical tool with corporate information by Spanish region and province.
Joaquín Maudos. Professor of Economic Analysis at the University of Valencia, Deputy Director of Research at Ivie and collaborator with CUNEF