
Paradoxical stress test results: Banking resilience amid rising uncertainty
The 2025 stress tests by the Fed and EBA revealed stronger-than-expected resilience, despite harsher adverse scenarios. Improved profitability and net interest margins drove smaller capital depletion, challenging conventional expectations.
Abstract: The 2025 stress tests conducted in the U.S. and Europe produced paradoxically positive results: banks proved more resilient than in previous rounds despite tougher adverse scenarios. U.S. banks absorbed projected losses of $550 billion, but aggregate CET1 ratios only fell from 13.4% to 11.6%, a smaller drop than in recent years. Similarly, European banks faced €547 billion in hypothetical losses, yet capital depletion was just 3.7 percentage points, the smallest since 2014. The main factor behind this resilience is improved profitability, particularly higher net interest margins, which have strengthened banks’ ability to generate capital organically. These results emphasize the sector’s progress in building buffers since the financial crisis, but they also raise questions about whether the tests fully capture emerging risks. Supervisors are already preparing adjustments, including scenarios that integrate geopolitical shocks more explicitly. This paradox points to both the improved health of the banking sector and the continued need for vigilance in an era of heightened uncertainty.
Introduction
During the first half of the year, the supervisory authorities in Europe and the U.S. each carried out stress tests to measure their banks’ resilience in the event of episodes of economic crisis in an environment marked by geopolitical uncertainty and trade tensions. The great paradox emanating from the tests carried out this year is that the results were considerably better than might be expected for the current climate of uncertainty. This is due to the financial health of the banks following three years of excellent earnings results and prudent recapitalisation, as well as significant resilience in response to the quantitative scenarios modelled, despite the backdrop of heightened uncertainty.
Given the paradox, it is not surprising to see the supervisors layering in certain complementary adjustments to their quantitative scenarios and testing methodology. In that way they are fine-tuning their tests, making them suitable for more unpredictable environments, albeit requiring the banks to address far greater complexity in drawing up their projections. This paper analyses the most recent round of stress tests, contrasting the approaches taken by the Fed and the ECB. We also compare these latests tests to earlier rounds, focusing on the complementary adjustments to the conventional scenarios and methodologies.
Timeline of the stress tests in Europe and the U.S.
Recent completion of the bank stress tests in Europe and the U.S. opens up a period of reflection until the start of the next set of tests in which to apply what the banking sector and supervisors have learned from the most important barometer of the sector’s health.
In initially creating these tests, the supervisors’ priority was to identify the entities who could be decapitalised, and could therefore fail, in the event of highly adverse yet highly improbable events, such as those triggered by the collapse of Lehman Brothers in September 2008. The original formula was conceived of as a “pass or fail” test and allowed the market to interpret the results as a leading indicator of the viability of each of the entities tested.
The tests quickly evolved in an attempt to minimise stigma around the banks more exposed to capital depletion in the most adverse scenarios, creating a sort of self-fulfilling prophecy, but also, in parallel, to prevent manipulation of the methodologies by the banks subject to testing which, logically, were keen to be seen to outperform their competitors.
This transformation, undertaken by the supervisors on both sides of the Atlantic, consisted of designing formula intended to support calculation of the minimum capital requirements sought of banks. As a result, the supervisors began to demand higher capital requirements of entities posting weaker results in the most adverse scenarios, which were seen as signalling the relative fragility of those banks’ businesses and, ultimately, exposure to an inability to carry out their core function: lending money and capturing savings.
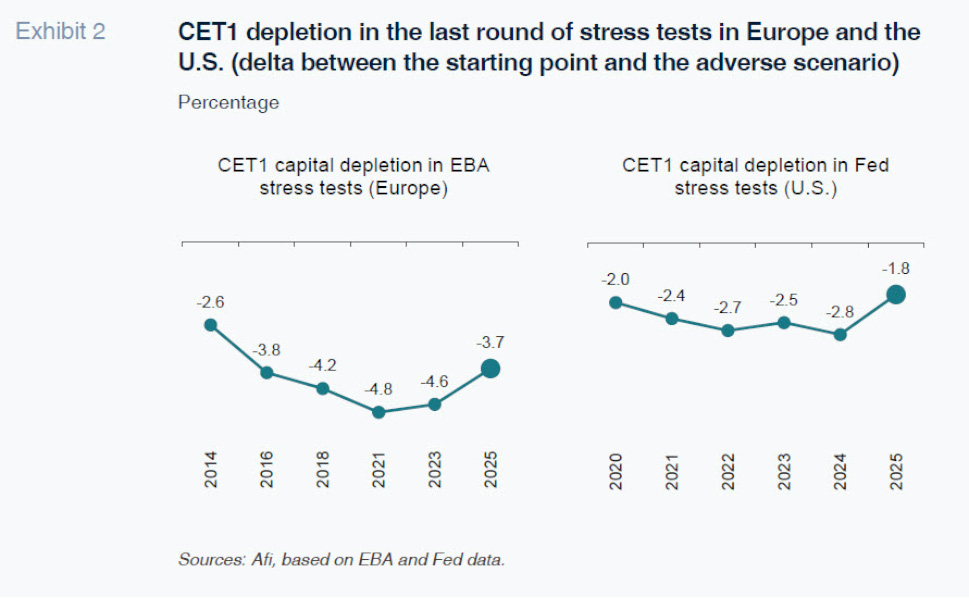
Framed by that approach, and underpinned by increasingly adverse macroeconomic and financial scenarios, the supervisors have been publishing the results of their successive and ever harsher stress tests. This shift has been particularly pronounced in Europe where the banks subjected to the tests have been reporting growing levels of capital depletion in the adverse scenario: between 2014 and 2023, the level of capital depletion reported in the adverse scenario has increased from 2.6 percentage points to 4.6 percentage points.
Nevertheless, the banking system has also been exhibiting increasingly strong Common Equity Tier 1 capital ratios (CET1) in the adverse scenario because they are more solvent today. In other words, although the banking supervisor is imposing an increasingly punishing “toll” in order to pass the stress tests, or perhaps precisely because it has been doing this, the banks have boosted their capital substantially, allowing them to weather the adverse scenarios modelled with more elbow room.
As shown in Exhibit 1, both the European and American banks have shored up their CET1 ratios on a sustained basis in recent years, especially in Europe, driven by increasingly less risky asset profiles.
[1]
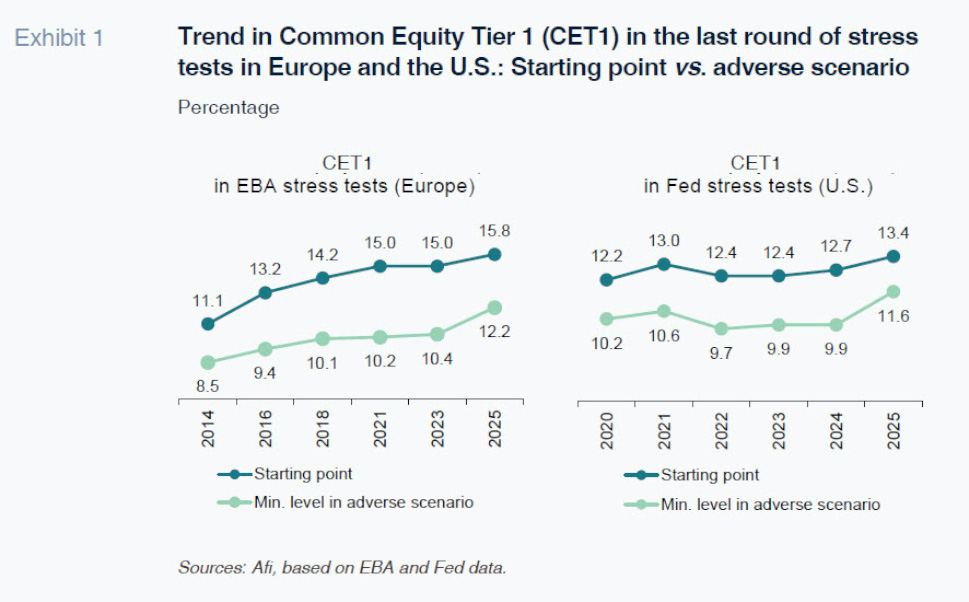
As a result, although the stress tests have been yielding higher capital depletion, capitalisation levels have likewise remained higher in the adverse scenarios.
Paradigm shift observed in the most recent stress tests
The trend outlined above was interrupted for the first time, and clearly so, in the tests conducted in both Europe and the U.S. in 2025 under the methodological definition and coordination of the European Banking Authority (EBA) and Federal Reserve (Fed), respectively. In this year’s tests, the level of capital depletion observed in the hypothetical adverse scenario was lower than in previous years, as depicted in Exhibit 2. The change of trend not only implies that the banks would surmount an episode of stress with more capital, but also that the impact of the scenario would be, for the first time in recent years, smaller.
The reason for the smaller degree of capital depletion, in contrast to what might be expected, would appear not to lie with the fact that the economic variables used to define the adverse scenario were more benign than those used in earlier tests. As shown in Exhibit 3, the level of GDP contraction, the main economic indicator used to ‘stress’ the scenario, was not smaller in 2025 than was modelled in previous rounds.
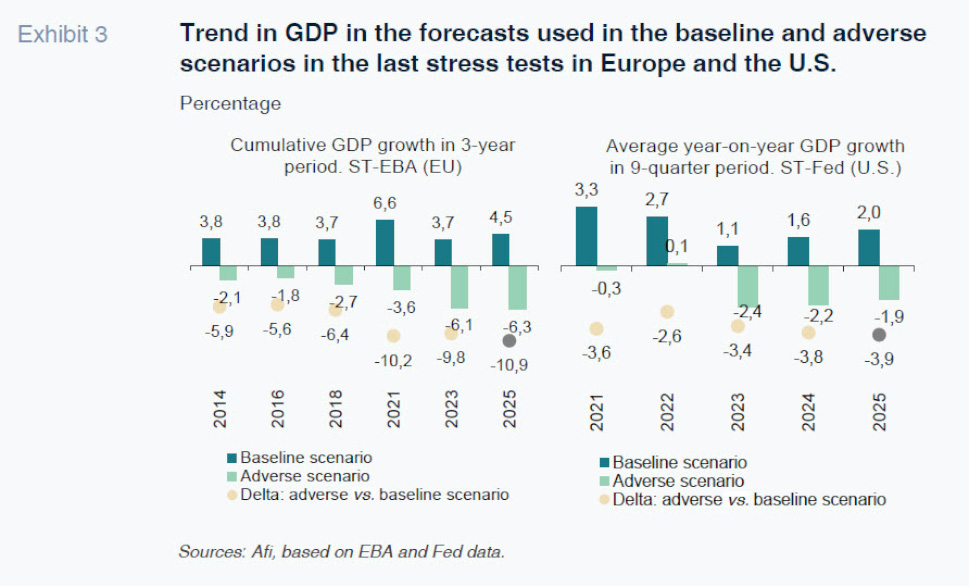
In contrast, the modelling of emerging risks, particularly the exacerbation of geopolitical tensions, meant that the adverse scenarios designed by the EBA and the Fed were the toughest in recent years in terms of the delta between the growth anticipated in the baseline versus the adverse scenario, which is consistent with an environment marked by heightened uncertainty.
It is therefore necessary to analyse the results more closely in order to understand the banks’ better performance in the 2025 tests and their improved resilience in the face of these tougher scenarios:
Results of the Fed’s 2025 stress tests
In the U.S., the 22 large banks tested would have to absorb hypothetical losses of over 550 billion dollars in the “severely adverse” scenario.
Those losses would translate into a reduction in the aggregate CET1 capital ratio from the 13.4% recorded in the fourth quarter of 2024, the starting point for the tests, to a low of 11.6%, before rising to 12.7% by the end of the projection. This paradox points to both the improved health of the banking sector and the continued need for vigilance in an era of heightened uncertainty.
The CET1 capital ratios of all of the banks tested would remain above the minimum levels required by the regulators throughout the entire projection horizon.
The Fed cites several factors to explain the smaller reduction in CET1 in this year’s tests (-1.8pp) compared to that observed in recent rounds. Among the various factors, the most important is related with significantly higher pre-provision net revenue (PPNR), essentially as a result of the banks’ prevailing profitability levels, coupled with the use of top down models that are sensitive to recent data.
The Fed notes that in the last year, the banks’ profitability has improved, largely thanks to capital markets activity and sustained strength in net interest margins, translating into better organic capital accretion during the nine quarters covered by the tests.
Another three factors of less significance help explain why the U.S. banks fared better in the last round of stress tests:
- Lower loan losses as a result of a slightly less adverse scenario given the countercyclical design of the hypothetical scenario: in 2024, the U.S. economy registered a mild slowdown; consequently, the odd macroeconomic variable, such as the unemployment rate, registered slightly better performances over the projection horizon.
- A new treatment for private equity investments: Until the latest edition of the stress test, their impact was recorded as part of the global market shock component (more punishing), while in the 2025 test, losses on these exposures are projected under the severely adverse macroeconomic scenario (considered managed as long-term investments, as banking book positions).
- The inclusion of atypical results in the trading portfolio driven by the improved starting positions of the entities subject to the exercise with 2024 year-end information.
Results of the EBA’s 2025 stress tests
The 64 large banks [2] tested in Europe would have to absorb hypothetical losses of over 547 billion euros in the adverse scenario.
Despite the higher impact of the losses for credit, market and operational risk in absolute terms for the overall European sample (547 billion euros) compared to the 2023 tests (496 billion euros), the impact on capital (depletion of 3.7pp) is smaller than estimated in the 2023 tests (-4.6pp).
The main reason for the improvement observed in this year’s tests (the smallest level of capital depletion since they were launched in 2014) is the banks’ improved ability to generate profits in an environment of structurally high rates, so that net interest margins make a bigger contribution to organic capital generation.
Under the EBA methodology, the net interest margin projected in the adverse scenario cannot at any time exceed that recorded in the year previous to the starting point. Since the European banks’ net interest margin (NII/RWA) went from 3.5 percentage points in 2022 to 4.1 percentage points in 2024, the maximum amount of net interest income they can contribute to capital increased from 10.5 percentage points in 2023 to 12.3 percentage points in 2025.
[3]
As shown in Exhibit 4, capital depletion for the European banks as a whole decreased by 89 basis points between the 2023 and 2025 tests, while the contribution by the net interest margin to capital increased by 110 basis points. In short, the net interest margin is one of the sources of income to have performed best in the decomposition of capital compared to the 2023 tests, along with other sources of income and expenses, the latter positively affected by smaller contributions to deposit guarantee schemes and the single resolution fund in 2024.
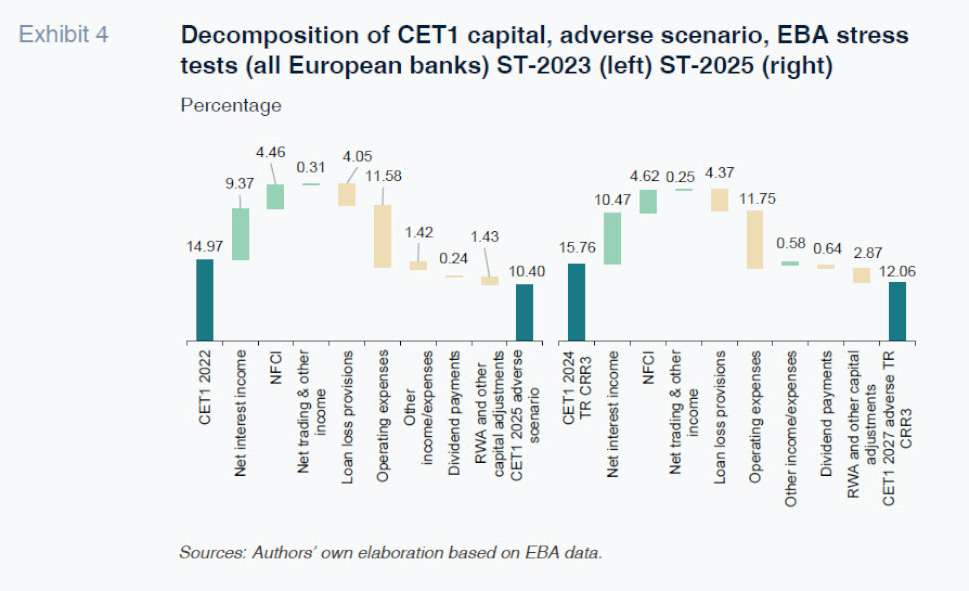
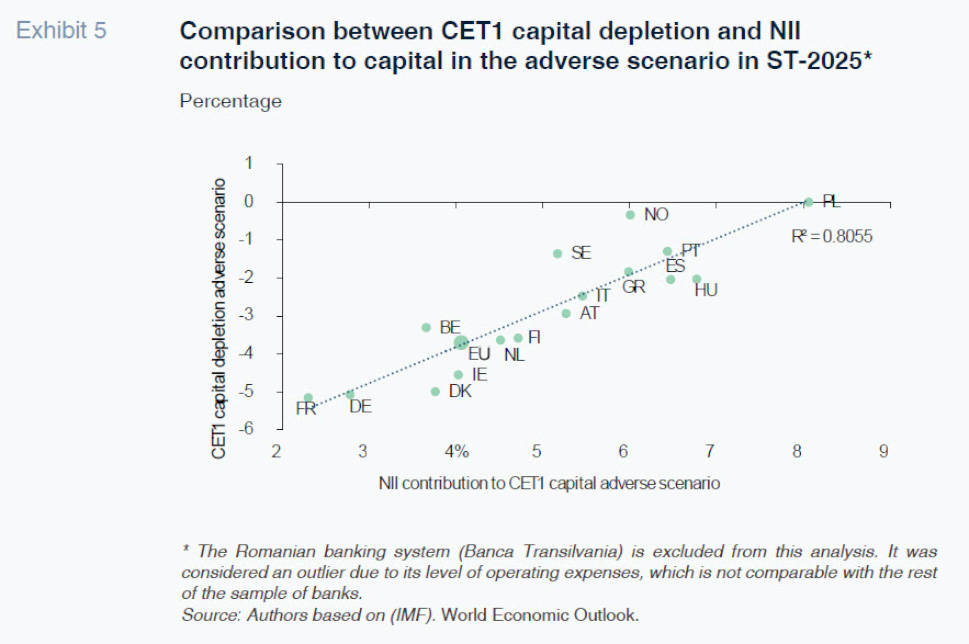
This reveals that the improvement in margins, despite considerable differences across the different banks, is responsible for the banks’ higher organic capital accretion and, in sum, greater ability to absorb the potential losses derived from a hypothetical episode of stress. As shown in Exhibit 5, the banking systems that generate more capital via their net interest margins,
i.e., those that are more profitable during an episode of stress, are also the most resilient in terms of capital depletion in the adverse scenario.
The supervisors’ response so as to preserve capital requirements for financial stability purposes
As identified in the last section, the key factor explaining the paradigm shift in the stress test results is the improvement in the banks’ profitability in recent years due to the uptick in interest rates and their impact on their net interest margins.
Despite methodological differences, the Fed and ECB/EBA supervisors use recent data to underpin their statistical forecasting models, which yields better results when the banks have performed better of late:
- In the U.S., framed by a top-down approach which prioritises the use of a single model for all of the banks, developed by the Fed itself, fed by information provided by the banks themselves.
- In Europe, taking a bottom-up approach, in which the banks are asked to prepare their own projections on the basis of their accounting and regulatory reporting information for the prior year, albeit closely following the guidelines set by the regulator, which ultimately adjusts the projections if the estimates deviate from levels the supervisor views as reasonable.
Both approaches have been fine-tuned successively, justified by the supervisors by the need to better calibrate their models and capture new risk events that were not adequately covered by earlier methodologies. For example, in the spring of 2023, when some U.S. regional banks failed as a result of liquidity and interest rate risk, both the Fed and EBA carried out exploratory analyses to understand what impact a sharp increase in interest rates could have on unrealised losses on bond portfolios carried at amortised cost.
This time, in light of these surprisingly positive results, the supervisors have come up with proposals that could lead to more stringent tests or at least curtail flexibility around capital requirements.
Adjusting the Fed’s stress test results
In April 2025, the Fed’s Board of Governors proposed a new formula for assessing the results of the stress tests and their incorporation into the capital requirement in a bid to minimise volatility in minimum solvency requirements.
Under this new formula, the results of the stress tests for this year would be averaged with those of the 2024 tests to calculate the stress capital buffer required of each bank. As shown in Exhibit 1, if the 2024 and 2025 results are averaged, aggregate capital depletion would be 2.3 percentage points (instead of the 1.8pp gleaned from the results of the 2025 tests only).
The Fed Board has also expressed its interest in improving transparency around the stress test preparation process by disclosing and seeking public comment on the models used to determine hypothetical losses and revenues of banks under stress and the hypothetical scenarios used annually for the tests. With this new approach, the Board aims to better capture prevailing risks and improve the models’ performance in future rounds of testing.
The prospect of new risks in the ECB’s stress tests
The ECB has announced that the assessment of geopolitical risks, which is part of its supervisory roadmap for 2025-2027, will be accompanied by the development of scenario analysis and stress tests.
This assessment comes at a critical juncture for the European stress tests given the debate sparked within the EBA about the future of the tests and new obligations for the banks in terms of information gathering and methodology design, especially with respect to emerging risks, or “unknown-unknowns”.
Although the last two editions of the biennial stress tests have incorporated economic and financial scenarios based on geopolitical risk factors (Ukraine, Middle East, trade war), there is no cause-and-effect analysis of how geopolitics affects the banking business, and the supervisor is looking to the sector to be more specific. To this end, the ECB’s chief supervisor (Claudia Buch) told the European Parliament that in 2026, it will carry out stress tests focused specifically on geopolitical risks.
It is likely that for those tests, the ECB will ask the banks to assess specific geopolitical scenarios that could gravely affect their solvency. This would continue the work initiated in the stress tests carried out this year with the EBA.
Conclusions
The results of the stress tests carried out in 2025 by the Fed and the EBA reveal a paradigm shift in the assessment of the banks’ resilience. Despite harsher scenarios, the banks’ improved profitability, particularly their ability to generate net interest income, led to a smaller observed level of capital depletion. This phenomenon yielded stronger projected organic capital accretion, absorbing more potential losses and reinforcing banking system solvency.
However, this positive performance should not be seen as an ironclad guarantee. The growing complexity of the adverse scenarios – with the supervisors layering in emerging risks such as geopolitical risks, more stringent methodological frameworks and discretionary features – requires the banks to constantly and proactively monitor their strengths and weaknesses.
Against this backdrop, it is vital that the bank sector develop internal capabilities for anticipating and responding to changes in stress-testing. That means not only improving the quality of their projections but also systematically integrating the analysis of new risks into their internal models. Only in this manner will they preserve their essential role in the economy, ensuring financial stability and reinforcing the market’s confidence in a climate of growing uncertainty.
Notes
The solvency metrics prescribed by the Basel Banking Supervision Committee use eligible own funds (tier 1 equity and reserves) in the numerator and risk-weighted assets in the denominator. Therefore, a smaller volume of riskier assets or less risky profile of on-balance sheet investments, assuming equity remains stable, lifts their capital ratios.
Note that the EBA, responsible for designing the test methodology, only discloses the results for the largest banks in the European Union and Norway. The European Central Bank then adopts that methodology for all of the entities under its direct supervision in the Single Supervisory Mechanism (SSM), giving rise, in practice, to three groups of banks: (i) the banks that are included within the scope of publication by the EBA by virtue of being larger banks in the European Union as a whole and domiciled in countries belonging to the SSM (the significant institutions); (ii) banks that while significant in the SSM are not sufficiently large to participate in the EBA publication for which the ECB does, however, publish results by ranges; and (iii) the banks that are outside the ECB’s scope for which the EBA only publishes information by virtue of being domiciled in EU member states that do not belong to the SSM or Norway.
Since the banks cannot project a net interest margin higher than the starting point margin and the projection period covers three years, the maximum net interest income contribution they can aspire to is equivalent to NII/RWA x 3. In other words: 3.5pp x 3 = 10.5pp (ST-2023) and 4.1pp x 3 = 12.3pp (ST-2025) for the European banks as a whole.
Ángel Berges and Jesús Morales. Afi