
Spanish investment in R&D+I in the wake of the crisis: Public versus private sector*
While the expenditure trends in public and private sector R&D have historically moved in tandem in Spain, recent data indicate that the public sector has experienced a decline in R&D investment, while the private sector has increased its expenditure. As a result, Spain risks lagging behind the EU average in innovation, which is a key driver of economic growth, suggesting the need for a shift in Spanish public policy.
Abstract: This article examines the investment trends in research and development (R&D) in Spain, distinguishing between the public and private sectors and the corporate innovation drive since the onset of the financial crisis. The rate of growth in R&D expenditure by the private sector was higher in 2016 than in 2015. Of concern, however, is the fact that expenditure by the public sector went from expanding in 2015 to contracting in 2016. In fact, the crisis has had very different impacts on the four main eurozone economies in terms of investment in R&D. Whereas investment was scaled back very significantly in Spain, the other three economies continued to step up their expenditure on R&D. Spain is one of just three eurozone member states in the OECD to have invested less in R&D in 2016 than in 2008. As for budget execution by the general state administration, the percentage of the R&D budget actually executed began to plummet in 2008, dropping to a low of 30% in 2017 from nearly 90% in 2007. In the private sector, the number of enterprises that undertook technological innovation activities fell continuously between 2008 and 2016, such that the number of firms that were active in this field in 2016 was less than half (43%) that of 2008. As a result, it will be necessary to promote political support for R&D in Spain so as to effectively halt the divergence in innovation with the rest of the EU.
Introduction
Innovation is, by definition, as hard to measure as it is a far-reaching and continuous process. There appears to be some consensus to the effect that innovation is “any change (not just technological) based on knowledge (not just scientific) that generates value (not just economic)” (COTEC, 2018). It is also one of the most inclusive ways of achieving economic growth. The limits on the accumulation of knowledge are lower than the limits on the accumulation of resources that have historically underpinned economic growth, such as capital or land.
By convention, expenditure on R&D is taken as a proxy for innovation efforts. However, it is likely that this serves as a better proxy in the public sector than in the private sector. Private sector R&D is highly concentrated among a very small number of science- and technology-intensive sectors. As a result, there are enterprises that innovate without investing in R&D. Nevertheless, investment in R&D remains one of the main indicators used in the public policy arena in relation to innovation assessment and support.
Four years ago, in this same journal, it was concluded that “the current state of the Spanish research, development and innovation (R&D+I) system is worrisome. On the one hand, the main headline indicators, public and private, are in free fall. (...) On the other hand, on the policy and regulatory front, the Government’s real strategy appears to be resisting without introducing structural reforms that maximise the efficiency of the expenditure in a time of extremely scarce resources. The combination of these two factors leaves Spain not converging to the EU average R&D+I performance but rather deviating from it. (...) An immediate... change on both fronts −budget and reforms− is needed if Spain is to preserve the knowledge creation capacity that has been so costly to build in the past 20 years” (Xifré, 2014).
Against that backdrop, this article takes a look at the investment trend in research and development (R&D), distinguishing between the public and private sectors and the corporate innovation push since the onset of the crisis. In this analysis, unless stated to the contrary, the public sector includes the government and the university or higher-level education system, while the private sector refers to private business enterprises and private non-profit organisations.
Trends in R&D expenditure in Spain
According to the most recent data gleaned from Spain’s statistics office’s R&D Activities Survey, total R&D expenditure in Spain increased by 0.7% year-on-year in 2016. That growth was driven by an expansion in R&D expenditure by the private sector of 3%, which offset a 2% contraction in R&D undertaken by the public sector.
Due to the fact that Spain’s GDP growth in 2016 (+3.2%) outpaced that of R&D expenditure, R&D intensity (R&D expenditure/GDP) decreased from 1.32% in 2008 to 1.19% in 2016. That same year, R&D intensity in the EU28 held steady at 2.03% of GDP. As a result, the gap between the rate of EU and Spanish R&D intensity widened in 2016 (Table 1).
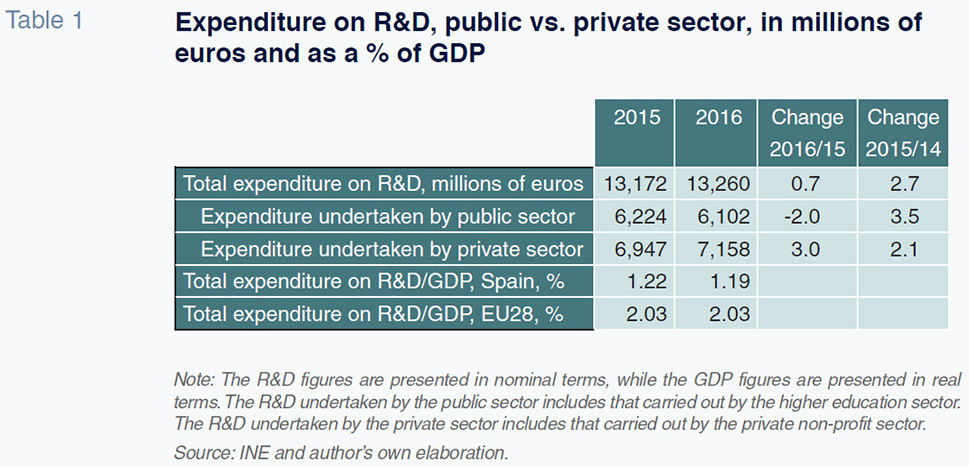
The rate of growth in expenditure by the private sector was higher in 2016 than in 2015. Of concern, however, is the fact that expenditure by the public sector went from expanding in 2015 to contracting in 2016.
With the exceptions of 2009 and 2010, which can be considered years of extraordinary adjustment, these two measures have historically trended in the same direction. Up until 2008, both measures registered growth, and between 2011 and 2014, both sustained declines. The 2015 numbers appeared to indicate that the period of a lack of progress in science and technological development was firmly behind Spain, as public and private R&D expenditure experienced renewed and simultaneous growth (Exhibit 1). The most recent figures, which date to 2016, cast doubts over that conclusion.
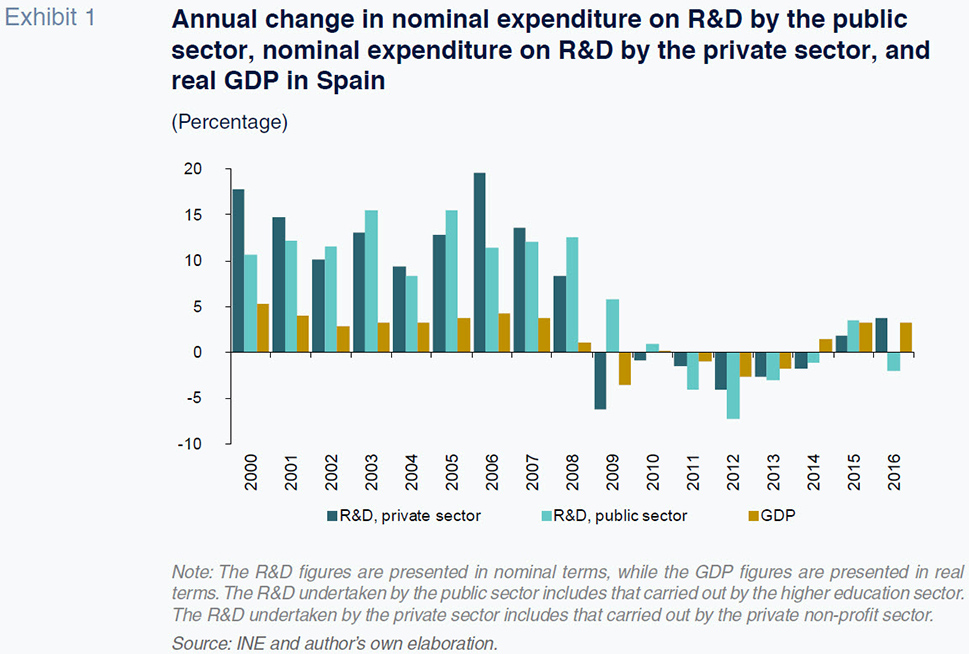
The decoupling of public and private R&D expenditure in 2016 could mark a very worrying shift in relation not only to the past but also compared to Spain’s peer economies.
International comparison
Exhibits 2.a and 2.b, respectively, depict these movements in R&D expenditure by the private and public sectors for Spain and the rest of the major eurozone economies (Germany, France and Italy) between 2001 and 2016.
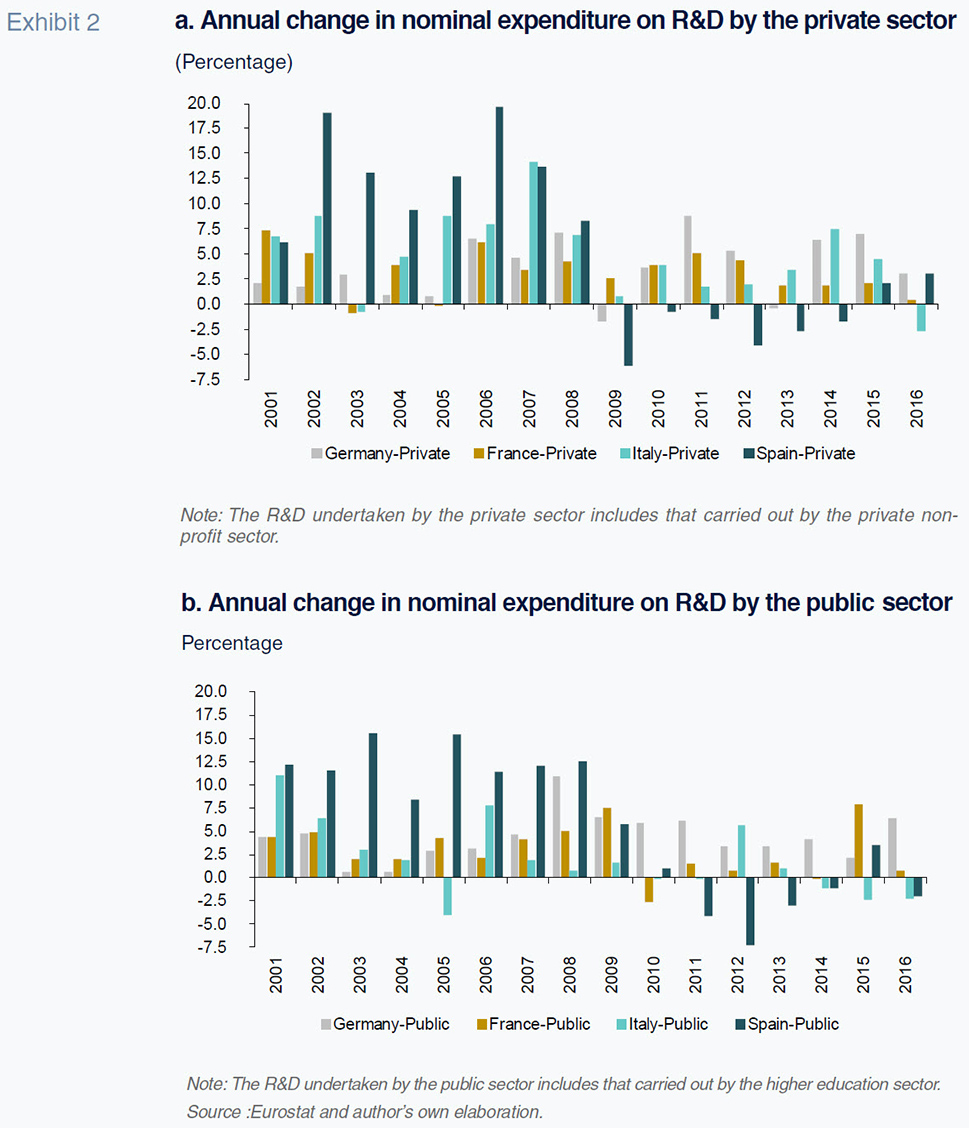
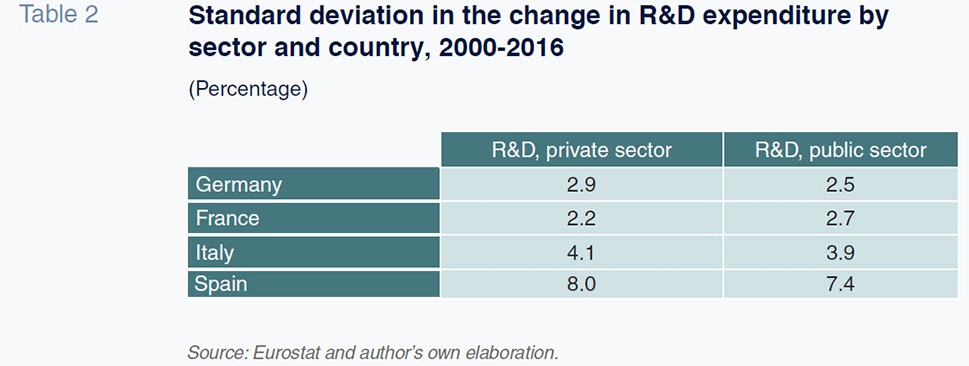
As the exhibits show, the trend in R&D expenditure in Spain has been more volatile in both the private and public arenas than in the three benchmark economies, displaying annual growth rates of as high as 15% or 20% when economic times were buoyant and significant contraction during episodes of crisis. Table 2 provides the standard deviations in the series and confirms that in Spain, the volatility in R&D expenditure for both the public and private sectors is double that of Italy and triple that observed in France and Germany.
In the case of private R&D expenditure, Spain was the only country among the four major EU economies to suffer a non-stop contraction in investment between 2009 and 2014. In contrast, during that same period, expenditure in France and Italy (except in 2016) increased continuously while in Germany expenditure contracted in 2013 and 2009, albeit by minimal amounts. As for the public sector R&D effort, the trend is similar in qualitative terms with some qualifications. The year in which the cuts began in Spain in the public sector (2011) came two years later than in the private sector (2009). Germany has continuously kept increasing public investment in R&D (even in crisis times) and France cut public investment only in 2010. The trend in Italy has deteriorated since 2014, with sustained public R&D cuts between 2014 and 2016. The crisis, therefore, has had a very different impact on R&D investment across the eurozone’s main economies. Whereas Spain experienced significant cuts, Germany and France continued to step up their investment in R&D in both the public and private sectors.
To round out the international comparison, Exhibits 3.a, 3.b and 3.c represent overall R&D intensity (the ratio of R&D expenditure over GDP) for Spain and the EU as well as private sector and public sector R&D expenditure for each respectively.
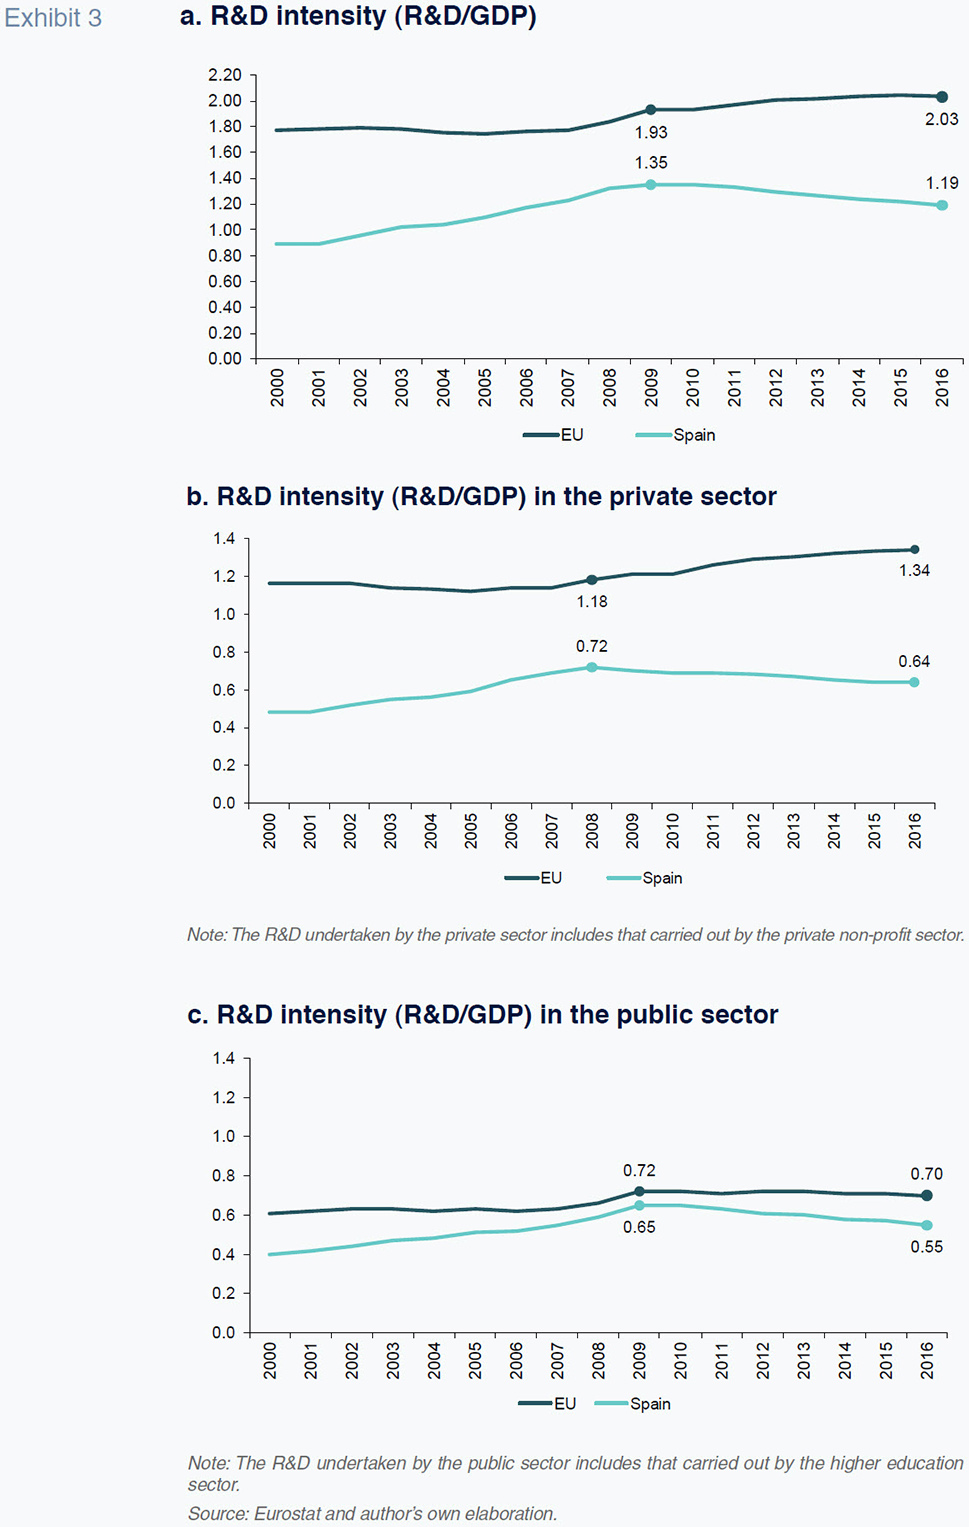
The three exhibits clearly show how Spain converged towards the EU average until 2010, at which time it began diverging. The convergence period was driven by the fact that growth in R&D expenditure was higher during those years in Spain than in the EU as a whole. The divergence after 2010 has been driven by a steady decline in R&D intensity in Spain, a drop that has been more pronounced in the public sector, while intensity continued to increase in the EU as a whole, particularly in the private sector.
The result is that Spain is one of just three eurozone states in the OECD to have invested less in R&D in 2016 than in 2008 (Table 3).
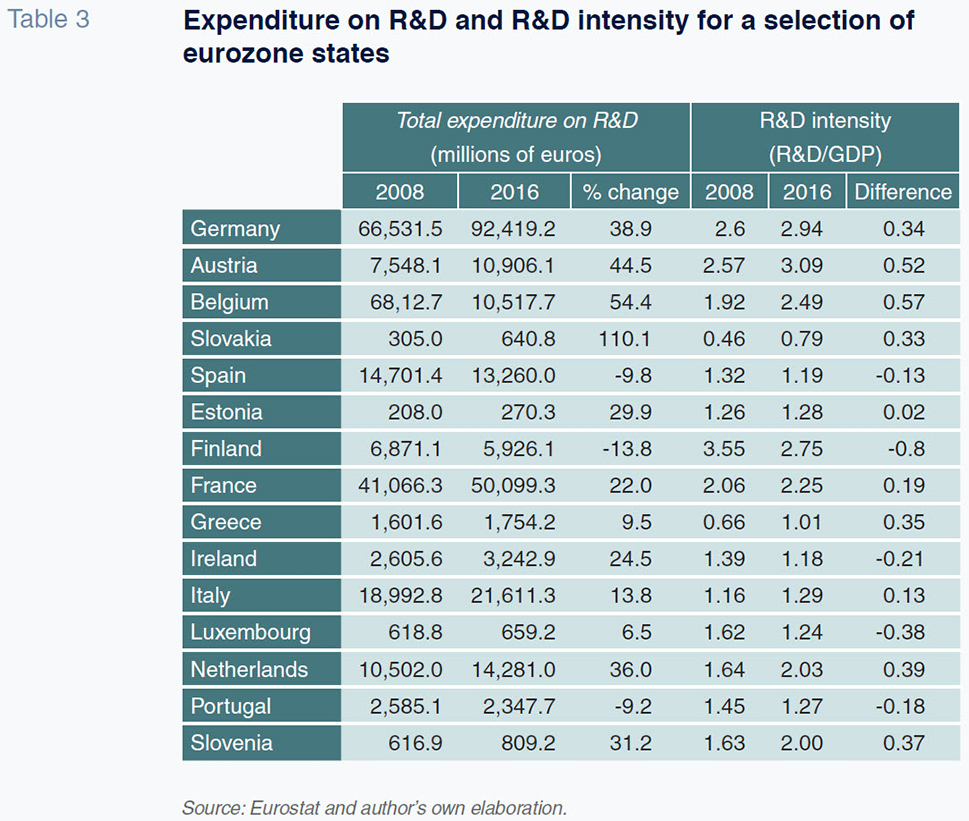
Between 2008 and 2016, R&D expenditure in Spain contracted by 9.8% in nominal terms (implying an even bigger reduction in real terms). One might initially assume that the decline was primarily the result of the economic crisis and the subsequent expense-cutting and fiscal austerity measures rolled out to tackle it. Nevertheless, this interpretation is undermined by the fact that the two countries which suffered similarly intense crises and were even brought under European Union Economic Adjustment Programmes (Greece and Ireland) increased their R&D expenditure during the same period (with growth of 9.5% and 24.5%, respectively). It would seem, therefore, that in the case of Spain, and indeed Portugal, the ground lost on the R&D intensity front cannot be exclusively attributed to the crisis and its fallout.
Lastly, we look at the international situation in terms of the breakdown of R&D expenditure by sector (Exhibit 4.a) and sources of financing (Exhibit 4.b) for Spain, the EU and the benchmark economies.
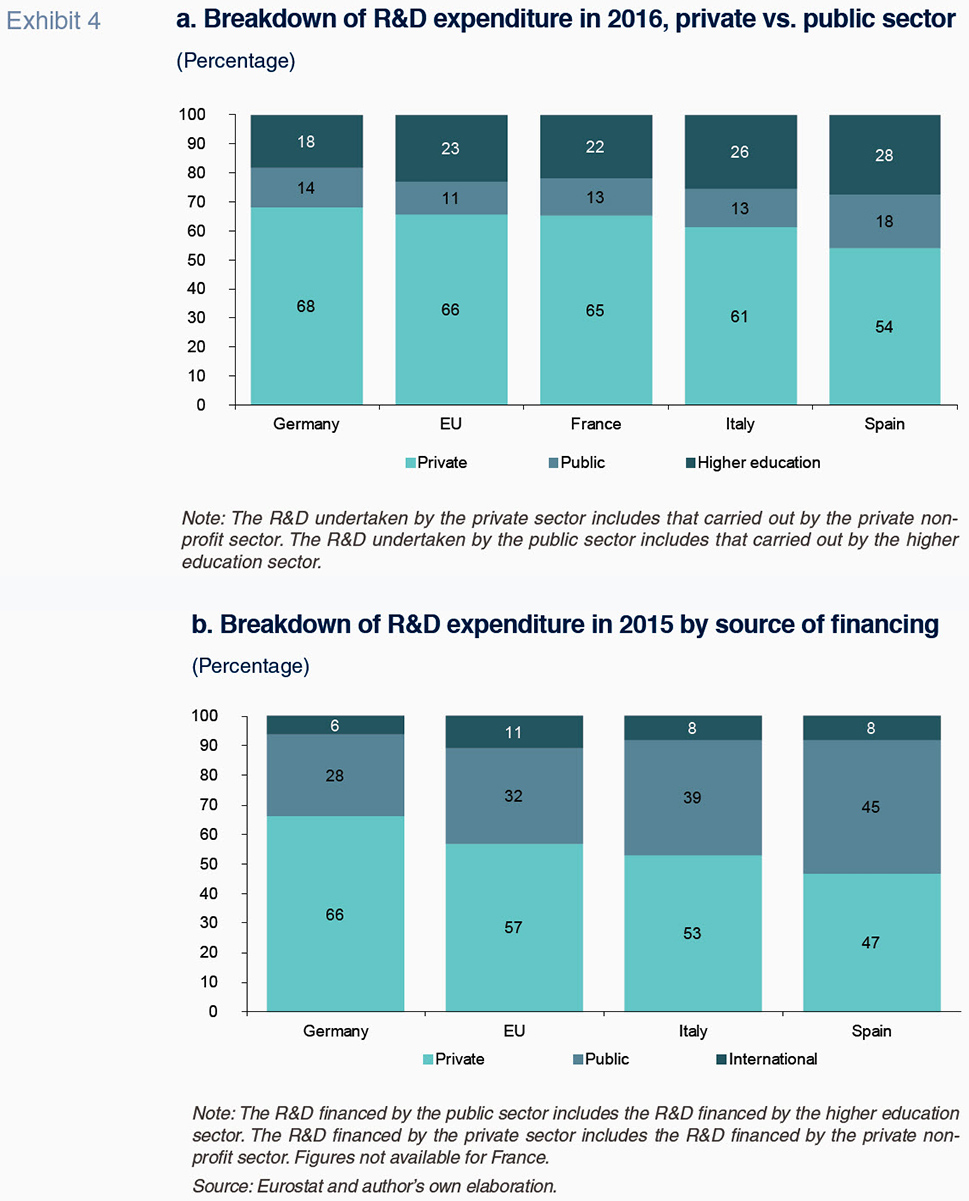
As the exhibits show, in terms of where the money is deployed and, more notably, where it comes from, the contribution by the private sector in Spain is around 10 percentage points below the EU average. In Spain, the amount of financing sourced from the national private sector is less than 50% (47%), while the EU recommends this ratio to be two-thirds of all R&D funding, as indeed is the case in Germany (Exhibit 4.b).
Two additional considerations
Execution of public R&D budgets
Using the data on budget execution compiled by the COTEC Foundation for Innovation, we next break down the state R&D budget (expenditure policy 46, “Research, Development and Innovation Expenditure Policy”) into two amounts: the budget executed and the budget not executed (defined as the difference between loans awarded and liabilities recognised).
Exhibit 5.a provides this breakdown for the general state administration, while Exhibit 5.b outlines these amounts for state agencies and other public institutions. Both exhibits show the rate of budget execution in the corresponding subsector of the public administration.

The picture painted by the exhibits tells a markedly different story in each subsector in terms of budget execution rates, irrespective of the size of the initial budgets (authorised loans).
In the case of state agencies and other public institutions (Exhibit 5.b), the level of budget execution held relatively steady at around 90% between 2000 and 2016 (the last year for which the data is available).
Conversely, in the general state administration, budget execution began to plummet in 2008, dropping to a low of 30% in 2017 (latest available figures) (Exhibit 5.a). In other words, the percentage of the public R&D budget actually implemented by the general state administration has been falling non-stop since 2008, and the amount executed in 2017 (1.38 billion euros) was 31% less than that of 2000 (2.01 billion euros). Note that both figures are expressed in nominal terms; if we were to factor in the increase in prices during the last 18 years, the decline in the R&D budget executed by the general state administration in real terms would be even greater.
Number of enterprises that carry out innovation activities
The following exhibits show the number of business enterprises that carry out innovation activities in Spain, distinguishing between those that undertake technological innovation activities (Exhibits 6.a and 6.b) and those that undertake non-technological activities (Exhibits 7.a and 7.b). The former includes “new technological products (goods and services) and processes and significant technological improvements in them”. The latter include “marketing and organisational” innovations. According to the methodology used to compile the
Business Enterprise Innovation Survey, “the variables related with the innovations implemented by the firms polled refer to the three-year period prior to that in which the survey is conducted”.
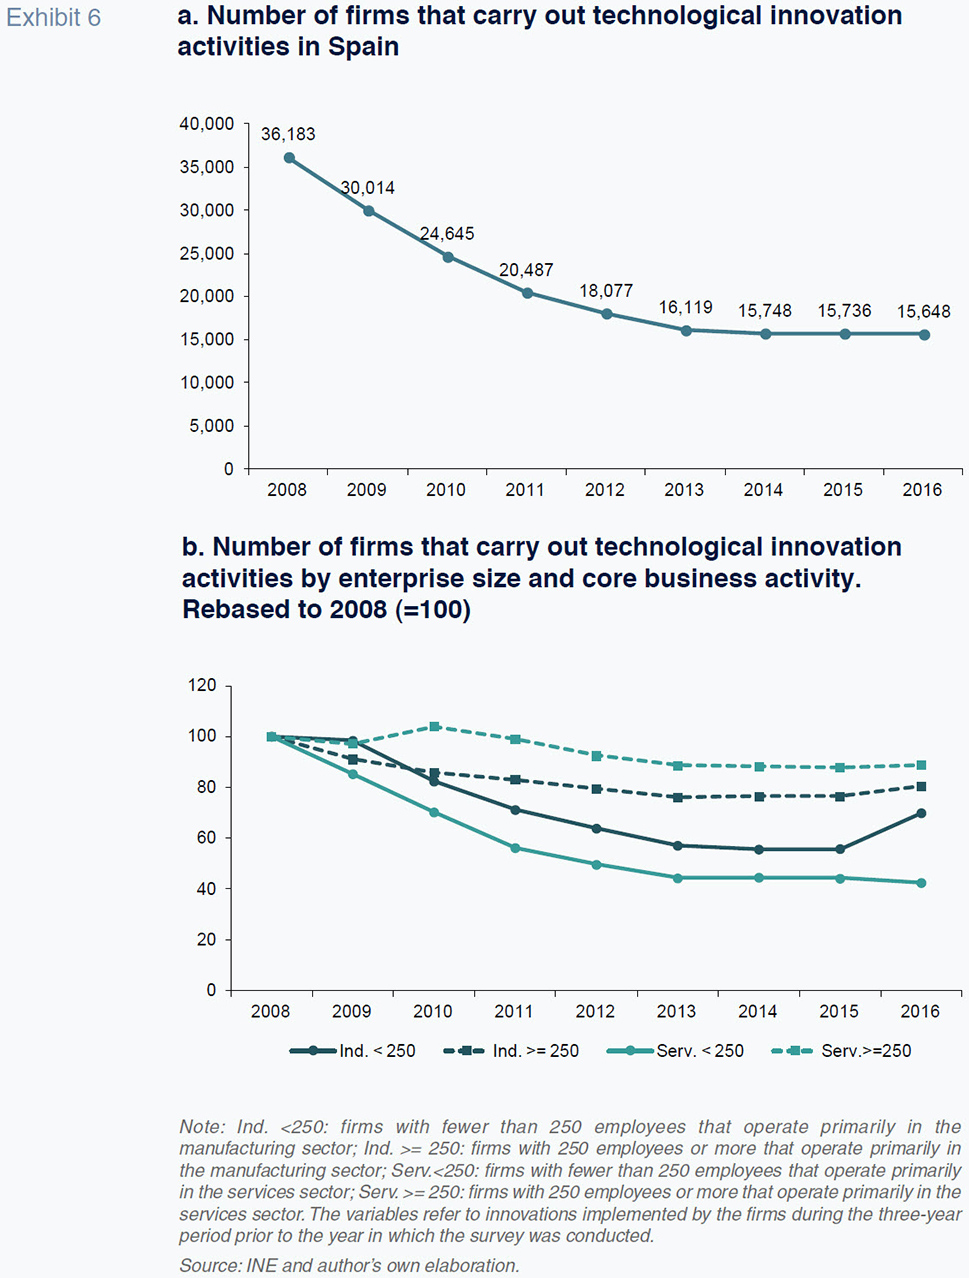

For each innovation class we depict the total number of active firms (Exhibits 6.a and 7.b), and the number of firms by both enterprise size (fewer or more than 250 employees) and core business (industry/manufacturing or services), rebased to 2008 (Exhibits 6.a and 7.b).
As shown in Exhibit 6.a, the number of enterprises that undertake technological innovation activities fell continuously between 2008 and 2016 (latest data available), such that the number of firms that were active in this field in 2016 was less than half (43%) that of 2008. The loss of innovative firms is most pronounced within the category of enterprises with fewer than 250 employees whose core business is the provision of services. The number of firms in this group, which represent nearly 50% of all the enterprises that undertake technological innovation activities, fell by nearly 60% between 2008 and 2016. This downward trend has been continuous and there are no signs of a turnaround. In contrast, the downward trend for those firms whose core business is manufacturing came to a halt in 2016, a year in which the number of active companies with fewer than 250 employees increased considerably (Exhibit 6.b).
While those firms that undertake non-technological innovation fell in number by almost half (55%) between 2008 and 2013, they have been growing in ranks since 2014. In comparison with those firms that are pursuing technological innovation, the main difference in this group lies in the fact that the drop in the number of companies with fewer than 250 employees whose main business is the provision of services has been considerably less intense: in 2016 the number of active firms accounted for 80% of that of 2008. In fact, the number of service providers with more than 250 employees that pursue non-technological innovation was 11% higher in 2016 (1,161) than in 2008 (1,038). This particular segment is the only category within the eight classes of enterprises analysed to have increased in number during the period studied.
Conclusions
The analysis undertaken yields several conclusions. Firstly, from a purely methodological standpoint, there is need for a new generation of R&D and innovation data that more accurately reflect the actual situation and pave the way for better decisions on the R&D policy-setting front. On the one hand, it would be useful to have indicators with a shorter time lag; at present, for some of the indicators (particularly those related with business enterprise activities and sources of R&D financing), the most recent information dates to three years ago. On the other hand, it would be good to have a greater wealth of R&D indicators in order to better cover complex realities, such as innovation undertaken in the public sector, social innovation and innovation initiatives at the international, inter-regional and, in general, collaborative levels.
Secondly, our analysis of the available data concerning the trend in R&D expenditure clearly reveals that Spain, in comparison with the other major economies in the eurozone, presents two growing challenges: it devotes fewer resources to these activities and does so in a far more volatile manner. In times of economic growth, R&D expenditure soars, probably above the realm of what is reasonable, whereas in times of crisis, it is slashed excessively. At any rate, the fact that Spain is one of three eurozone member states in the OECD that had yet to recoup 2008 R&D investment levels by 2016 is worrying. All the more so considering those countries that also suffered severe crises (like Greece or Ireland) were investing more in knowledge in 2016 than in 2008.
As for the innovative drive amongst Spain’s enterprises, despite a slight upturn in activity among firms engaged in non-technological innovation since 2014, it is concerning that the number of Spanish firms engaged in technological innovation has been in free-fall since 2008. Another source of concern is the trend in public and private sector R&D investment, which decoupled in Spain for the first time in 2016. Previously, expenditure in both segments has moved in tandem. However, according to the latest data for 2016, it appears that while private investment increased, public investment contracted. Yet another area of concern is the percentage of the general state administration’s R&D budget that is executed. This has been plummeting since 2008.
For all of these reasons, the diagnosis of the situation of R&D investment in Spain is no better today than it was four years ago. In fact, the situation has become even weaker. Nevertheless, the recent restoration of the Ministry of Science, Innovation and Universities under Spain’s new government may help reverse the divergent trend between Spain and the rest of the EU in terms of investment in science and knowledge. Importantly, the scope for offering Spain’s citizens a progressive economic and social model depends largely on being able to do so.
Notes
The author would like to thank Aleix Pons (The COTEC Foundation for Innovation) for facilitating budget execution data.
References
COTEC (2018), Informe COTEC 2018 (COTEC Foundation for Innovation).
XIFRÉ, R. (2014), "R&D+I in Spain: Is the growth engine damaged?", SEFO - Spanish Economic and Financial Outlook, No. 243: 83–92.
Ramon Xifré. ESCI-UPF School of International Studies, Public-Private Sector Research Center – IESE, Member of the COTEC panel of 100 experts