
Is Spain experiencing an export miracle?*
Between 2009 and 2016, the value of Spanish exports increased by 51%, leading some observers to label this development an ‘export miracle’. While several indicators suggest this period of growth shares notable similarities with the pre-crisis period, there are new economic features which could provide the basis for sustainable export growth to take hold in Spain.
Abstract: Some experts have labelled the growth in Spanish exports since 2009 an “export miracle”. To test this claim, this paper identifies which aspects of the Spanish export story are common to the pre- and post-crisis periods and which features are specific to the latter years. Among the shared aspects, we identify the pace of growth in exports, Spain’s share of global exports and the growth in Spanish exports to non-traditional markets. Among the new features, we highlight the sharp increase in the Spanish economy’s openness, the trade surplus and the growth in both the number of stable exporters and stable export relationships. Since 2009, Spanish exporters have made a great effort to diversify into new markets and offer new products. While talk of a miracle may seem exaggerated, if this broader exporting base becomes entrenched, Spain will achieve a permanent increase in the value of its exports. Spain could thus transition from a growth model based on its domestic market, particularly the construction sector, to one that capitalizes on the country’s competitive edge in the international marketplace.
IntroductionThe value of Spanish exports of goods and services grew by 51% between 2009 and 2016. However, this sharp increase coincided with only modest growth rates in Spain’s traditional export markets. As a result, authors such as Eppinger
et al. (2018), and numerous Spanish newspapers, have described Spain’s export boom during this period as a ‘miracle’.
[1] This paper analyses Spanish export trends since 2009 and compares them to the country’s export performance prior to the so-called Great Recession. This comparison enables us to differentiate between common and shared aspects of these export trends in order to assess the veracity of Spain’s supposed export miracle.
The first section of this paper examines Spain’s export performance using six indicators: the value of exports, the share of global exports, export destinations, the export openness ratio (defined as exports/GDP), the trade balance and the number of exporters and export relationships. Our analysis shows that: (i) Spanish exports grew at a similar pace during the pre- and post-crisis periods and at comparable growth rates experienced by members of the European Union-15 (EU-15); (ii) since 2009, Spain’s share of global exports of goods has declined; and, (iii) non-traditional markets are becoming an increasingly popular destination for Spanish exports. Additionally, we have identified two features unique to the period that began with the Great Recession: (i) significant growth in the export openness ratio; and, (ii) growth in the number of stable exporters and stable export relationships. While not strictly an export performance indicator, we have also noted that in contrast to earlier periods, the economic recovery has not generated a trade deficit.
The second section of this paper breaks down the growth in exports of Spanish goods into their respective margins of trade and compares these margins
[2] before and after the crisis. In both periods, the contribution of stable export relationships is very significant and similar in magnitude. However, the contribution of new export relationships to Spanish export growth grew in significance during the post-crisis period. This suggests that the efforts made by Spanish firms to find customers in new markets or new product segments is a distinctive feature of the country’s recent export growth. The data show that this market expansion has primarily occurred in the EU-15 markets and has been concentrated in the sectors where Spain has a comparative advantage.
In short, our analysis demonstrates that while there are some differences in the nature of Spanish exports between 2009 and 2016, there are also sufficient similarities to undermine the suggestion that Spain is experiencing an export miracle. However, if growth in the country’s export base becomes entrenched, it is probable that Spain will see a steady increase in the value of its exports. Thus, the persistence of these economic trends mean an export miracle may yet take hold in Spain.
Spain’s pre- and post-crisis export story
In this section, we analyse Spain’s export performance before and after the crisis using several indicators. The comparison helps us to identify which aspects are common to both timeframes and which are unique to the period starting with the Great Recession.
The first indicator we present is the value of the goods and services exported from Spain between 1995 and 2016 (Exhibit 1). Between 2009 and 2016, exports of goods and services in Spain increased by 51%. As illustrated in the exhibit, some of the growth observed from 2009 represents a recovery in export volumes to pre-crisis levels. Spanish exports registered an average annual growth of 5% between 2010 and 2016. This growth rate is lower than that observed during the six years prior to the crisis (6%) and substantially lower than that observed between 1995 and 2008 (8%). The exhibit also demonstrates that the trend in Spanish exports is similar to the growth rates exhibited by the EU-15.
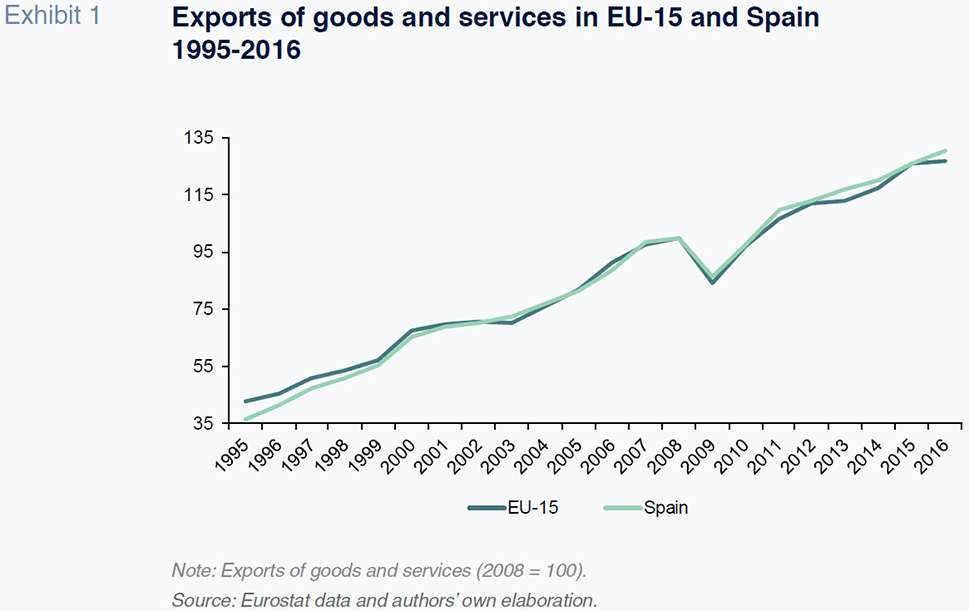
Exhibit 2 separates the trend in the exports of goods and services. Similar to Exhibit 1, from 2009, Spain experienced export growth in both goods and services. However, these growth rates are not higher than those attained prior to the crisis. In the case of goods, the rate of growth in Spanish exports since 2009 has been higher than that of the EU-15. However, growth in Spanish service exports has lagged behind the EU-15. In short, Exhibits 1 and 2 demonstrate the absence of significant differences in the pace of growth in Spanish exports before and after the crisis and between the growth recorded in Spain and the EU-15.
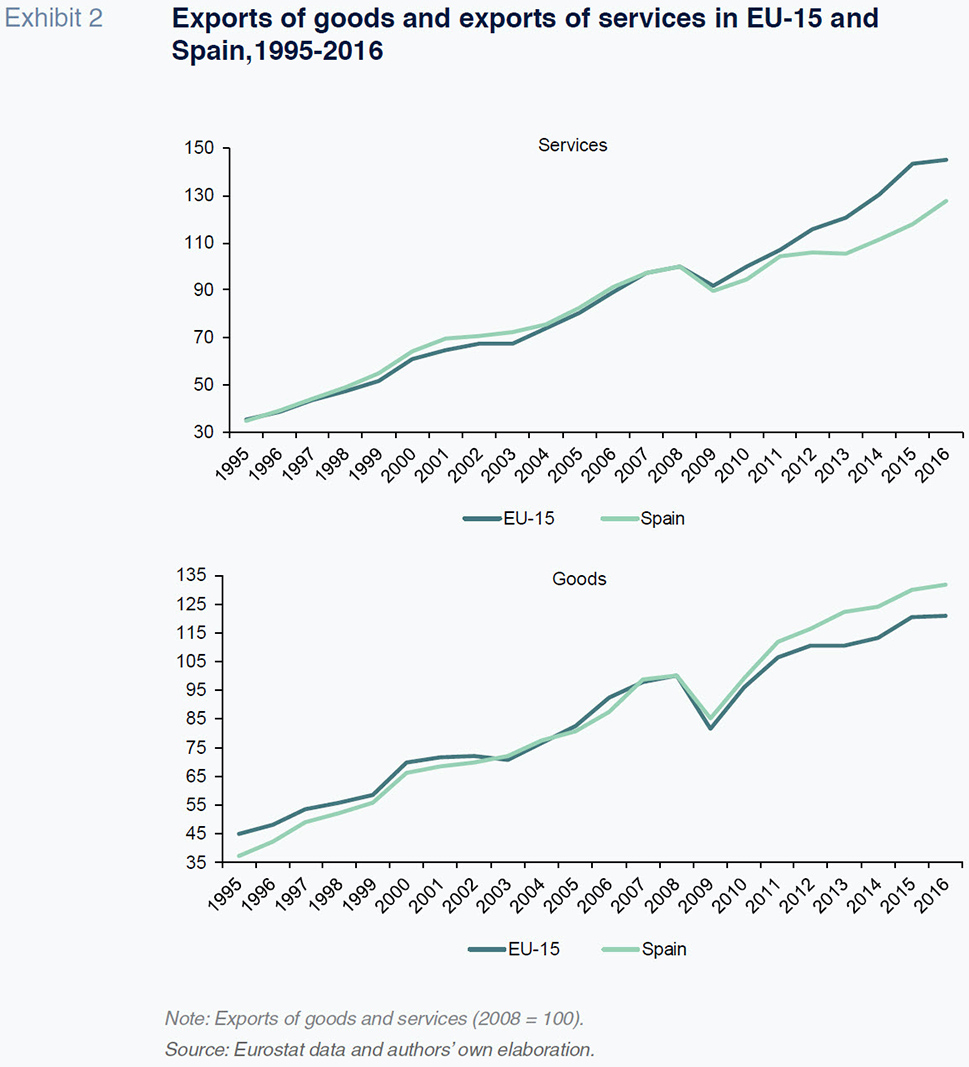
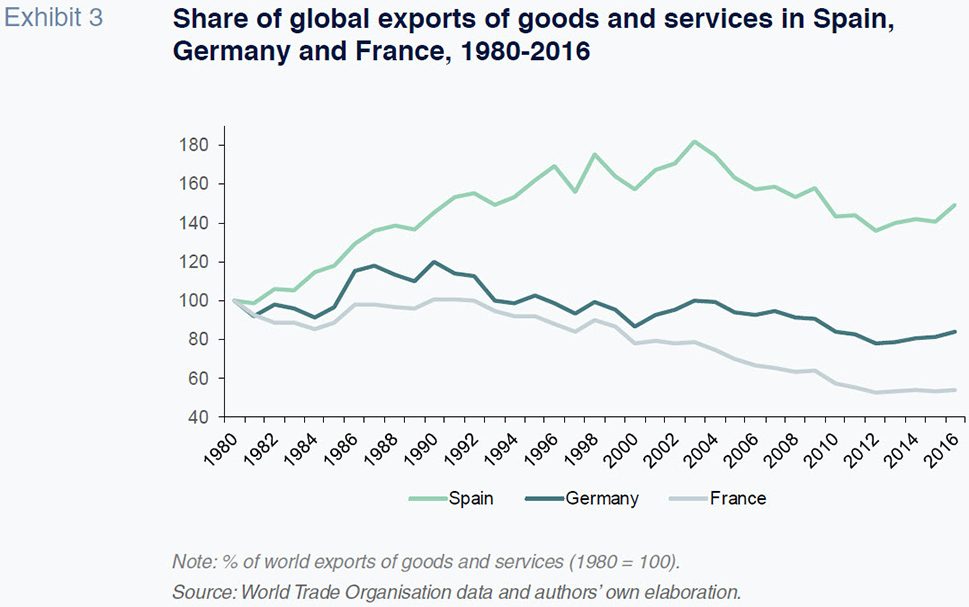
Exhibit 3 shows the trend in Spain’s share of world exports of goods and services between 1980 and 2016. To facilitate this analysis, we have set Spain’s share of global exports of goods and services in 1980 at 100. Between 1980 and 2003, Spain’s share rose from 1.3% to 2.4%. However, from 2003 to 2012, Spain’s global market share declined, in line with most other developed countries, in response to the rapid incorporation of China and other emerging markets to the global economy. Market share rebounded again between 2013 and 2016. The timing of this growth in export market share is notable given that it coincided with the opening up of the Chinese economy.
[3] The exhibit also demonstrates that the growth in Spain’s share of world exports of goods and services overlapped with a drop in the share of Germany and France.
Some authors have highlighted the growth in non-traditional markets for Spanish exports as evidence of an export miracle (García-Legaz, 2016). To test this thesis, Exhibit 4 shows the weight of the various destinations for Spanish goods exports between 1995 and 2016. If we take the EU-15 as our proxy for the ‘traditional’ market for Spanish exports, there is in fact a decline in the share of Spanish exports of goods destined for this market from 72% of all exports of Spanish goods in 1995 to 61% in 2016. However, the exhibit also shows that the share of exports going to the EU-15 began to fall prior to the crisis.
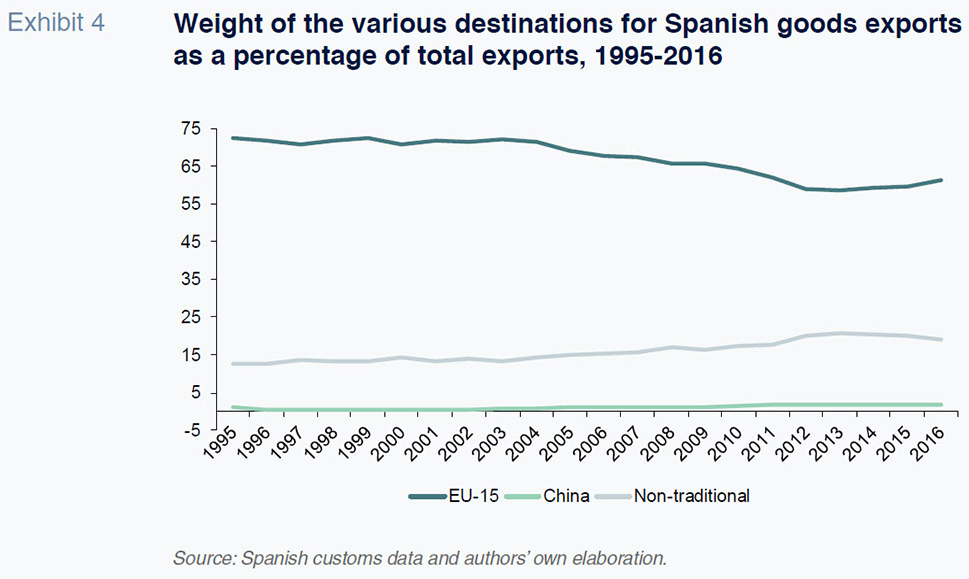
As our proxy for ‘non-traditional’ markets, we take the countries listed in the Ministry of the Economy, Industry and Competitiveness’ Integral Market Development Plans of 2015. This programme is comprised of developed countries such as Australia, the US, Japan and Singapore as well as emerging economies like Brazil, China, the Philippines, India, Indonesia, Mexico, South Africa and Turkey. Mediterranean countries that are geographically close to Spain, such as Algeria and Morocco, and oil-producing nations, like Saudi Arabia, Bahrain, Qatar, United Arab Emirates, Kuwait and Oman, are also included. As a proportion of the market for Spain’s exports of goods, these countries increased their share from 13% in 1995 to 19% in 2016. Nevertheless, there has been a similar acceleration in their share of Spanish exports of goods between the crisis and post-crisis period and a decline after 2013 is observed.
Although it is included in the category of non-traditional markets, the exhibit shows the weight of China as a destination for Spanish exports separately. This is due to the significant role China plays in the global economy. While China’s weight has doubled since 1995, its 2% proportion of Spanish goods exports is still small in absolute terms. Nevertheless, in this market we do not observe a dissimilar acceleration in the rate of growth from 2008.
[4] In short, the non-traditional markets have been gaining a greater share of the Spanish export pie. However, this expansion was underway before the crisis erupted.
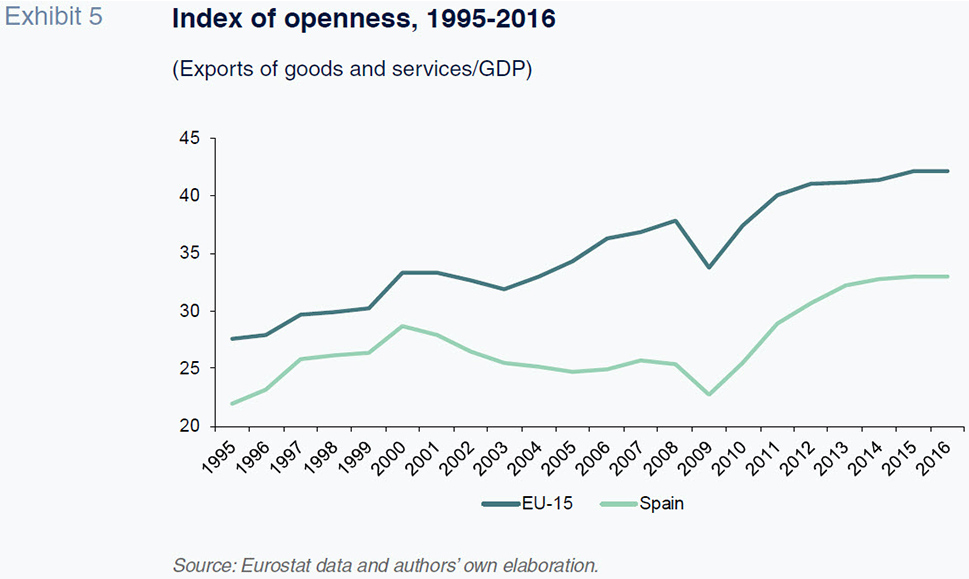
There are three variables that do point to a shifting trend in the Spanish export sector after the crisis. The first is the Spanish economy’s openness ratio (exports as a percentage of GDP). As shown in Exhibit 5, the openness ratio has increased sharply since 2009. Specifically, it rose from 23% in 2009 to 33% in 2016. Conversely, between 2000 and 2009, the openness ratio declined from 29% to 23%. This is a notable divergence from the trend seen across the EU-15 during that same period. The exhibit also illustrates that the openness ratio in Spain is lower than that of the EU-15. However, this can be attributed to the greater size of the Spanish economy relative to the EU-15 average. If we compare Spain’s openness ratio with that of other large EU economies (Germany, France, Italy and the UK), only Germany surpasses Spain on this measure.
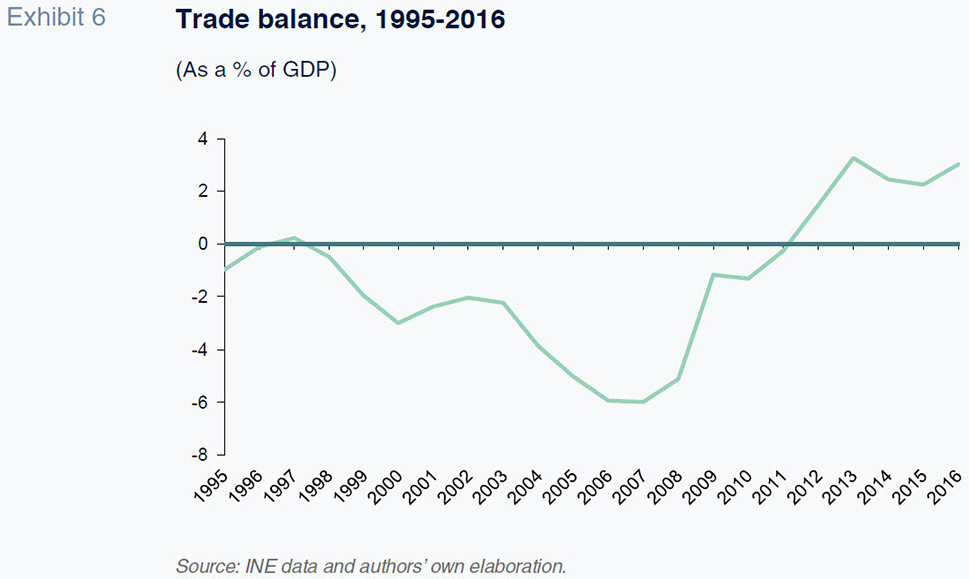
The second variable that points to a recent change in Spanish export trends is the trade balance. As shown in Exhibit 6, the trade balance began to deteriorate in 2000, with the deficit peaking at 6% of GDP in 2007. From that year on, the deficit started to decrease, and since 2012, Spain has recorded a trade surplus. A significant part of the correction can be attributed to the sharp decline in imports. This was triggered by a deep recession that engulfed the Spanish economy between 2009 and 2013. Interestingly, despite the economic recovery, the Spanish economy has continued to record a trade surplus. As noted by García-Legaz (2016), this development is unprecedented in Spanish economic history.
The third indication that a shift in Spain’s export trend occurred after the crisis is the growth in the number of stable exporters and stable export relationships. We define exporters as firms whose annual exports amount to 1,500 euros.
[5] Export relationships are defined as the combination of a unique firm, product, and destination. For example, the bicycles exported by a Spanish firm to France constitutes a firm-product-country export relationship. For product identification purposes, we use the Combined Nomenclature 8-digit codes.
[6] We define stable exporters as firms that have been exporting on an uninterrupted basis for four years. Likewise, a stable export relationship is a firm-product-country export combination that has experienced uninterrupted activity for four years.
As shown in Exhibit 7, the number of exporters has grown since 1997. Specifically, the number of exporting firms in Spain increased from 48,056 in 1997 to 79,643 in 2016. While the growth in the number of exporters accelerated during the crisis (2010-2013), the number of exporters declined during the subsequent recovery (2013-2016). This trend can be attributed to those firms that began exporting in order to counteract the fall in domestic demand. Once the recovery was underway and domestic demand had rebounded, these firms ceased exporting their products outside of Spain. The econometric analysis performed using firm data by Almunia
et al. (2018), and de Lucio
et al. (2018b) endorses this hypothesis.
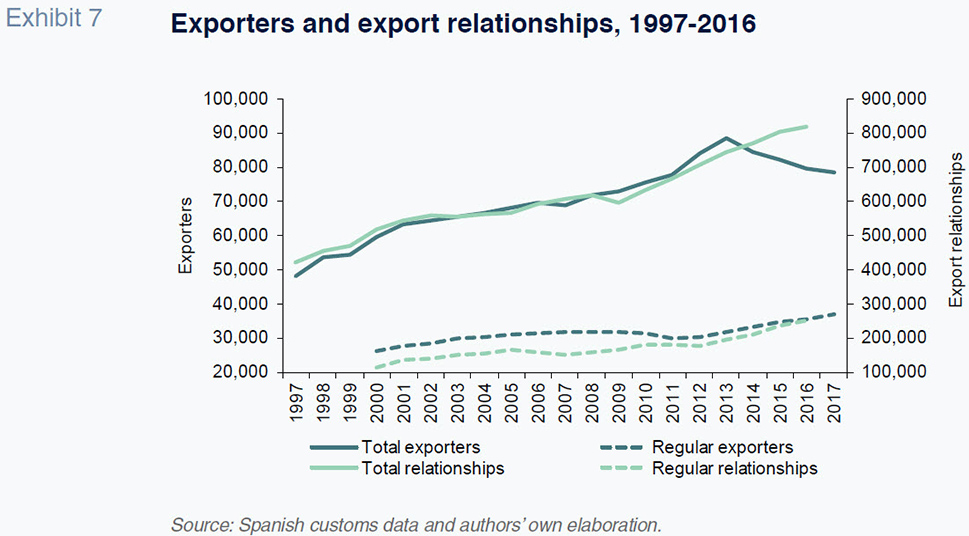
Growth in the volume of export relationships also accelerated from 2010. In contrast to the trend in exporters, this growth did not falter once domestic demand began to recover. The initial growth in export relationships can also be explained by the collapse in domestic demand. Spanish firms forged new export relationships to mitigate the drop in their home-market sales. For example, de Lucio et al. (2018b) show that when domestic demand falls, companies are more likely to increase their exports through new export relationships than via existing export relationships.
What is noteworthy, however, is the fact that many of these new export relationships have not disappeared since the rebound in domestic demand. According to de Lucio et al. (2018a), the crisis forced many firms that were initially reluctant to enter into new markets to export in order to maintain their business volumes and stay afloat. As well, firms that were already exporting were obliged to find new customers by offering new products or entering new markets. Some companies have returned to their traditional markets since domestic demand recovered, but many others have discovered that they can compete on a steady basis in these new international markets. This trend is consistent with the growth observed in the number of stable exporters and stable export relationships since the Great Recession. Similarly, de Lucio et al. (2018a) show that growth in the number of exporters has been higher in those industries which saw an increase in the number of companies during the crisis.
Margins of trade analysisTo complement the analysis outlined above, this section breaks down the growth of Spanish exports into three different margins before and after the crisis. Using the methodology put forward by Bernard
et al. (2009), the change in the value of exports can be attributed to the net entrance of new exporters, diversification in incumbent exporters’ portfolio of products and destinations, and the variation in the value of existing export relationships. The first two represent the so-called extensive margin of exports, while the third factor represents the so-called intensive margin of exports.
[7]
Table 1 presents the contribution by each of the margins to the growth in Spanish exports. Between 2009 and 2016, Spanish exports increased by 92.28 billion euros. The absolute increase in the value of exports is 59% higher than that registered in the pre-crisis years (2001-2008). The intensive margin made the biggest contribution to the growth in exports. This margin encompasses the change in the value of export relationships, defined as firm-product-country combinations that already existed in 2009 and remained active at the end of the period. Diversification also made a very important contribution to the growth in exports during this period. This margin includes all the export relationships that did not exist prior to 2009 and were introduced by stable exporters between 2009 and 2016. This margin’s significant contribution to growth suggests that a large proportion of Spanish exporters broadened their portfolio of products and export destinations after 2009.
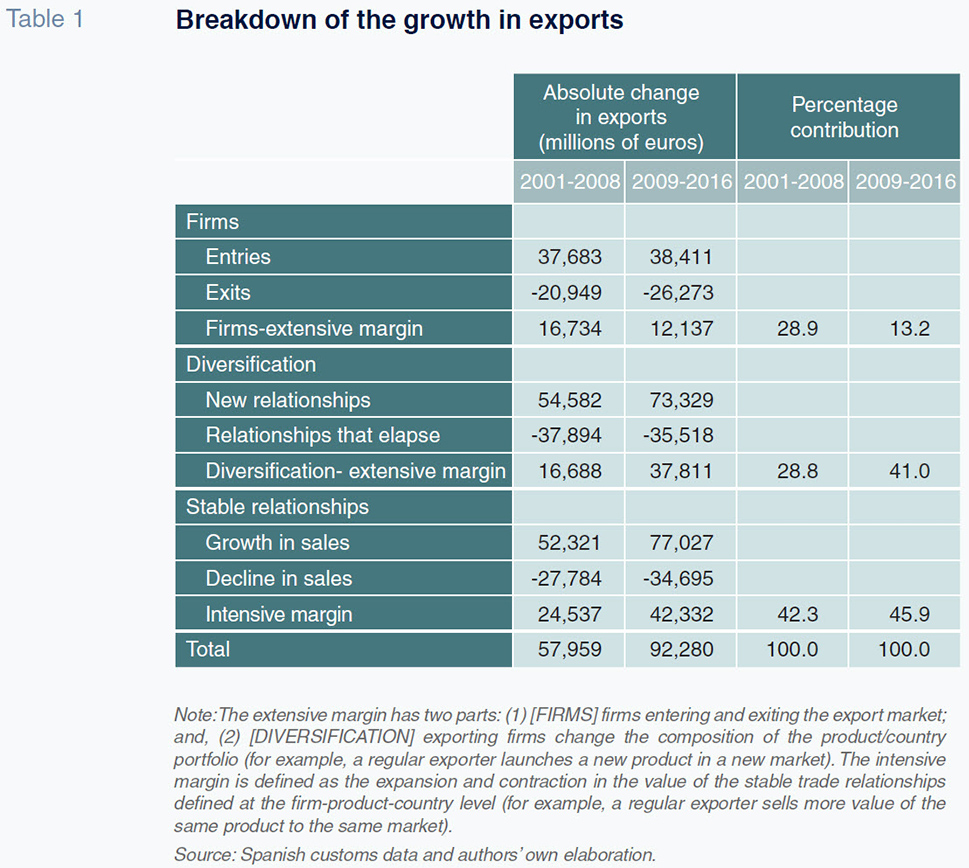
As highlighted in Exhibit 7, the number of Spanish exporters increased between 2009 and 2013. However, the net contribution by new entrants to the growth in exports between 2009 and 2016 was lower in both absolute and relative terms than that of the pre-crisis period. These figures suggest that the value of the exports by the new entrants during the crisis years was smaller and that these firms exhibited a lower survival rate and higher turnover rate than in the pre-crisis years.
Table 2 presents export growth broken down by destination. As in Exhibit 4, we take the EU-15 as our proxy for the traditional markets for Spanish exports and the Market Development Plan countries as our proxy for non-traditional markets. We also provide the breakdown for China and countries that are not part of the EU-15 or the non-traditional proxy group (Rest).
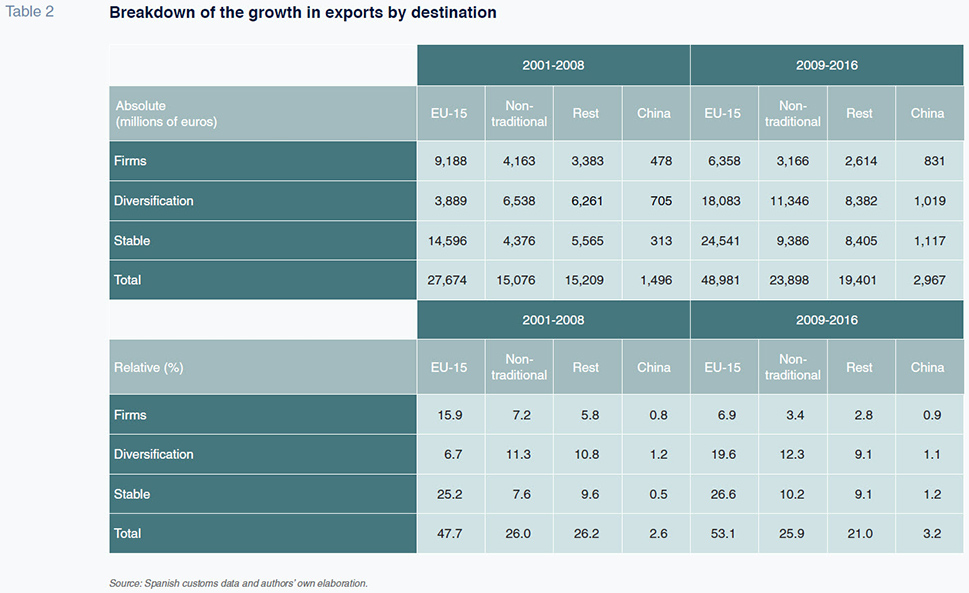
The table shows that approximately half of the growth in Spanish exports during both periods can be attributed to exports to the EU-15. Furthermore, the traditional market’s contribution to the growth in Spanish exports increased during the recession and subsequent recovery. The contribution to growth by China and non-traditional markets is steady at around 3% and 26% respectively. While the most important margin in the EU-15 market is that of stable export relationships, diversification is the fastest growing margin. For non-traditional markets, the reverse is true, with diversification as the most important margin and stable export relationships as the fastest growing margin. In the case of China, all three margins are important, although the stable export relationships margin is particularly significant.
Lastly, we looked at growth in exports according to different product categories. In line with Eurostat classifications, we separated manufacturing goods into four categories: low-technology, medium low-technology, medium high-technology, and high-technology.
[8] We also included categories for agricultural, fishing and forestry products (shortened to agriculture), mining and energy goods, and unclassified products.
[9]
As shown in Table 3 the sectors that have made the biggest contribution to the growth in exports of Spanish goods since the crisis (Panel B) have been low-technology manufacturing goods (23%) and medium high-technology manufacturing goods (41%). Of note is the manufacturing of food products and motor vehicles. In both sectors, Spain boasts a significant revealed comparative advantage. Although high-technology products only contributed 6% to the growth in exports between 2009 and 2016, this category’s contribution has exhibited a fourfold increase from the previous period. The pharmaceutical and aeronautic industries play a particularly prominent role in export of high-technology products from Spain. Medium-low technology manufacturing goods contributed 15% to the growth in exports after the crisis but 33% prior to it.
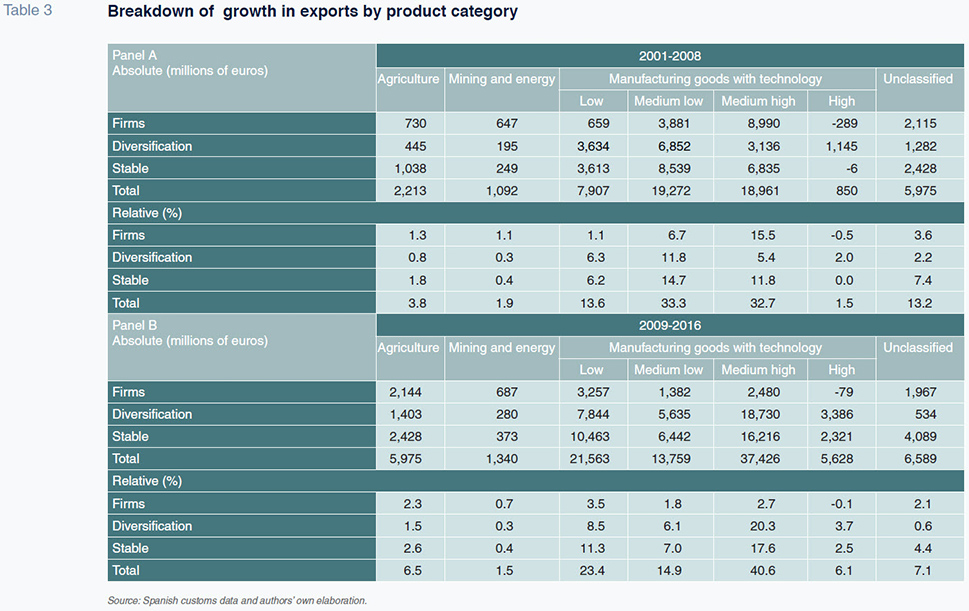
Table 3 presents growth decomposition by margins. We focus on the medium-high technology manufacturing sectors. Contrary with the pre-crisis period, the contribution of new companies in the post-crisis period was low, 3% (16% in the pre-crisis period). Diversification increased substantially its contribution 20% (5% in the pre-crisis period). Intensive margin also increased its growth contribution.
Conclusion
Since trade collapsed in 2009, Spanish exports have experienced a remarkable recovery, prompting some to label this rebound as an ‘export miracle’. However, if we look only at the growth rate in exports, very little difference can be discerned between this most recent period and the years prior to the crisis. Moreover, Spain’s export data is comparable to that of the EU-15. In this light, talk of an ‘export miracle’ seems exaggerated.
Nevertheless, there are indicators that suggest something unique may be taking place in Spain’s export sector. Firstly, the openness of the Spanish economy has increased considerably. Secondly, the recovery in domestic demand has not led to a trade deficit. Thirdly, the expansion of the number of stable exporters and, most importantly, in the number of stable export relationships, has increased in recent years.
By analysing the breakdown of the growth in Spanish exports, it becomes clear that the recent expansion in Spanish exports is underpinned by a broadening of products and export markets by existing Spanish exporters. This diversification has occurred primarily in Spain’s traditional markets and in sectors where Spain has a revealed comparative advantage, such as the automobile industry, agriculture products (fruits and vegetables) and some processed food sectors (meat products, wine).
If Spain’s new exporting firms survive and the new export relationships sparked by the Great Recession become entrenched, a permanent increase in the value of Spain’s exports is possible. Spain could thus transition from a growth model based on its domestic market, particularly the construction sector, to one that capitalizes on the country’s competitive edge in the international marketplace.
Notes
We would like to thank the Spanish Tax Agency’s Department of Customs and Duties for access to their export figures. We would also like to express our gratitude for the financing received from the Spanish Ministry of the Economy and Competitiveness (MINECO ECO2015-68057-R and ECO2016-79650-P, co-financed by the ERDF), the Basque regional government’s Department of Education, Linguistic Policy and Culture (IT885-16) and the regional government of Valencia (Prometeo 2017/052).
https://www.elconfidencial.com/economia/2015-04-13/espana vive un milagro exportador tras la crisis financiera; http://www.blogscapitalbolsa.com/article/12931/el milagro de la economia espanola.html
Exports evolves at two margins. Variations on existing relationships (intensive margin) and new trade relationships (extensive margin).
China’s share of global exports of goods and services increased from 0.9% in 1980 to 11.1% in 2016, representing growth of 1,133%.
China’s weight as a destination for Spanish exports registered an average annual growth rate of 1.4% between 1995 and 2008 and 6.4% between 2008 and 2016. Most of the advance is observed after China joined the WTO. The growth rate between 2000 and 2008 is higher than the post crisis period.
This threshold significantly reduces the total number of exporting firms each year but does not affect the aggregate value of exports.
Given the fact that the product classification in the Combined Nomenclature changes every year, we have used the Van Beveren et al. (2012) algorithm to obtain a stable classification for the period under analysis.
See Lucio et al. (2011) and de Lucio et al. (2017) for applications of this methodology to the Spanish case.
http://ec.europa.eu/eurostat/statistics-explained/index.php/Glossary:High-tech_classification_of_manufacturing_industries
‘Agriculture’ includes national classification of economic activities (NACE) codes 01 to 03; ‘Mining and energy’ includes NACE codes 05 to 09 and 35; and ‘Unclassified’ includes the products in the Harmonised System that do not have an equivalent in the NACE.
References
ALMUNIA, M.; ANTRÁS, P.; LÓPEZ-RODRÍGUEZ, D., and E. MORALES (2018), “Venting out: Exports during a domestic slump”,
mimeo, available at
https://scholar.harvard.edu/files/antras/files/venting_aalm_latest_draft.pdfBERNARD, A. B.; JENSEN, J. B.; REDDING, S. J., and P. K. SCHOTT (2009), “The margins of US trade”,
American Economic Review, 99(2): 487-493.
EPPINGER, P. S.; MEYTHALER, N.; SINDLINGER, M. M., and M. SMOLKA (2018), “The great trade collapse and the Spanish export miracle: Firm-level evidence from the crisis,”
The World Economy, 41(2): 457-493.
GARCÍA-LEGAZ, J. (2016), “Logros y retos del sector exterior de la economía española” [Achievements and challenges in the Spanish foreign sector],
Economistas, 148: 6-8.
LUCIO, J.; MÍNGUEZ, R.; MINONDO, A., and F. REQUENA (2011), “The extensive and intensive margins of Spanish trade”,
International Review of Applied Economics, 25(5): 615-631.
— (2017), “Los márgenes del crecimiento de las exportaciones españolas antes y después de la Gran Recesión” [Growth in Spanish exports before and after the Great Recession: Margins],
Estudios de Economía Aplicada, 35(1): 43-62.
— (2018a), “Crisis, experimentation and the emergence of new regular exporters and export relations”,
mimeo, available at:
http://paginaspersonales.deusto.es/aminondo/Research.htm— (2018b), “The effect of the Great Recession on exports. Evidence from Spain”,
mimeo, available at:
http://paginaspersonales.deusto.es/aminondo/Research.htmVAN BEVEREN, I.; BERNARD, A. B., and H. VANDENBUSSCHE (2012), “Concording EU trade and production data over time”,
NBER Working Paper, 18604, vol. National Bureau of Economic Research.
Juan de Lucio. Professor at Universidad Nebrija
Raúl Mínguez. Associate Professor at Universidad Nebrija
Asier Minondo. Full Professor in Economics at Deusto Business School, Associate Researcher at ICEI
Francisco Requena. Full Professor in Economics at Universidad de Valencia