
Capitalisation of Spanish corporations since the financial crisis
An analysis of the stock of fixed capital of Spain’s non-financial corporations from 2011 to 2023 reveals the persistence of a post-pandemic time lag in the recovery of corporate investment. A recovery in investment will require a recovery in returns to pre-pandemic levels and a drop in the user cost of capital as inflation eases, rebalancing the relative costs of capital and labour in the process.
Abstract: An analysis of the stock of fixed capital of Spain’s non-financial corporations from 2011 to 2023 reveals the persistence of a post-pandemic time lag in the recovery of corporate investment. The results point to two contributing factors: (i) the trend in the relative costs of capital and labour, unfavourable for the accumulation of capital since 2021; and (ii) the relationship between the return on and user cost of capital. Relative input prices have favoured more labour-intensive production, while the proximity of returns to costs of capital have provided an incentive to invest only the minimum needed to replenish the capital consumed. A recovery in investment will require a recovery in returns to pre-pandemic levels and a drop in the user cost of capital as inflation eases, rebalancing the relative costs of capital and labour in the process.
Foreword
In 2023, Spain’s non-financial corporations (NFCs) invested 173 billion euros in fixed capital, 5 billion euros (current) less than in 2019. Adjusting for the trend in the prices of capital goods (the deflator for gross fixed capital formation), corporate investment was 30.7 billion euros lower in 2023 than in 2019 (17% lower). If investment had held steady at 2019 levels in constant euros, between 2020 and 2023, the corporate sector would have increased its stock of productive assets by 95 billion euros more than it has in actual fact. The corporate sector’s “non-investment” represents over half of the total NGEU funds. The lag in the recovery in corporate investment in the wake of the pandemic contrasts with the trend in output and employment in the NFC sector, which by 2023 were a comfortable 3.1% and 8.8% above 2019 levels, respectively.
The goal of this paper is to analyse the capitalisation process in the NCF sector in Spain in recent years, putting it in context with the recovery path etched out from the lows of 2012, dragged down by the consequences of the financial crisis of 2008 and its scars, with the ultimate aim of better understanding the reasons for the lag. [1] Our analysis is limited to the NFC sector because of the comparability of the accounting information available and its importance to the economy, as it contributes over 80% of the Spanish private sector’s GDP.
It is structured into four sections. The first looks at the trend in the stock of fixed (productive, not financial) capital of the NFCs during the period under analysis, outlining the assumptions used to arrive at a conclusion based on the information available. The second section shows the trend in the stock of capital by comparison with the trend in annual NFC output and in the other primary input used in production: labour. To interpret the figures we look at the trend in the relative prices of the capital and labour inputs during the period and estimate the gap between potential and observed output opened up by the pandemic. The third section relates the accumulation of capital with the correlation between the gross return on investment in capital and the user cost of capital. The paper ends with a few conclusions to explain the factors that have influenced the stock of capital in the NFC sector in Spain in recent years.
Estimating the stock of productive capital at the NFCs
The NCFs’ stock of productive or fixed capital (their balance sheets also include financial assets and working capital that are not within the scope of this analysis) is the result of a dynamic process shaped by the new investments made by the corporations individually over time and their depreciation as a result of usage, wear and tear, technological obsolescence or other factors. The stock of productive capital at the end of each year t is calculated using the perpetual inventory method using aggregate investment flow and capital consumption figures for the overall NFC sector published in the national accounts. Essentially, this method consists of acknowledging that the fixed assets accumulated by corporations over time are valued at the prices at which they were acquired at the time and that the corporations do not replace their depreciated assets with identical assets but rather replace the productive capacity lost by investing in new capital goods that are generally technically superior to those depreciated. Since the prices of capital goods change over time, the sum of monetary investments made in the past may include monetary units that do not correspond to the equivalent in comparable productive capital services from one period to the next.
The perpetual inventory method calculates the stock of capital at current or replacement prices and subsequently deflates that value to obtain a homogeneous measure of homogeneous capital service units. The calculations use information about the initial stock of capital published by the Bank of Spain and data for the flows of gross fixed capital formation (GFCF) and capital consumption published in the national accounts. The trend in the price of capital services over time is measured using the gross fixed capital formation deflator (GFCFD). Lastly, we assume a rate of embodied technological change of 1%. [2]
Exhibit 1 provides the trend in the stock of NFC fixed productive capital in Spain at current prices and constant 2011 prices between 2011 and 2023. The stock of capital in constant euros increased at a healthy rate until 2019, up a cumulative 18% from 2011. In the years following the pandemic and the subsequent recovery, the stock of capital held stable in time, before shrinking a little in 2023. The stability in the capital stock means that each year corporations have been investing roughly the amount needed to replace, at current prices, their capital as it depreciated, whether through consumption or technological obsolescence.
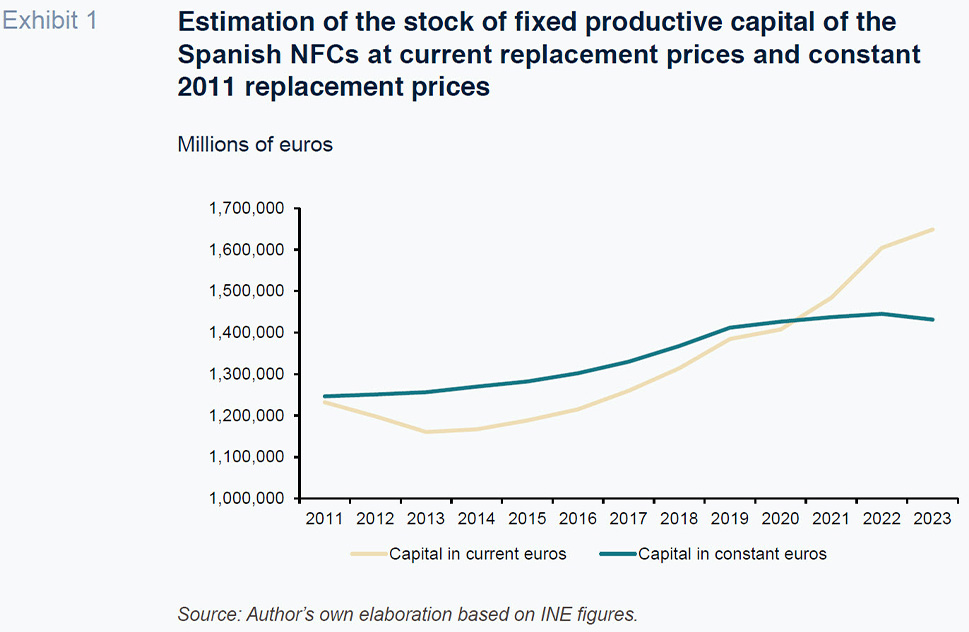
The fact that the stock of capital in constant euros trended above the stock in current euros for much of the period analysed is primarily attributable to the general downtrend in fixed asset prices, measured using the GFCF deflator, between 2008 and 2014 (Exhibit 2). For comparative purposes, Exhibit 2 includes GDP and the labour cost index. The values for each year are rebased to 2019. Deflation in the prices of capital goods following the financial crisis (the comparable GFCFD in 2008 was 1.31, compared to practically 1 in 2011) did not affect the companies’ final sales prices (GDP deflator) or their labour costs, which were relatively stable. The GFCFD bottomed out in 2014, going on to recover, albeit slowly, until 2019, virtually recovering that year, closing in on the price level of 2011. In 2020, the deflator stabilised and for the rest of the period, until 2023, increased considerably, accumulating growth of 17.5% between 2019 and 2023. Output prices and labour costs also increased during the episode of inflation, by a cumulative 13%, which is less than the increase in the prices of capital goods. [3]
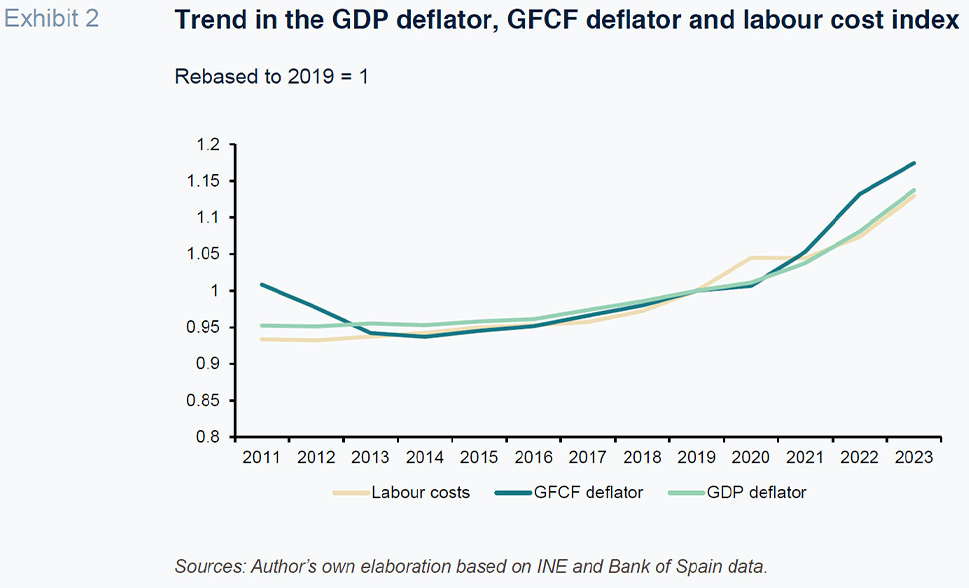
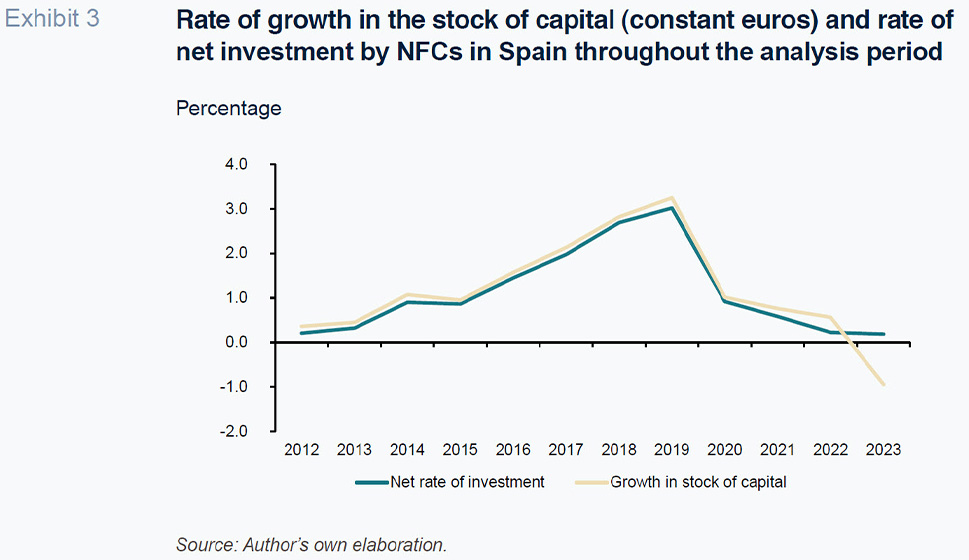
Exhibit 3 shows the dynamics in capital accumulation using the rate of growth in the stock of capital in constant euros and the rate of net investment by the NFCs (gross investment less depreciation during the year in current replacement euros, rebased to the stock of capital at replacement prices at the start of the period). Both variables depict a similar dynamic: growth that accelerates to a peak of 3% in 2019, when it was interrupted by the pandemic and embarked on a downward trend to the current values of close to zero.
NFCs in Spain: Inputs and output
Capital services are combined with labour services to add value to the intermediate products that corporations purchase from external suppliers. Exhibit 4 shows the trend in the two factors of production and in estimated output in the NFC sector during the period of analysis, rebased to the 2019 values. Output is estimated by deflating the gross value added (GVA) of the NFCs, using the GDP price deflator (Exhibit 2). The labour factor is estimated by deflating the NFCs’ employee compensation costs by the labour cost index (Exhibit 2). The stock of capital is that shown in Exhibit 1.
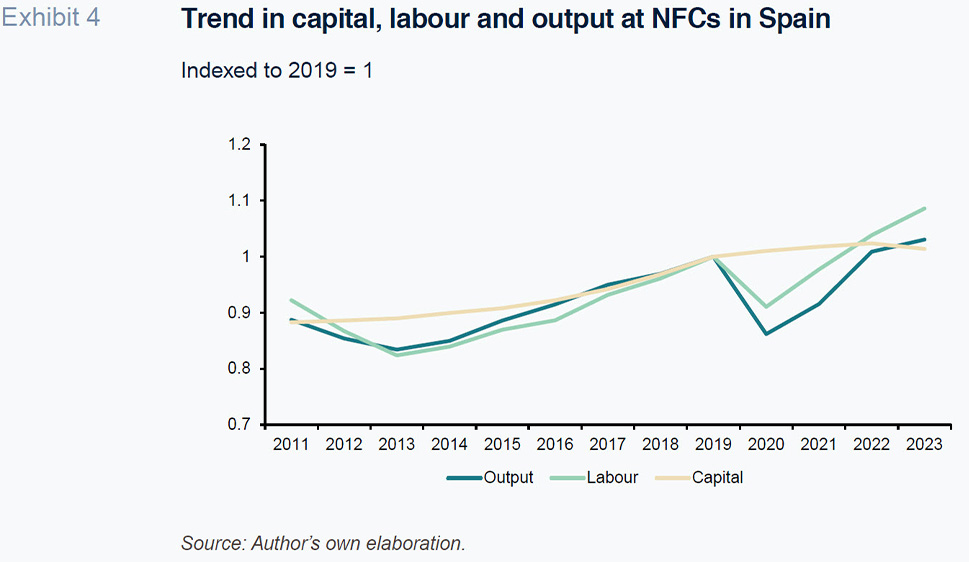
Until the pandemic, in 2019, the NFCs’ inputs and output move in tandem, with output particularly correlated to the labour factor. The onset of the health crisis in 2020 deviated those trends. The pandemic adversely affected output (decreasing by 14% in 2020 versus 2019) and the labour input, although less so (decrease of 9%). The growth in the stock of capital slowed considerably but remained positive until 2022, probably shaped by inertia around investment projects already in progress that were not cancelled, sufficient to delay the contraction in the capital stock (nevertheless very minor, at -0.4%) until 2023. Exhibit 4 clearly illustrates how the recovery from the worst of the pandemic has changed the mix of inputs used in production, marked by more intense use of labour relative to capital.
Mix of production inputs
Companies that seek to maximise their profits choose the mix of inputs, capital and labour for our purposes, to use in their production process as a function of the cost of the inputs and production technology. Specifically, the ratio of capital to labour used to maximise profits is correlated positively to the ratio of the elasticities of output to the quantities of inputs based on the production function and inversely to the relationship between the unit cost of capital and cost of labour. Therefore, for a given production technology, changes in the relationship between the prices of the inputs will lead to changes in the intensity of capital per unit of labour used in production, marked by more (less) capital per unit of labour when the price of the cost of labour increases (decreases) relative to the price of the cost of capital.
Exhibit 5 shows the trend in the indices (indexed to 2019 = 1) for the user cost of capital and labour. The user cost of capital reflects the fact that companies supply themselves with the capital services needed to produce goods and services from the stock of capital they own. There is, therefore, no benchmark market price for this cost, which has to be derived. Technically, its calculation involves (Salas Fumás, 2024) the finance cost (interest) paid by the company on its borrowings, fixed asset depreciation and the change in the value of the stock of fixed assets due to changes in the prices of the assets (negative when the stock revalues and positive when it devalues).
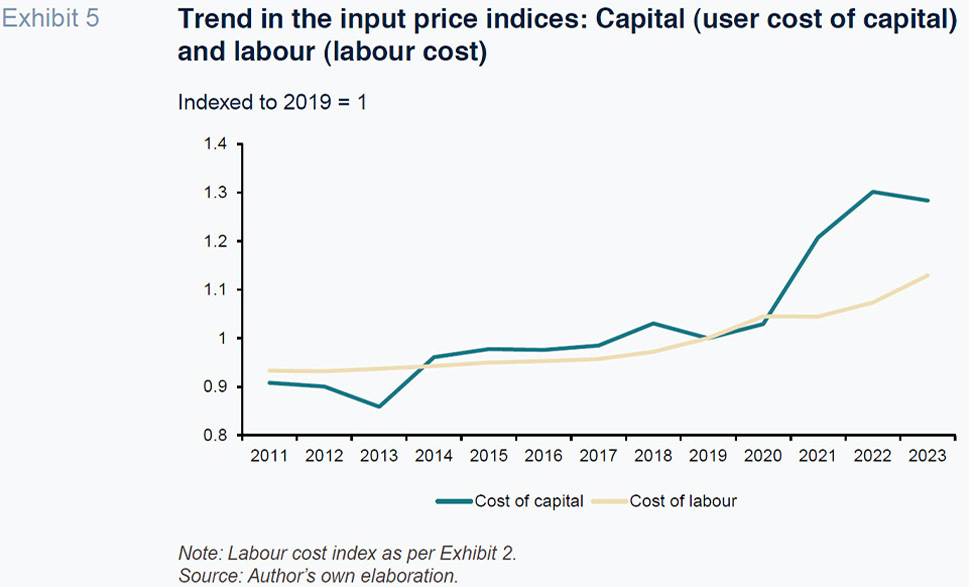
In the years following the pandemic, 2021-2023, the user cost of capital moved away from the cost of labour, implying a relative increase in the cost of capital as an input. Framed by the profit maximisation goal outlined above, the change in the relative prices of these inputs would be expected to lead to more intense use of labour and less intense use of capital in the production process, as is borne out by Exhibit 4. Elsewhere, Exhibit 6 shows how, in general throughout the entire period, the changes in the relative input prices have marked the direction of the change in the capital-labour production factor mix.
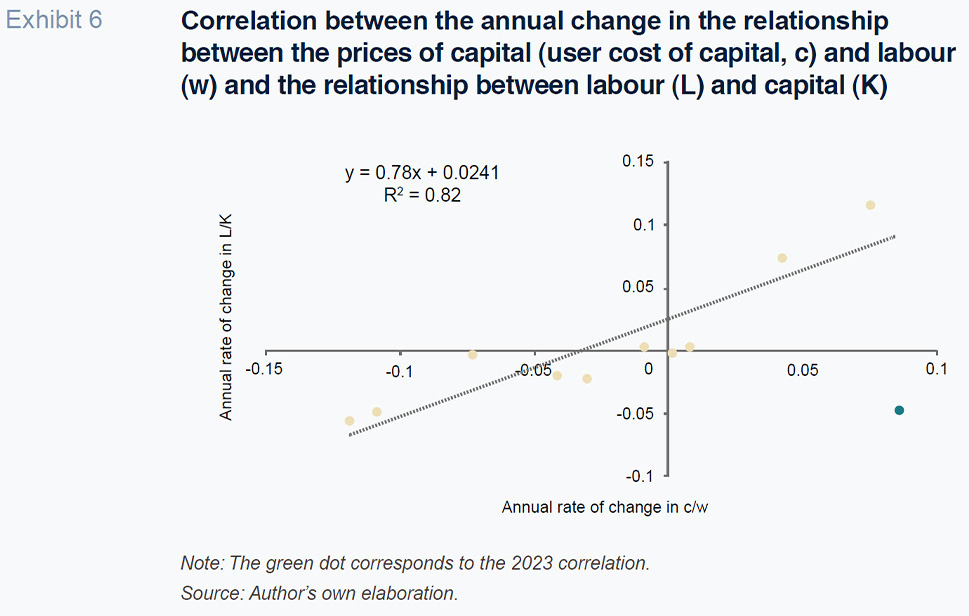
The 2023 data point depicts a clearly atypical situation: following the reduction in relative capital/labour costs that year, shaped by the double impact of a slight decrease in the cost of capital and an increase in the cost of labour, the replacement of capital with labour would have been expected to ease. But that did not happen. Perhaps the companies are not yet perceiving the reduction in the financial component of the cost of capital and are continuing to use labour intensely in light of the fact that wage growth remains moderate.
Potential output
Exhibit 4 points to a bigger decrease in output during the pandemic and subsequent recovery than might have been expected as a function of the availability and use of the capital and labour inputs over that same period of time. The shock implied by the health crisis may have altered the relationship between the inputs and output beyond what can be explained by the change in relative prices. To analyse this possibility we perform a comparison between observed output and potential output in the NFC sector (Exhibit 7). Potential output is calculated using a hypothetical production function with two inputs, capital and labour, using the amounts behind the indices provided in Exhibit 4 and assuming regular growth in total factor productivity of 0.5% per annum, accumulating year to year from 2011 on. [4]
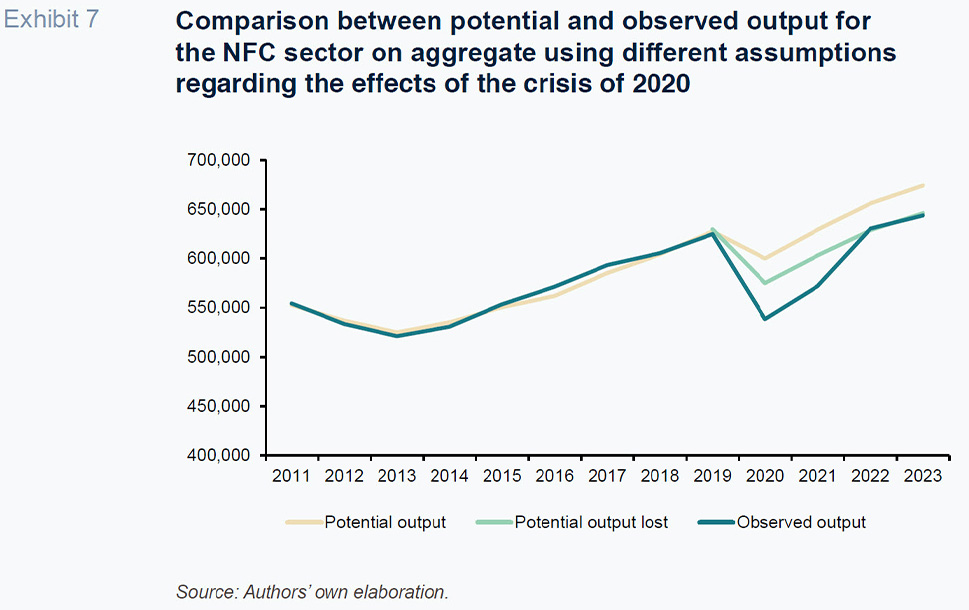
Potential and observed output overlap between 2011 and 2019, which means that production technology and the assumption regarding disembodied technological change (cumulative annual rate of 0.5%) provide a true reflection of the productive potential of Spain’s NFCs as a whole. The 2020 pandemic opened up a considerable gap between the two, with potential output trending above actual output.
The gap between observed and potential output from 2020 on could be attributable to several factors, from technological change to change in specialisation of the production mix (more intense output of services relative to manufactured goods, for example) or even a change in the quality of the inputs and/or in utilisation rates (fewer hours of work and lower machine utilisation than before the pandemic). The explanation implicit in Exhibit 7, the light green line, is that the pandemic destroyed production capacity that did not recover when activity returned to normal in the following years. That loss of capacity, according to Exhibit 7, could be in the order of 25 billion euros (equivalent to 5% of 2019 GVA). Once we acknowledge the step effect implied by that loss, the observed and potential paths fall back into sync.
Return on and cost of capital
The relative prices of the capital and labour inputs explain the trend in the mix of factors of production when seeking profit maximisation for a given technology. Expansion of productive capacity and potential output, however, depends on the economic inventive to invest. Before the pandemic, the growth in the stock of capital of around 2%-3% per annum indicates strong incentives. Those incentives, whether positive or negative, in turn depend on the relationship between the return on and user cost of capital, specifically whether or not the return is higher than the cost.
Exhibit 8 provides the trend over time in the gross return on the stock of capital and the user cost of capital. The gross return is calculated by dividing the NFCs’ gross operating surplus (GOS = GVA less staff costs) in year t by the stock of capital in current euros at the start of the period (end of year t-1). The user cost of capital is the same cost as is behind the indexed figures provided in Exhibit 5. Between 2011 and 2019, the gross return was comfortably above the user cost of capital, by a margin of between 5 and 6 percentage points.
[5] In 2020, the pandemic triggered a drop of over 5 percentage points in the gross return on capital, eliminating the spread relative to the user cost of capital. In the following years, 2021-2023, the return on capital recovered but in 2023 was still two percentage points below the 2019 value (Salas Fumás, 2024b). Elsewhere, the cost of capital increased during the recent episode of inflation, so that the capital return and cost have been virtually the same in recent years.
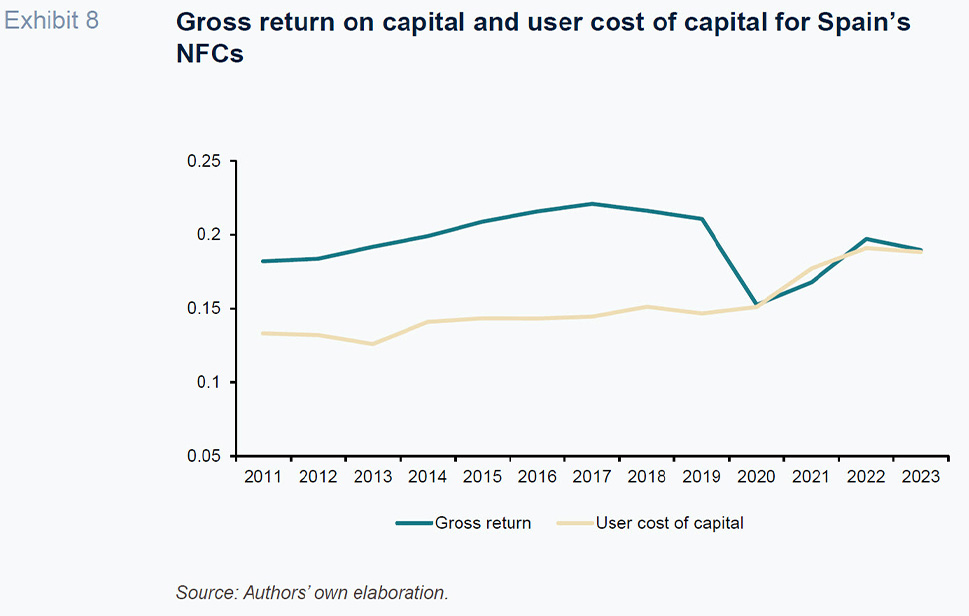
For as long as the gap between the return and cost is positive, between 2011 and 2019, the stock of capital increases at a healthy pace, as was shown in Exhibit 3. In contrast, when the return and cost coincide, the stock of capital stagnates (the companies only invest what they need to make up for the capital they consume). In 2023, with less inflation, the user cost eased, but the return on capital also dropped because last year the GOS decreased by one percentage point, which is the amount by which the share of employee compensation in GVA increased. From the standpoint of the financial incentives to invest, as measured here, a recovery in investment depends on a drop in the user cost of capital, which will be helped by the let-up in capital goods price inflation and a decrease in borrowing costs, coupled with a recovery in profit margins to 2019 levels.
Conclusions
The recovery in investment in productive capital by the Spanish corporate segment to levels that compensate for the consumption of capital and allow growth in the stock of available capital is important to delivering sustained and quality growth (productivity gains through the technological change embodied in capital goods and disembodied technological change). This article demonstrates that the stock of capital was sensitive to the trend in the relative prices of capital and labour throughout the period under analysis, except for an anomalous outcome in 2023, which is when the financial incentives to add to the stock of capital were insufficient (the return on capital equalled its cost). For the corporations to have the incentive to increase their stock of capital at net positive rates similar to those observed in the years prior to the pandemic, the return on those investments needs to comfortably outstrip their user costs of capital. In other words, the return on capital, still below pre-pandemic levels in 2023, needs to increase, with inflation in capital goods returning to 2015-2017 levels. Nevertheless, the comparison between potential and observed output in recent years suggests that the pandemic alone may have destroyed up to 25 billion euros of output in constant euros, equivalent to roughly 5% of the NCFs’ output in 2020.
The picture painted in this paper of the accumulation of productive capital in Spain is partial. Not only because it leaves out the financial institutions, unincorporated businesses, households and the government, but also because the capital assets of the universe of NFCs within the scope of this analysis are aggregated, without considering their composition. The national accounts include investment in R&D and intellectual property in gross capital formation but leave out other intangible assets (such as organisational capital). Moreover, within tangible assets, the gross capital formation aggregate does not distinguish between investment in housing (which commands a significant weight on the NFC balance sheets published by the INE) and investment in other assets such as capital goods or transport equipment. Not to mention the loss of accuracy implied by working with aggregate sector data rather than individual company data. Nevertheless, within the body of work that can be considered comparable in terms of methods and data used, we believe this analysis provides new and relevant perspective on the possible reasons for the lag in the recovery in productive investment in Spain in the wake of the pandemic. Essentially, there has been a lack of financial incentives to add to the stock of capital: despite considerable growth in nominal profits, that growth has been insufficient to offset the parallel increase in the user cost of capital.
Notes
This article follows up on a previous paper by Salas Fumás (2024a) which covers a shorter time period and focuses on investment flows rather than explaining the trend in the stock of capital. The Valencian Institute of Economic Research (Ivie) (Pérez et al., 2023) regularly publishes far more complete and detailed estimates of productive capital than presented here. This paper is different insofar as it focuses on NFC capital, which is explained on the basis of the companies’ financial decisions and earnings performance.
For a more detailed explanation of the perpetual inventory method used in these calculations and a comparison between the NFC capital stock measurements published by the INE and the estimates used in our papers, refer to Salas Fumás (2022). The capital stock figures arrived at are closer to those published by the Bank of Spain’s Central Balance Sheet Data Office than those published by Spain’s Statistics Office, the INE.
The stock of capital estimated for 2008, in current euros, amounts to 1.29 trillion; by 2011, the figure was lower, at 1.24 trillion current euros. In constant 2011 euros, the 2008 stock of capital increases to 1.35 trillion euros.
Refer to Salas Fumás (2024a). We model a Cobb Douglas production function with a total factor productivity value of 3.91 in 2011 and an elasticity of output to labour of 0.57 and an elasticity of output to capital of 0.33, both of which calculated as the ratio of the NFCs’ labour and capital costs over their GVA, respectively, which represent the values of these ratios in the years prior to the pandemic.
The difference between the return and user cost can be interpreted as a measure of windfall profits when it is positive or an indicator of financial loss when it is negative. The specific differences featured in the exhibit should be interpreted with caution for a number of reasons. Firstly, the NFCs’ fixed assets do not include all of their productive assets; they also use working capital (cash plus trade receivables plus inventories less trade payables), which tends to be positive. Secondly, the cost of capital is estimated assuming a constant, real, after-tax financial return of 4% throughout the entire period. It would be more accurate to estimate a weighted cost of the equity and debt the companies use to finance their assets for each time period, factoring in the financiers’ interest rates and equity risk premiums. Considering those adjustments, the figure of 4% should be seen as a floor and proxy for an unknown financial cost. Lastly, profit includes the remuneration earned by business owners and executives that are not included in staff costs in the companies’ profit and loss accounts.
References
PÉREZ, F., MAS, M. and FERNÁNDEZ DE GUEVARA, J. (dirs.), BENAGES, E. and ROBLEDO, J. C. (2023). El stock de capital en España y sus comunidades autónomas. Análisis de los cambios en la composición de la inversión y las dotaciones de capital entre 1995 y 2022 [The stock of capital in Spain and its autonomous regions. Analysis of the changes in the composition and use of capital between 1995 and 2022].
Working Papers, No. 1/2023. Bilbao: BBVA Foundation.
https://www.fbbva.es/publicaciones/el-stock-de-capital-en-espana-y-sus-comunidades-autonomas-1964-2022/SALAS FUMÁS, V. (2022).
La Empresa Española: Del Euro a la COVID-19 [The Spanish corporation: From the euro to Covid-19.] Zaragoza University Press.
SALAS FUMÁS, V. (2024a).
Fixed capital formation in the non-financial corporate sector of the Spanish Economy: Crisis, Recovery and Prospects. Technical Notes 3/2024. Madrid: Funcas.
https://www.funcas.es/documentos_trabajo/fixed-capital-formation-in-the-non-financial-corporate-sector-of-the-spanish-economy-crisis-recovery-and-prospects/SALAS FUMÁS, V. (2024b). Los beneficios empresariales en España [Corporate profits in Spain].
Revista Economistas: España 2023. Un balance, No. 185, pp. 141-149.
Vicente Salas Fumás. Professor Emeritus at Zaragoza University and Fellow Researcher at Funcas