
Public support for broadband deployment in Spain: Improving connectivity and competitiveness
Public subsidies to foster broadband deployment have led to notable improvements in Spain’s connectivity levels over the last decade, positioning the country among the leaders within the EU. The improvements are most notable in smaller municipalities, highlighting the need to focus future such schemes primarily on these geographic areas.
Abstract: Spain has experienced an increase in connectivity over the past decade, positioning itself as one of the leading countries in the European Union. Public support through broadband deployment subsidies has positively contributed to this evolution. Between 2013 and 2020, broadband deployment support programs in Spain mobilized a total investment of 672 million euros, with public support accounting for 51% of this total. Spain’s competition authority, the CNMC, conducted a quantitative study of these subsidies between 2013 and 2020, which concluded that they have been effective in improving connectivity and creating positive competition synergies by increasing the variety of operators. Indeed, in 2020, nearly 4,000 municipalities out of more than the 8,000 existing municipalities had an active connexion to fiber optic networks (FTTH), constituting an enormous improvement compared to 2013, where only 270 municipalities (the most populated) had FTTH. Similar improvement is found from the perspective of concentration, considering that the number of municipalities with FTTH connections and a single operator decreased from 87% to 9% between 2013 and 2020. The improvements are most notable in smaller municipalities, with populations of fewer than 10,000 inhabitants, suggesting that public efforts should focus on fostering broadband deployment improvements in these types of municipalities.
Introduction
Between 2013 and 2020, broadband deployment support programs in Spain mobilized a total investment of 672 million euros (635 million euros from PEBA-NGA projects and 37 million euros from regional programs), with public support accounting for 51% of this total (318 million euros in state aid and 27 million euros in regional aid). The research paper “Quantitative Analysis of Public Support for Broadband Deployment in Spain” [EI/01/2022] [1], approved by the CNMC Council on December 20th, 2022, conducted an ex-post impact evaluation of this public aid. The study aimed to explain mainly two aspects: 1) how and to what extent the aid contributed to improving user connectivity (retail-level use of the new infrastructure); and 2) whether the aid improved the competitive situation at the municipal level (degree of concentration of major operators) over time.
This article presents a summary of the study, highlighting the methodology applied (matching) and the main results obtained. The following section presents the characterization of the broadband market in Spain to provide an overview of the sector’s evolution between 2013 and 2020. Next, we present the methodology and results. Finally, we conclude with the main message that public support for broadband had the greatest effect in populations of fewer than 10,000 inhabitants, suggesting that public efforts should focus on these types of localities to foster broadband deployment improvements.
Characterization of the broadband market in Spain
In 2020, nearly 4,000 municipalities out of more than the 8,000 existing municipalities had an active connexion to fiber optic networks (FTTH), constituting an enormous improvement compared to 2013, where only 270 municipalities (the most populated) had FTTH. Indeed, this evolution implies the existence of FTTH coverage for almost all populations with more than 10,000 inhabitants, as illustrated in Exhibit 1 showing the situation in 2013 (upper exhibit) and in 2020 (lower exhibit), where it is possible to see a positive correlation between most-populated areas and FTTH connectivity.
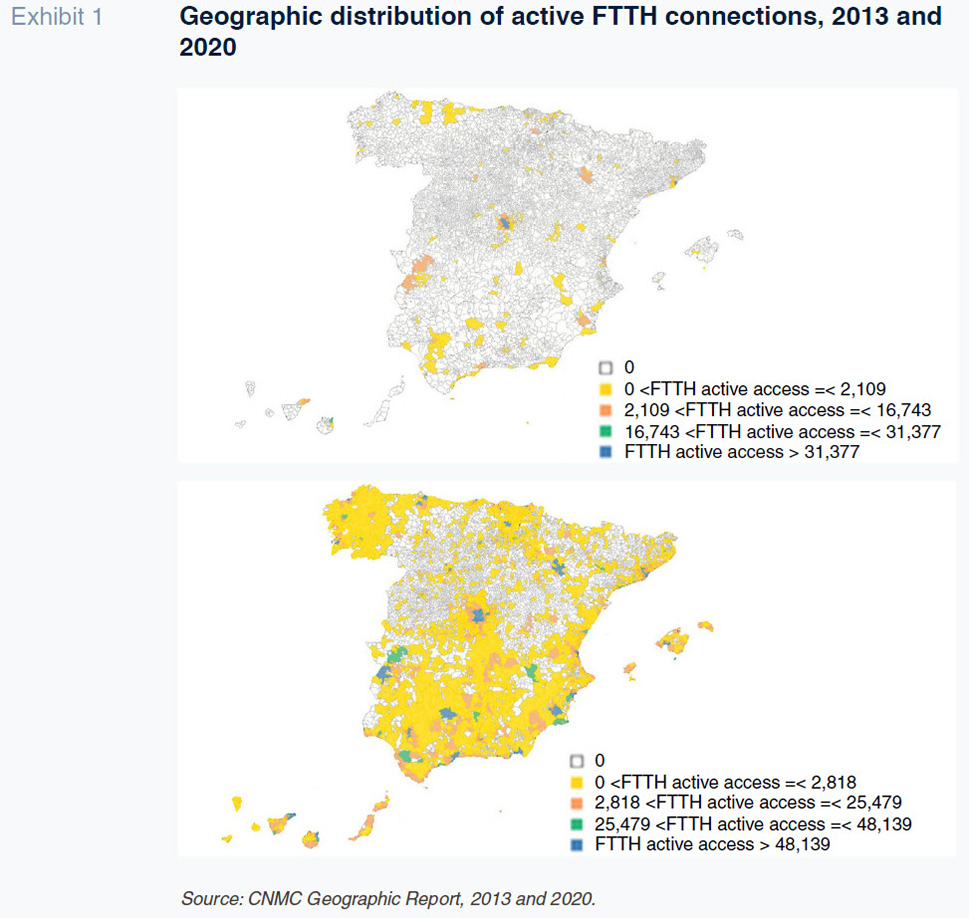
Regarding the demographic distribution of these connections, more than half of the active fiber optic access points in 2013 were concentrated in Madrid and Barcelona, while municipalities with populations of up to 50,000 inhabitants only accounted for 10% of them. In terms of the presence of the main operator, in 2013, most fiber connections (more than 95%) belonged to Telefónica. Out of the 270 municipalities with active connections, there were only 36 (13%) municipalities where Telefónica’s market share was not 100% (the metropolitan areas of Madrid and Barcelona and other provincial capitals and large towns).
These numbers contrast with the demographic distribution of Spain where more than 97% of Spanish municipalities have less than 50,000 inhabitants. Therefore, the FTTH market was characterized by low penetration focused on large municipalities and high concentration, with Telefónica as nearly the only operator.
In contrast, by 2020, the FTTH market had grown significantly (more than twenty times more connexions compared to 2013), with 11.2 million retail access points, distributed across every kind of municipality in term of population, although smaller and rural municipalities still had fewer access points in proportion. Telefónica’s market share was reduced to 40%, and the number of municipalities with active access reached 3,964, representing 96% of the population.
From a connectivity perspective, the national connectivity rate, calculated as the ratio between the number of active connections and the total of households and business premises in each municipality, increased from 3.2% in 2013 to an average of 35% in 2020, with values exceeding 50% in municipalities with more than 10,000 inhabitants. Connectivity in rural areas (less than 5,000 inhabitants) has improved over time, especially in municipalities with 1,000 to 5,000 inhabitants. In this regard, in 2013, 83% of municipalities with fewer than 5,000 inhabitants had no fiber, declined to 61% in 2020.
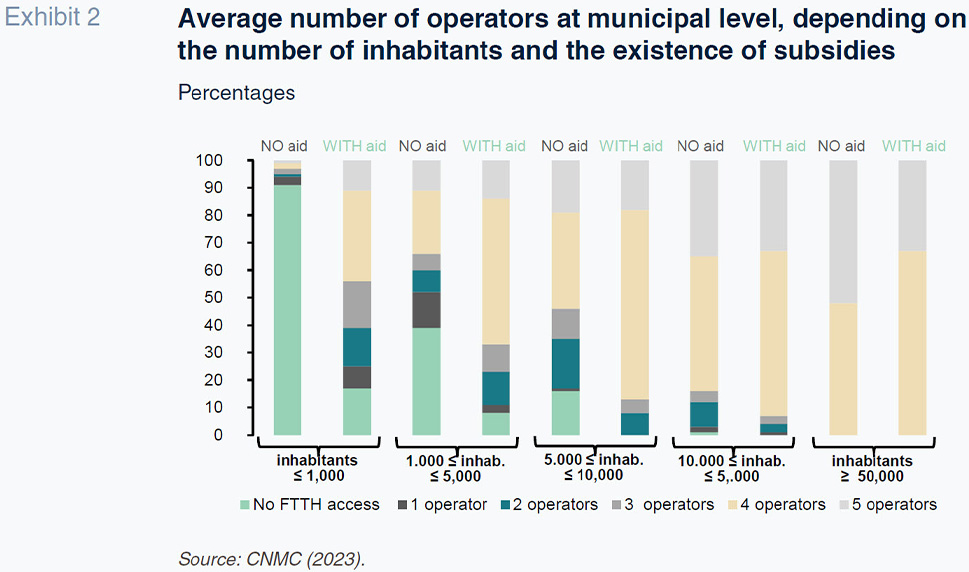
Regarding the evolution of the number of operators in each municipality, in 2013, as previously mentioned, fiber connexion was concentrated in municipalities with more than 10,000 inhabitants. In the population group between 10,000 and 50,000 inhabitants, close to 20% of the municipalities had active FTTH connections, mostly belonging to Telefónica; whereas in the municipalities with more than 50,000 inhabitants, fiber connection was frequent (more than 70% of these municipalities), although only 22% had more than one operator.
However, by 2020, most municipalities with more than 1,000 inhabitants had more than one operator, with the percentage of municipalities with four or five operators increasing with population size. This progress, illustrated in the Exhibit 2, marked a notable contrast to the situation in 2013, showing greater fiber optic penetration and increased competition in 2020.
Similar improvement is found from the perspective of concentration, considering that the number of municipalities with FTTH connections and a single operator decreased from 87% to 9% between 2013 and 2020. Indeed, in terms of market shares, the concentration ratio of the main operator (CR1) at the municipal level decreased from 99% in 2013 to 62% of total active access points in 2020 (In both years, Telefónica was the main operator.)
Against this background, where it is possible to see a clear general improvement in both connectivity and competitiveness, the quantitative analysis contained in the next section tried to assess which is the influence of the subsidies to this evolution and if its magnitude depends on the municipality’s population size.
Quantitative Analysis: Methodology and results
Methodology
To assess whether the subsidies achieved their objectives in terms of connectivity and also had a positive impact on competition, a quantitative impact evaluation focused on municipal fiber optic deployment subsidies granted from 2013 to 2020 is conducted. The technique used is known as Propensity Score Matching (PSM), summarized in Exhibit 3.
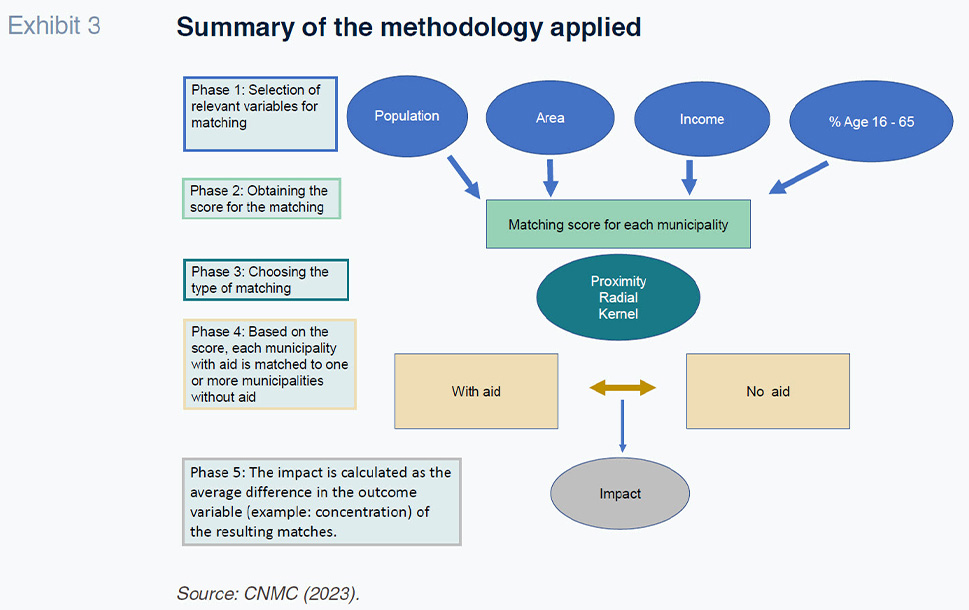
Essentially, this technique aims to recreate a dynamic parallel scenario where subsidies did not exist by constructing “twin” municipalities (similar counterparts) to those receiving subsidies. These twin municipalities are created using combinations of relevant variables for subsidy allocation that are sufficiently representative to characterize the different types of municipalities existing before the intervention. In our case, considering the data availability and potential factors influencing the decision to invest in fiber optic deployment, the variables used (phase 1 of the diagram) include population, area, average income per person, and the percentage of the population aged from 16 to 65 in each municipality.
Once the variables are determined, the methodology balances the weights of each variable and constructs a twin municipality identifier called pscore (phase 2 of the diagram) using different matching criteria (phase 3 of the diagram) to pair it with its most similar real municipality (phase 4 of the diagram). Finally, the average impact of the subsidy program (phase 5) is captured by the difference in outcome variables (in our case, connectivity rate and concentration ratio in 2020) between municipalities that received subsidies and their matched counterparts that did not. This difference allows attributing changes in fiber optic usage and market concentration to the subsidy program.
Results
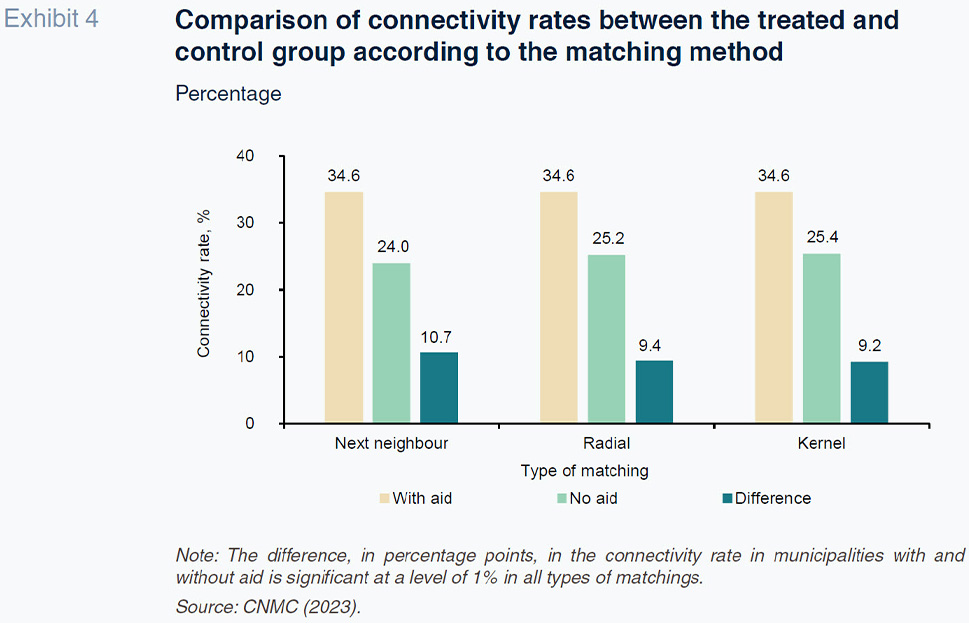
The analysis conducted on a large number of municipalities has allowed for extracting representative results both at the national level and based on municipality population. Thus, on a global scale, as depicted in Exhibit 4, it is observed that by the end of 2020, municipalities receiving subsidies show an average access ratio between 9.24 and 10.66 percentage points higher than their matched counterparts without subsidies. This outcome indicates that the subsidies have been effective in achieving their primary objective of increasing broadband usage, contributing to Spain’s leading position in terms of high-speed connectivity within the European Union (European Commission, 2022a).
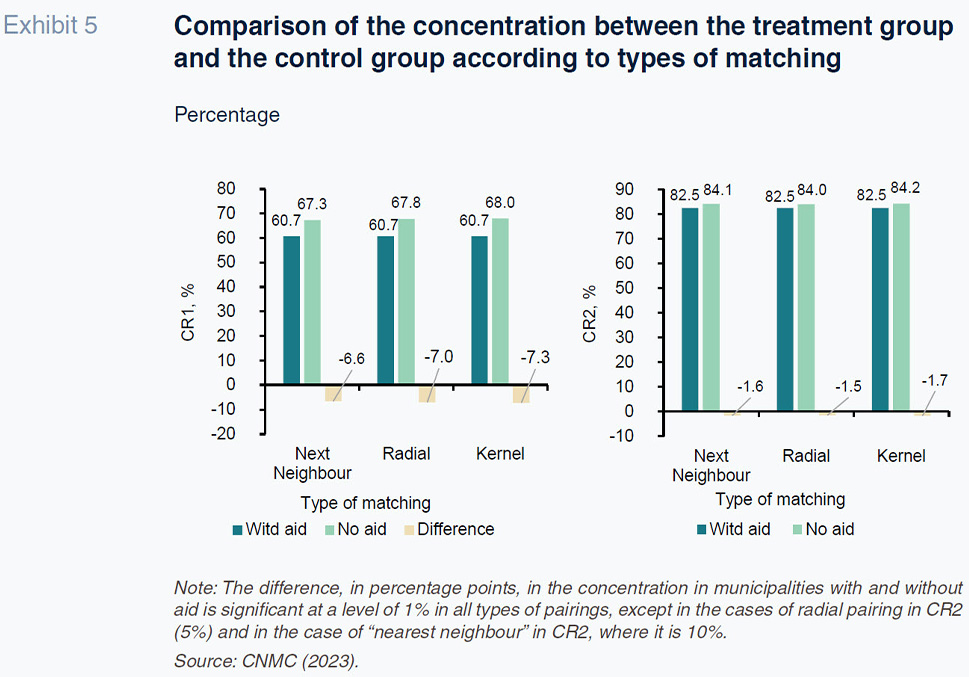
Furthermore, in a context marked by network economies with significant sunk costs, it is worth assessing whether the subsidies were designed to create deployment incentives for operators, which would foster consumer choice towards less concentrated and more competitive markets. In this regard, as noted in the market description, there has been a shift from a situation with a single operator in 2013 to multiple operators by 2020. Municipalities receiving subsidies show significant lower levels of concentration compared to their matched counterparts without subsidies. Specifically, both the market share of the largest operator (CR1) and the combined market share of the two largest operators (CR2) are significantly lower (between 6.6 and 7.3 percentage points for CR1, and between 1.5 and 1.7 percentage points for CR2), as shown in Exhibit 5.
Therefore, the subsidies have not only significantly increased connectivity but also generated positive effects on market competition due to third-party access rights to the subsidized network, generally enabling consumers to choose from different operators and services.
However, given the described territorial heterogeneity of Spain, which conditions both the potential need and effectiveness of such subsidies from various perspectives, it is necessary to disaggregate the results based on population. In principle, incentives for private investment by operators may be limited in sparsely populated municipalities with moderately aged composition, and which may also be surrounded by similar municipalities (without fiber deployment) where extending existing connections is not possible. However, at the same time, there is a social demand and a political priority to provide high-speed connectivity to these areas, aiming to retain population and promote socio-economic development.
With these premises, the results obtained from our population-disaggregated analysis reinforce the described reasoning, showing greater effects in the form of increased connectivity and lower concentration in municipalities with smaller populations (up to 10,000 inhabitants) that received most of the subsidies. This reflects that public subsidies have a greater incentivizing effect in municipalities where initially there might be less interest from private initiatives due to smaller operational scale. This can serve as a guide for public authorities in deciding where to focus their efforts.
Conclusions
The European Commission (2022b) notes that despite the significant increase in connectivity in rural municipalities across EU countries, there still exists a digital divide between urban and rural areas. The progressive development of increasingly cost-effective wireless technologies in terms of infrastructure and with greater capabilities raises the question of whether fiber optic deployment is the most efficient option in sparsely populated areas with adequate mobile coverage.
Conducting this exercise, which has recently been awarded by the World Bank as one of the winners in the category “Embedding competition in industrial policies through advocacy” at the Competition Advocacy Contest 2024, represents an act of transparency by the Spanish Administration, specifically the CNMC, contributing to the generation of evidence for the evaluation and improvement of public policies. It underscores the importance of continuing to design public subsidies that foster incentivizing effects through inter-administrative coordination, technological neutrality, and third-party access to publicly financed networks.
Undoubtedly, Spain has one of the highest high-quality connectivity levels in the European Union, in part due to public subsidies that enhanced competition without distorting the market. Indeed, the results suggest that public subsidies have a greater incentivizing effect in municipalities where there is initially less private sector interest due to smaller operational scales. This insight can guide public authorities in deciding where to focus their efforts when designing future schemes.
Notes
The content of this article is the responsibility of its authors and might not necessarily reflect the position of CNMC, which is only contained in the study published on the CNMC website.
References
CNMC. (2013 and 2020): Geographical analysis of broadband-services and NGA deployment in Spain (2013y 2020) (
https://www.cnmc.es/expedientes/estadcnmc07717).
CNMC. (2023).
Quantitative Analysis of Public Aid for Broadband Deployment in Spain, EI/01/2022.
EUROPEAN COMMISSION. (2022a).
The Digital Economy and Society Index (DESI).
EUROPEAN COMMISSION. (2022b).
State aid Scoreboard 2021. DG Competition Policy and Strategy State aid case support and policy, 6 September 2022.
Pablo Delgado Cubillo. CNMC and Universidad de Valladolid
Gabriella Németh Kecskeméti. CNMC